 |
|
|
|
|
|
|
| ||||||||||
|
|
|
|
|
|
|
||||
| ||||||||||
|
|
|
|
|
Persons using assistive technology might not be able to fully access information in this file. For assistance, please send e-mail to: mmwrq@cdc.gov. Type 508 Accommodation and the title of the report in the subject line of e-mail. Prevalence of Spina Bifida at Birth -- United States, 1983-1990: a Comparison of Two Surveillance SystemsJoseph M. Lary, Ph.D. Larry D. Edmonds, M.S.P.H. Division of Birth Defects and Developmental Disabilities National Center for Environmental Health Contributors from state programs * Abstract Problem/Condition: Spina bifida is a birth defect of the spinal column that is a substantial contributor to serious developmental disabilities in the United States. The risk for spina bifida and other neural tube defects (NTDs) can be reduced if women consume 0.4 mg of folic acid before and during the first trimester of pregnancy. Public health programs are being developed to prevent many NTDs by increasing the consumption of folic acid by women of childbearing age. To assess the national impact of these programs on the prevalence of NTDs at birth, multistate surveillance is needed to monitor secular trends in birth-prevalence rates. This report summarizes a collaborative effort by CDC and state birth defect surveillance programs in 16 states to a) obtain multistate, population- based data concerning the birth prevalence and descriptive epidemiology of spina bifida and b) determine the usefulness of combining state surveillance data to monitor national trends in the birth prevalence of NTDs. Reporting Period: This report presents data from birth defects surveillance systems in 16 states for the period 1983-1990 (specific periods covered varied by state). These findings are compared with CDC's Birth Defects Monitoring Program (BDMP) for the same period. Description of Systems: Population-based data about live-born and stillborn infants who have spina bifida were analyzed from 16 state programs. ** These 16 programs differed in size and racial/ethnic composition of the populations, surveillance methods, and completeness of case ascertainment. Hospital-based data about live-born and stillborn infants who have spina bifida also were analyzed from BDMP, a passive case ascertainment surveillance system that obtains data from participating hospitals in 50 states. Results and Interpretation: From 1983 through 1990, the birth-prevalence rate for spina bifida for the 16 states was 4.6 cases per 10,000 births; the BDMP rate was nearly identical (4.4 cases). State-specific rates varied substantially, ranging from 3.0 (Washington) to 7.8 (Arkansas). Both state- based and BDMP rates varied among racial/ethnic groups; in both systems, the rates were highest for Hispanics and lowest for Asians/Pacific Islanders. In both the state-based surveillance systems and BDMP, the annual rate of spina bifida for the total population declined during the period 1983-1990. Much of this decline can be attributed to increased prenatal diagnosis in the 1980s. However, because the decline in the rates of spina bifida and other NTDs in the United States began before the widespread availability of prenatal diagnostic services, an environmental component may have contributed substantially to the etiologies of these defects. The birth-prevalence rate of spina bifida was slightly higher among females than males. The ratio of female-to-male prevalence rates was 1.2 for both the state-based surveillance systems and BDMP. This ratio varied considerably among racial/ethnic groups and among states. The similarities of rates and trends in the birth prevalence of spina bifida between the state-based surveillance data and the BDMP data indicate that both types of surveillance systems can provide reliable information concerning national trends in the birth prevalence of spina bifida. Actions Taken: CDC and state birth defects surveillance programs will use results from this analysis to monitor national trends in the birth prevalence of spina bifida in the United States. Aggregated state-based surveillance data about spina bifida, anencephaly, and other NTDs will facilitate the monitoring of changes in NTDs after implementation of programs to increase folic acid consumption by women of child-bearing age. INTRODUCTION Spina bifida, a birth defect of the spinal column that causes varying degrees of paralysis, is a major contributor to serious developmental disabilities in the United States. The public health impact of this disability is substantial. Each year, approximately 1,500 infants are born with spina bifida (1). The annual medical and surgical costs (based on 1985 dollars) for persons who have spina bifida exceed $200 million (1), and the lifetime cost to society per person who has spina bifida is estimated to be $258,000 greater than the cost for persons who are unaffected by this disability (in 1988 dollars) (2). Dietary supplementation with folic acid (a B vitamin) reduces the risk for spina bifida and other neural tube defects (NTDs) (3). In 1992, the Public Health Service (PHS) published a recommendation that all women of childbearing age who are capable of becoming pregnant should consume 0.4 mg of folic acid per day to reduce the risk for having a pregnancy affected by spina bifida or other NTDs (3). PHS estimates that if all women in the United States followed this recommendation, the annual number of cases of spina bifida and other NTDs would decrease by 50% (3). Multistate surveillance of birth-prevalence rates is required to assess the national impact of public health programs to reduce the prevalence of NTDs by dietary supplementation with folic acid. Until recently, the only source of ongoing information about the national birth prevalence of spina bifida and other NTDs was CDC's Birth Defects Monitoring Program (BDMP), a hospital-based surveillance system that obtains information about birth defects among newborns from discharge abstracts submitted by participating hospitals (4). However, in the past decade, several states have established population-based birth defect surveillance systems that collect data regarding spina bifida and other serious birth defects. In this report, CDC has analyzed data from 16 states that maintain birth defects surveillance systems to obtain multistate, population-based data regarding the birth prevalence and descriptive epidemiology of spina bifida. This report expands the analysis of previously published state-based data for 1983-1990 (5) and compares the results with BDMP data for the same period to assess trends. METHODS The participating states provided surveillance data regarding spina bifida for the period 1983-1990; however, not all states had data for the entire period. All live-born and stillborn infants who had spina bifida *** were included in the analysis; however, in three states, data were not available for cases involving stillborn infants. Nine state surveillance systems (i.e., Colorado, Illinois, Maryland, Missouri, Nebraska, New Jersey, New York, North Carolina, and Virginia) identified cases of spina bifida from reports submitted by physicians and the staff of hospitals, clinics, and other health-care facilities (i.e., passive case ascertainment). Seven states (i.e., Arizona, Arkansas, California, Georgia, Hawaii, Iowa, and Washington) used trained surveillance staff to identify cases of spina bifida by systematic review of medical and other records from hospitals, clinics, and other health-care facilities (i.e., active case ascertainment). Birth-prevalence rates for spina bifida were determined for each state during the surveillance period. However, the specific surveillance periods covered from 1983 through 1990 varied by state (Table_1). BDMP rates for spina bifida in the United States for this period also were determined for comparison with state data. Because prevalence rates have differed previously between certain racial and ethnic groups, data were collected by race/ethnicity (i.e., white, black, Asian, **** American Indian, ***** and Hispanic) in both the state-based surveillance systems and BDMP. State-based surveillance systems primarily determined race/ethnicity from birth certificates, whereas BDMP determined race/ethnicity from hospital discharge summaries. Chi-square tests were used to compare differences between racial and ethnic groups in spina bifida rates and female-to-male rate ratios. To determine temporal trends in spina bifida rates and female-to-male rate ratios, a linear regression analysis was performed on the logarithms of the annual rates and rate ratios. RESULTS The participating states were grouped into the four U.S. census regions: Northeast, North Central, South, and West (Table_1). From 1983 through 1990, the birth-prevalence rate of spina bifida for these 16 states was 4.6 cases per 10,000 births. The rate of spina bifida determined by BDMP was nearly identical (4.4 cases). Although rates were similar by region, state-specific rates varied substantially, ranging from 3.0 (Washington) to 7.8 (Arkansas). State-based rates also varied among racial/ethnic groups. The rate was highest for Hispanics (6.0) and lowest for Asians (2.3). Rates for whites, blacks, Hispanics, and Asians were all significantly different (p<0.01); the rate for American Indians differed significantly only from the rate for Asians (p<0.01). Rates determined by BDMP also varied among racial/ethnic groups. The rates were highest for Hispanics and whites (both 4.7) and lowest for Asians (1.0). Most of the rates for racial/ethnic groups were significantly different (p<0.01); however, the rate for American Indians did not differ significantly from rates for any other group. The relative risk for spina bifida by race/ethnicity was determined for state-based data (Table_2). To evaluate potential confounding by state, the data were stratified by state, and a summary Mantel-Haenszel estimate for relative risk was calculated. The crude and adjusted relative risks were similar, indicating that minimal confounding occurred. Similar state- adjusted analyses were not made for BDMP data because of the limited number of cases and total births available from each state. For state-based surveillance systems, the annual rate of spina bifida for the total population declined from a peak of 5.9 cases per 10,000 births in 1984 to 3.2 cases per 10,000 births in 1990 (Figure_1). The rate for the total population decreased by 7.8% annually during the period 1983-1990 (p<0.01). The rate for whites declined 9.2% annually during this period (p<0.01), and the rate for Hispanics declined 10.6% annually (p<0.01). The rate for blacks decreased 4.7% annually (p="0.07)." Most of the BDMP rates for spina bifida also declined during the period 1983-1990 (Figure_2), although the declines were less than those in the state- based rates. The annual rate of spina bifida for the total population declined from a peak of 5.0 cases per 10,000 births in 1984 to 4.1 cases per 10,000 births in 1990. The rate for the total population decreased by 3.5% annually during the period 1983-1990 (p<0.05). The rate for whites decreased 2.2% annually; however, the decrease was not significant (p="0.11)." The rate for Hispanics decreased 9.3% annually (p="0.06)." The rate for blacks was variable and showed no significant trend over time. The birth-prevalence rate of spina bifida was slightly higher for females than for males (Table_3). The ratio of female-to-male prevalence rates was 1.2 for both the state-based surveillance systems and BDMP. This ratio varied considerably among racial/ethnic groups, although it was significantly different from 1.0 only among whites (p<0.01 for both the state-based systems and BDMP). The female-to-male rate ratio also differed considerably among states, ranging from 1.7 (North Carolina) to 0.9 (Illinois, Georgia, and New Jersey) (Table_3). Of the 16 states, 11 had ratios >1.0 and five had ratios <1.0. Although state-based spina bifida rates for the total population and for whites and Hispanics declined substantially from 1983 through 1990 (Figure_1), no significant decline occurred in the female-to-male rate ratio for the total population or for any racial/ethnic group (Figure_3). Among blacks, the female-to-male rate ratio was high in 1983 and 1984 compared with subsequent years, but declined substantially in 1985; the rate ratio remained relatively constant thereafter. The relatively high rate of spina bifida for blacks in 1983 and 1984 (Figure_1) resulted from excess cases among females during those years. Within the BDMP population (Figure_4), the ratio of female-to- male prevalence rates decreased slightly but significantly from 1983 to 1990 for the total population (p=0.01). No significant temporal trends in rate ratios among racial or ethnic groups were noted, although the ratio for whites decreased slightly (p=0.06). DISCUSSION Data from both the state-based surveillance systems and BDMP indicated a decline in spina bifida birth-prevalence rates in the U.S. population from 1983 through 1990, which is consistent with the decline in spina bifida rates in previous decades in the United States (6). Increasing utilization of prenatal diagnosis in the 1980s likely contributed to the decline in rates during that period (6). In a study of the impact of prenatal diagnosis on NTD rates during the period 1985-1994, selective abortion of fetuses prenatally diagnosed with spina bifida reduced the expected birth-prevalence rate of spina bifida by 20%-30% in five of six states (7). However, because the decline in the rates of spina bifida and other NTDs in the United States began before the wide-spread availability of prenatal diagnostic services, a substantial environmental component in the etiology of these defects may also exist (e.g., improved nutrition among pregnant women) (6). From 1970 through 1982, the average annual percent decline in the BDMP spina bifida rate was 4.0% (8); from 1983 through 1990, the decline was only 3.5%. Thus, environmental factors may have played a lesser role in the rate of decline from 1983 through 1990 than in earlier years, when prenatal diagnostic services were less often available. Studies published since 1981 indicate that dietary supplementation with folic acid can reduce the risk for spina bifida and other NTDs (3). In 1991, CDC recommended folic acid supplementation for women who previously had had an infant or fetus affected by an NTD and who planned to have more children (9). CDC recommended that these women take a 4-mg daily dose of folic acid (under a physician's supervision) beginning at least 1 month before conception and continuing throughout the first trimester of pregnancy. Subsequently, PHS issued a recommendation that all women of childbearing age who are capable of becoming pregnant should consume 0.4 mg of folic acid per day to reduce their risk for having an NTD-affected pregnancy (3). The differences in spina bifida rates among the states included in this report (Table_1) can be attributed to several factors, including differences in completeness of case ascertainment; however, the rates of states that have active case ascertainment overlapped considerably with the rates of states that have passive case ascertainment. In addition, genetic and dietary differences and differences in the rate of utilization of prenatal diagnostic services also may have contributed to differences in rates by state. Rates of spina bifida were highest for Hispanics, followed by whites, blacks, and Asians. The prevalence rates for American Indians were between those of Hispanics and Asians. The relative differences in spina bifida rates by race/ethnicity corroborate reports of previous racial/ethnic differences in rates for spina bifida and other NTDs (i.e., anencephaly and encephalocele) (10-16). In metropolitan Atlanta, rates of anencephaly and spina bifida were 3.1 and 2.5 times higher for whites than blacks, respectively (10). In North Carolina, the rate of anencephaly (calculated from fetal and infant death certificate data) was 3.6 times higher for whites than blacks (11). In Los Angeles County, rates for anencephaly, spina bifida, and encephalocele were 1.8, 1.4, and 8.0 times higher for whites than blacks, respectively (12). The prevalence rate of spina bifida for Asians (i.e., Chinese and Japanese) in Los Angeles County was even lower than for blacks, although the population size was relatively small (i.e., 15,000 births). A low prevalence rate of spina bifida has been reported for Asians in California compared with that for whites (13). Higher prevalence rates of spina bifida for Hispanics compared with non-Hispanic whites and blacks have been noted in California (13), New York (14), Los Angeles (15), and in the National Collaborative Perinatal Project (16). Although most Hispanics living in California have different origins than those living in New York (i.e., Mexico and Puerto Rico, respectively), rates for Hispanics were similar in both states (17). The etiology of spina bifida might have a substantial genetic component, based on the significant racial/ethnic differences in the rates of spina bifida, both locally and nationwide (12,18). For the total U.S. population, the prevalence rate of spina bifida for females was higher than the rate for males (Table_3), although the female-to-male rate ratio was less than ratios that have been reported for anencephaly (6,19). The rate was higher for females than for males in all racial/ethnic groups, both for state-based surveillance data and BDMP data, but the difference was significant only for whites. In most populations, spina bifida occurs more often among females than males (19). Differential rates of spontaneous abortion for male and female fetuses may account for the differences in sex-specific prevalence rates for spina bifida and other NTDs (19). Combined data from studies of spontaneously aborted fetuses with NTDs indicated that 32 (56%) of 57 abortuses were male (19), suggesting that the overall excess of NTD-affected females among stillbirths and live-births may partially result from a higher spontaneous abortion rate for NTD-affected males than for NTD-affected females. Other factors that may account for sex-specific differences in prevalence rates are differences in a) the rate of development of female and male embryos and b) susceptibility to teratogenic insult (19). The proportion of females among the total cases of anencephaly and the birth-prevalence rate of this defect are positively associated (20). However, this association has not been documented for spina bifida (19,20). In this report, no statistically significant change in the female-to-male rate ratio occurred over time for state-based surveillance data (Figure_3), despite the steadily declining prevalence rate (Figure_1). For the BDMP data, a slight but statistically significant decrease occurred in the female-to-male rate ratio for the total population (Figure_4) that corresponded to the overall decrease in the prevalence rate over time (Figure_2). However, no consistent correlation was found in either system between annual fluctuations in the birth-prevalence rate and the female-to-male rate ratio. These findings are consistent with previous studies regarding the lack of a relationship between birth- prevalence rate and the proportion of females among the total cases of spina bifida. CONCLUSIONS Both the state-based surveillance systems and BDMP have provided useful data concerning national trends in the birth prevalence of spina bifida. Such data are needed to monitor changes in the prevalence of spina bifida and other NTDs following implementation of programs to increase folic acid consumption by women of child-bearing age. However, whereas these surveillance systems enable monitoring of overall changes in the prevalence rates of NTDs, they cannot determine the relative contributions of folic acid supplementation and termination of NTD-affected pregnancies to changes in NTD rates. To assess the impact of these factors on the rates of NTDs in the United States, data must be collected concerning a) the use of folic acid supplements by women of childbearing age and b) prenatal diagnosis and selective abortion of fetuses that have NTDs. References
The following persons also contributed to this report: T Flood, MD, Office of Chronic Disease Epidemiology, Arizona Dept of Health Svcs; M Brewster, PhD, Arkansas Reproductive Health Monitoring System; J Harris, MD, California Birth Defects Monitoring Program, California State Dept of Health Svcs; S Keefer, MS, Colorado Dept of Health; R Merz, MS, Hawaii Birth Defects Monitoring Program, Hawaii Dept of Health; H Howe, PhD, Div of Epidemiologic Studies, Illinois Dept of Public Health; D Krishnamurti, MS, Dept of Pediatrics, Univ of Iowa Hospitals and Clinics, Iowa City; S Panny, MD, Div of Hereditary Disorders, Maryland Dept of Health and Mental Hygiene; J Bakewell, Bur of Health Data Analysis, Missouri Dept of Health; M Seeland, Health Data Support Div, Nebraska State Dept of Health; P Costa, MA, Birth Defects Surveillance Program, Special Child Health Svcs, New Jersey State Dept of Health; C Olsen, PhD, Bur of Environmental Epidemiology and Occupational Health, New York State Dept of Health; R Meyer, PhD, State Center for Health and Environmental Statistics, North Carolina Dept of Environment, Health, and Natural Resources; L Ploughman, PhD, Dept of Human Genetics, Medical College of Virginia, Richmond; C Hill, Birth Defects Registry, Washington Dept of Health. ** These programs included the Arizona Birth Defects Monitoring Program; the Arkansas Reproductive Health Monitoring System; the California Birth Defects Monitoring Program; the Colorado Registry for Children with Special Needs; the Hawaii Birth Defects Monitoring Program; the Illinois Adverse Pregnancy Outcome Reporting System; the Iowa Birth Defects Registry; the Maryland Birth Defects Reporting and Information System; the Missouri Multi-Source Birth Defects Registry; the Nebraska Birth Defects Registry; the New Jersey Birth Defects Registry; the New York State Congenital Malformations Registry; the North Carolina Birth Defects Registry; the Virginia Congenital Anomalies Reporting and Education System; the Washington State Birth Defects Registry; and CDC's Metropolitan Atlanta Congenital Defects Program. *** As defined by International Classification of Diseases, 9th Revision, Code 741. **** Includes Pacific Islanders. ***** Includes Alaskan Natives. Table_1 Note: To print large tables and graphs users may have to change their printer settings to landscape and use a small font size.
TABLE 1. Birth prevalence * of spina bifida reported from 16 state-based birth defects surveillance systems and the Birth
Defects Monitoring Program (BDMP), by race/ethnicity -- United States, 1983-1990
======================================================================================================================================
                                                                       Race/Ethnicity
                                          ------------------------------------------------------------------------
                                                                                                        American
                                             White          Black         Hispanic       Asian &        Indian @       Total +
Surveillance      Years      Total live   ------------   ------------   ------------   ------------   ------------   ------------
system           covered      births +    Cases   Rate   Cases   Rate   Cases   Rate   Cases   Rate   Cases   Rate   Cases   Rate
---------------------------------------------------------------------------------------------------------------------------------
Northeast
  New Jersey    1985-1990       688,991     179    4.1      38    3.0      40    4.6       3    1.7       0    0.0     295    4.3
  New York      1983-1990     2,160,230     550    4.2     182    4.3     211    6.1      --     --      --     --     983    4.6
  Total                       2,849,221     729    4.2     220    4.0     251    5.8       3    1.7       0    0.0   1,278    4.5

North Central
  Illinois      1988-1989       374,955      79    2.8      19    2.3      --     --      --     --      --     --     118    3.1
  Iowa          1983-1990       319,714     159    5.2       2    2.2      --     --       0    0.0       1    7.1     166    5.2
  Missouri      1983-1986       303,647     147    5.8       8    1.8      --     --       2    7.8       0    0.0     157    5.2
  Nebraska      1983-1990       198,601      95    5.3       6    5.9       3    5.9      --     --       0    0.0     104    5.2
  Total                       1,196,917     480    4.7      35    2.4       3    5.9       2    3.7       1    2.2     545    4.6

South
  Arkansas      1983-1989       107,184      64    8.1      17    6.1      --     --      --     --      --     --      84    7.8
  Georgia       1983-1990       269,472     106    6.5      50    4.9      --     --       2    3.5       1   54.6     163    6.0
  Maryland      1984-1990       437,645     119    4.0      45    3.5      --     --      --     --      --     --     172    3.9
  North         1984-1988       456,631     190    5.8      46    3.6      --     --       3    7.4       4    6.0     243    5.3
    Carolina
  Virginia      1987-1989       264,593      78    4.0      21    3.3      --     --       0    0.0       0    0.0      99    3.7
  Total                       1,535,525     557    5.3     179    4.0      --     --       5    3.0       5    7.0     761    5.0

West
  Arizona       1986-1988       189,686      43    4.0       5    6.5      32    6.0       0    0.0      11    6.2      91    4.8
  California    1983-1988     1,029,765     245    4.4      21    2.7     171    6.8      26    2.2       4    5.9     486    4.7
  Colorado      1989-1990       106,188      36    4.5       0    0.0       9    5.1       0    0.0       1   11.7      53    5.0
  Hawaii **     1989-1990        39,773       6    6.3       0    0.0      --     --       7    2.5       0    0.0      13    3.3
  Washington    1987-1990       297,305      77    3.0       1    0.7       3    1.4       5    3.1       1    1.3      88    3.0
  Total                       1,662,717     407    4.0      27    2.6     215    6.3      38    2.2      17    5.1     731    4.4

Total                         7,244,380   2,173    4.5     461    3.7     469    6.0      48    2.3      23    5.0   3,315    4.6

BDMP            1983-1990     4,965,030   1,634    4.7     220    3.5     130    4.7       7    1.0       5    3.1   2,192    4.4
---------------------------------------------------------------------------------------------------------------------------------
 * Rate per 10,000 live births.
 + Includes persons from all racial/ethnic groups for whom data were available and persons for whom race was unknown.
 & Includes Pacific Islanders.
 @ Includes Alaskan Natives.
** Rates for Hawaii were estimated from the proportion of births by race in 1988. For 1989 and 1990, numbers were available only for
   total state births and for spina bifida cases by race.
======================================================================================================================================
Return to top. Table_2 Note: To print large tables and graphs users may have to change their printer settings to landscape and use a small font size.
TABLE 2. Relative risk for spina bifida reported from 16 state-based birth defects
surveillance systems, by race/ethnicity -- United States, 1983-1990
====================================================================================
                          Crude relative risk   Adjusted relative risk +
Race/Ethnicity                (95% CI) *               (95% CI)
------------------------------------------------------------------------
White                      1.00 &                   1.00 &
Black                      0.82 (0.70-0.90)         0.80 (0.72-0.88)
Hispanic                   1.43 (1.29-1.59)         1.41 (1.26-1.58)
Asian/Pacific Islander     0.49 (0.36-0.65)         0.51 (0.38-0.70)
American Indian/
  Alaskan Native           1.05 (0.69-1.58)         1.13 (0.74-1.74)
------------------------------------------------------------------------
* Confidence interval.
+ Adjusted across states.
& Referent group.
====================================================================================
Return to top. Figure_1  Return to top. Figure_2  Return to top. Table_3 Note: To print large tables and graphs users may have to change their printer settings to landscape and use a small font size.
TABLE 3. Ratio of female-to-male prevalence rates of spina bifida reported from 16 state-based birth defects surveillance
systems and the Birth Defects Monitoring Program (BDMP), by race/ethnicity -- United States, 1983-1990
===========================================================================================================================
                                       Female-to-male rate ratio
Surveillance         --------------------------------------------------------------
system               White     Black     Hispanic     Asian *     American Indian +     Total
---------------------------------------------------------------------------------------------
Northeast
  New Jersey          1.08      1.09       0.58        0.54               E &            0.92
  New York            1.41      1.32       1.18         --               --              1.33
  Total               1.32      1.28       1.05        0.54               E              1.22

North Central
  Illinois            0.98      0.75        --          --               --              0.88
  Iowa                1.01      0.00        --           E                E              0.98
  Missouri            1.17      0.15        --         0.00               E              1.04
  Nebraska            1.28        E          E          --                E              1.50
  Total               1.10      0.77         E         0.00               E              1.06

South
  Arkansas            1.26      1.89        --          --               --              1.38
  Georgia             1.11      0.58        --         1.06               E              0.90
  Maryland            1.04      1.08        --          --               --              1.05
  North Carolina      1.82      1.59        --         0.54             3.22             1.68
  Virginia            1.22      0.63        --           E                E              1.07
  Total               1.33      0.99        --         0.71             4.26             1.22

West
  Arizona             0.76      0.70       1.03          E              1.21             0.90
  California          1.45      0.41       0.98        1.45             0.99             1.20
  Colorado            1.05        E        2.06          E              0.00             1.09
  Hawaii              0.52        E         --         2.57               E              1.21
  Washington          1.40      0.00       2.03        0.71             0.00             1.32
  Total               1.29      0.43       1.03        1.46             0.90             1.16

Total                 1.26      1.05       1.05        1.15             1.33             1.18

BDMP                  1.24      1.03       1.21        2.69             1.55             1.22
---------------------------------------------------------------------------------------------
* Includes Pacific Islanders.
+ Includes Alaskan Natives.
& E designates a ratio that could not be calculated because of division by zero.
===========================================================================================================================
Return to top. Figure_3 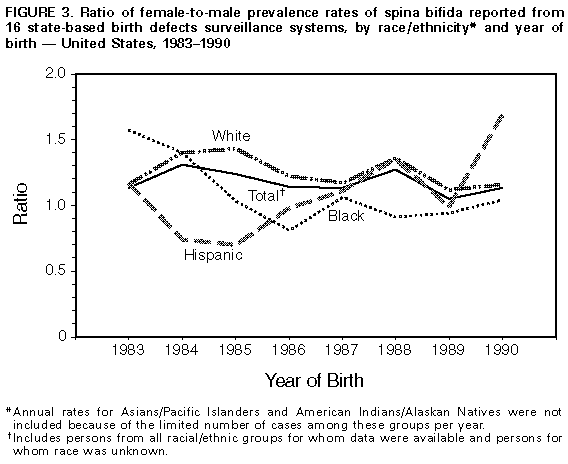 Return to top. Figure_4 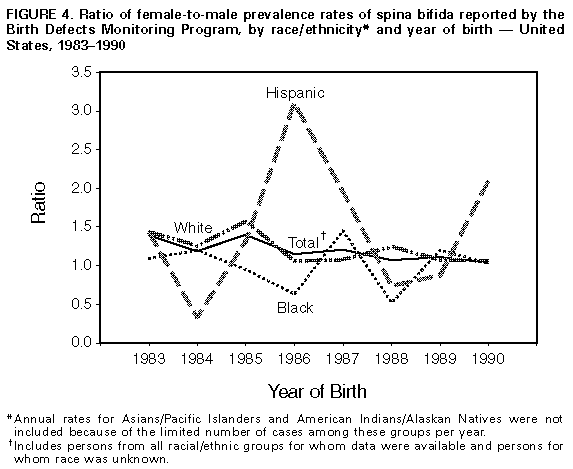 Return to top. Disclaimer All MMWR HTML versions of articles are electronic conversions from ASCII text into HTML. This conversion may have resulted in character translation or format errors in the HTML version. Users should not rely on this HTML document, but are referred to the electronic PDF version and/or the original MMWR paper copy for the official text, figures, and tables. An original paper copy of this issue can be obtained from the Superintendent of Documents, U.S. Government Printing Office (GPO), Washington, DC 20402-9371; telephone: (202) 512-1800. Contact GPO for current prices. **Questions or messages regarding errors in formatting should be addressed to mmwrq@cdc.gov.Page converted: 09/19/98 |
|||||||||
This page last reviewed 5/2/01
|