 |
|
|
|
|
|
|
| ||||||||||
|
|
|
|
|
|
|
||||
| ||||||||||
|
|
|
|
|
Persons using assistive technology might not be able to fully access information in this file. For assistance, please send e-mail to: mmwrq@cdc.gov. Type 508 Accommodation and the title of the report in the subject line of e-mail. Mumps Surveillance -- United States, 1988-1993Frederik P.L. van Loon, M.D., Ph.D., M.P.H., M.B.A.(1) Sandra J. Holmes, Ph.D., M.H.A.(1) Barry I. Sirotkin, M.S.(1) Walter W. Williams, M.D., M.P.H.(1) Stephen L. Cochi, M.D., M.P.H.(1) Stephen C. Hadler, M.D.(1) Mary Lou Lindegren, M.D.(2) (1) National Immunization Program (2) Division of HIV/AIDS National Center for Infectious Diseases Abstract Problem/Condition: CDC monitors the incidence of mumps in the United States through the passive reporting of cases to its National Notifiable Disease Surveillance System (NNDSS). Reporting Period Covered: 1988-1993. Description of System: Weekly reports to the NNDSS from 48 states and the District of Columbia were used to calculate incidence rates for mumps. State immunization requirements were obtained from the U.S. Department of Health and Human Services. Results: After the licensure of mumps vaccine in the United States in December 1967 and the subsequent introduction of state immunization laws in an increasing number of states, the reported incidence of mumps decreased substantially. The 1,692 cases of mumps reported for 1993 represent the lowest number of cases ever reported to NNDSS and a 99% decrease from the 152,209 cases reported for 1968. During 1988-1993, most cases occurred in children 5-14 years of age (52%) and in persons greater than or equal to 15 years of age (36%). Although the incidence decreased in all age groups, the largest decreases (greater than 50% reduction in incidence rate per 100,000 population) occurred in persons greater than or equal to 10 years of age. Overall, the incidence of mumps was lowest in states that had comprehensive school immunization laws requiring mumps vaccination and highest in states that did not have such requirements. Interpretation: Because of the extensive use of mumps vaccine and the increased number of states that had enacted mumps immunization laws, the number of reported mumps cases decreased further since the marked decline that began during the early 1970s. The earlier shift in incidence from children of school ages to older persons that was noted during 1985-1988 continued until 1992, when the proportion of cases occurring in children of school ages increased and exceeded the proportions occurring in other age groups. Actions Taken: All health-care providers are encouraged to a) report mumps cases to their local and state health departments for transmission to NNDSS and b) enact school immunization laws requiring mumps vaccination. INTRODUCTION Mumps vaccine was licensed in the United States in December 1967, and the Advisory Committee on Immunization Practices (ACIP) recommended that its use be considered for children approaching puberty, for adolescents, and for adults (1). At that time, the public health community considered mumps control a low priority, and ACIP stated that mumps immunization should not compromise the effectiveness of established public health programs (1,2). In 1972, however, ACIP recommendations were strengthened to indicate that mumps vaccination was particularly important for the initially targeted age groups; in 1977, ACIP recommended the routine vaccination of all children greater than or equal to 12 months of age. The use of mumps vaccine in young children was facilitated by the introduction (in 1977) and extensive use of measles-mumps-rubella (MMR) vaccine (3). In 1980, stronger recommendations called for the vaccination of susceptible * children, adolescents, and adults, unless such vaccination was contraindicated (4). Following these increasingly comprehensive recommendations and the enactment of state laws requiring mumps vaccination for school entry and attendance, the reported incidence of mumps declined steadily. However, during 1986 and 1987, large outbreaks occurred among underimmunized cohorts of persons born during 1967-1977, resulting in a shift in peak incidence from persons 5-9 years of age to persons 10-19 years of age (5). In 1989, ACIP recommended that a second dose of measles-containing vaccine be administered to children 4-6 years of age (at time of entry to kindergarten or first grade), and designated MMR as the vaccine of choice (6). This report is a summary of mumps surveillance data in the United States for 1988-1993. Surveillance data from earlier time periods have been published previously (7,8). METHODS Incidence rates for mumps were calculated from weekly reports of cases sent to CDC's National Notifiable Disease Surveillance System (NNDSS). Cases were reported from 49 areas (i.e., 48 states and the District of Columbia); mumps was not a reportable disease in Mississippi and Rhode Island during 1988 and in New Mexico and Oregon during 1988-1993. Reports of outbreaks also were received sporadically throughout the entire time period. Population estimates for 1988-1993 were based on 1990 U.S. census data. The U.S. Department of Health and Human Services provided information on state immunization requirements. Reports of mumps cases were analyzed to determine the distribution of patients by age, race, and ethnicity; the month of report; and the reporting area. Accurate information concerning the race and ethnicity of patients was not available for 1988 and 1989; however, these variables were reported by 41 states in 1990, 38 in 1991, 34 in 1992, and 43 in 1993. This report includes race and ethnicity data from 28 states in which such data were reported for greater than 50% of cases during each of these 4 years. RESULTS General Trends Except for a minimal increase in 1989, the incidence of mumps continued to decline during 1988-1993, from 2.0 per 100,000 population in 1988 to 0.7 per 100,000 population in 1993 (Figure_1). Only 1,692 mumps cases were reported for 1993; this was the lowest number ever reported to NNDSS and a 99% reduction from the 152,209 cases reported for 1968. Incidence by Age Groups of Patients During 1988-1993, patient age was reported for 85% of cases (Table_1). During 1991-1993, mumps incidence rates decreased in all age groups from rates for 1988-1990; the largest decreases (i.e., greater than 50% reductions) occurred among persons 10-19 years of age and among children less than 1 year of age (Table_2). From 1988 through 1991, annual incidence rates for children ages 10-14 years (5.3-7.8 per 100,000) exceeded those for children ages 5-9 years (4.5-6.6 per 100,000) (Figure_2). In 1992 and 1993, incidence rates for children ages 5-9 years were minimally higher than those for children ages 10-14 years (3.2 vs. 2.6 per 100,000 in 1992, and 2.8 vs. 1.9 per 100,000 in 1993). During the entire period, an average of 52% (range: 47%-55%) of reported cases for which patient age was known occurred in children ages 5-14 years; 36% (range: 31%-38%), in persons ages greater than or equal to 15 years; and 11% (range: 9%-18%), in children ages 1-4 years (Table_1). The remaining 1% of cases occurred in children less than 1 year of age. Although this pattern was similar throughout the 6-year period, a smaller proportion of cases occurred in children ages 5-14 years in 1993 compared with 1988 (50% and 55%, respectively) and in persons ages 15-19 years (12% and 21%, respectively). A larger proportion of cases occurred in children ages 1-4 years (18% and 9%, respectively) and in persons ages greater than or equal to 20 years (20% and 13%, respectively). Incidence by Race/Ethnicity of Patients During 1990-1993, race and ethnicity were reported for approximately two thirds of cases in each of 28 states and the District of Columbia. Mumps incidence decreased for all races during this 4-year period. For each year, the highest incidence was among black persons, ranging from 1.2 to 8.2 times the incidence of any other racial group. In every age group, incidence rates for black persons exceeded rates for the other racial groups; this relationship was most notable for persons 5-19 years of age (Figure_3). Although incidence rates for Hispanics exceeded the rates for non-Hispanics in every age group, the differences in rates were minimal for children less than 5 years of age and for persons greater than or equal to 20 years of age (Figure_4). The greatest difference in incidence rates between Hispanics and non-Hispanics were for persons 5-19 years of age. State Immunization Laws Comprehensive state immunization laws for mumps require documentation of vaccination for all children attending school (i.e., kindergarten through grade 12 {grades K-12}); partial immunization laws require documentation of vaccination for selected groups of children (i.e., at entry to school or at grades K-5, K-6, or K-10). During 1988-1993, the number of states that had adopted comprehensive immunization laws increased from 16 to 40 (Table_3). In 1993, only four states had partial immunization laws, and seven other states, including a state that did not report mumps cases, had no school immunization laws (Figure_5). In states that had comprehensive immunization laws during 1988-1993, the average annual incidence rate of mumps for persons of all ages was 1.3 cases per 100,000 population. In comparison, the reported incidence was 1.8 cases per 100,000 population in states that had partial immunization laws and 2.9 cases per 100,000 population in states that did not require mumps vaccination. For persons 5-19 years of age, the average annual incidence rate per 100,000 population was 3.8 for states that had comprehensive immunization laws, 5.4 for states that had partial immunization laws, and 9.4 for states that did not require mumps vaccination (Table_3). In 1989, three of four states and, in 1990, one of two states reporting greater than 500 cases of mumps did not have comprehensive immunization laws. Geographic Distribution of Cases In 1988, 1992, and 1993, no state reported greater than 500 cases (Table_4). In 1989, four states (i.e., California, Louisiana, Maryland, and Texas) each reported greater than 500 cases. In 1990, both California and Maryland reported greater than 500 cases; in 1991, both California and Florida reported 500 cases. In 1993, all but four states (i.e., Kentucky, Maine, Montana, and South Dakota) that routinely report mumps cases reported at least one case. Seasonality During 1988-1993, mumps incidence, as determined by month of reporting, was consistently highest during winter and early spring and lowest during the summer (data not shown). This seasonal trend did not change during the 6 reporting years, despite the overall decline in mumps incidence during this time period. DISCUSSION Since the introduction of mumps vaccine in the United States in 1967, several developments have contributed substantially to the 99% reduction in mumps incidence. These developments include a) an increasingly inclusive vaccination policy; b) the 1989 ACIP recommendation for a two-dose measles vaccination schedule, designating MMR as the preferred vaccine; and c) the enactment, in an increasing number of states since 1977, of state immunization laws that require mumps vaccination for school attendance. The introduction of mumps vaccine was associated with both an overall decline in reported disease incidence and a change in the epidemiology of the disease. During the prevaccine era and for greater than 10 years after vaccine licensure, the risk for mumps was highest among children 5-9 years of age. During the 1980s, concomitant with an overall decline in the incidence of mumps, the proportion of cases occurring in older children and adolescents increased (7-9). In 1980, ACIP had recommended vaccination for all susceptible children (i.e., no clinical history of disease), adolescents, and adults unless contraindicated (4). Nevertheless, during 1986 and 1987, outbreaks occurred among susceptible adolescents and young adults in high schools and colleges (10-13), hospitals (14,15), and in work places where persons are in close contact (16). This trend reflected underimmunization of the cohort born from 1967 through 1977, a period when vaccine was not administered routinely to children and the risk for exposure to mumps was decreasing. Thus, the age associated with the highest incidence shifted from children of school ages to older children, adolescents, and young adults. A less pronounced shift in incidence by age also occurred in 1982 (11). The incidence of mumps during 1988-1993 decreased among all age groups. The greatest decrease occurred among persons 10-19 years of age -- the same ages at which the greatest increases had occurred during 1986 and 1987, when a resurgence of outbreaks occurred among susceptible adolescents and young adults (10-16). Subsequent outbreaks have occurred among highly vaccinated populations. During 1989-1990, a large outbreak occurred among students in a primary and a secondary school; most of the students in these schools had been vaccinated, suggesting that vaccination failure, in addition to failure to vaccinate, might have contributed to the outbreak (17). In 1991, another outbreak occurred in a secondary school where most of the students had been vaccinated; this outbreak also was mostly attributed to primary vaccination failure (18). The shift in higher risk for mumps to these other age groups (i.e., from younger children of school ages to older children, adolescents, and young adults) -- which occurred after the routine use of mumps vaccine was initiated -- has persisted despite minimal fluctuations in disease incidence that occurred in recent years among the various age groups. The age distribution of persons who had mumps during 1988-1993 was similar to that of the 3 preceding years (8). Although the majority of cases during 1988-1993 (52%) and 1985-1987 (58%) occurred in children 5-14 years of age, a higher proportion (75%) was reported in this age group during the 5 years after vaccine licensure (i.e., 1967-1971) and before the routine administration of mumps vaccine (11). Conversely, an increasingly larger proportion of cases in persons greater than or equal to 15 years of age have been reported in recent periods (i.e., 1967-1971, 8%; 1985-1987, 28%; 1988-1993, 36%). The large decrease in the incidence of mumps during 1988-1993 also might reflect the change in the recommended use of MMR. In 1989, after the resurgence of measles among children of school ages during the late 1980s, ACIP recommended a two-dose measles vaccination schedule using MMR as the preferred vaccine (6). The implementation of the two-dose MMR vaccination schedule, with the second dose administered at 4-6 years or at 11-12 years (6,19), probably affected the incidence of mumps by conferring immunity to children who had had primary vaccination failure. The single most important measure for reducing mumps incidence has been the enactment of state immunization laws requiring that students be vaccinated (7,8,11,20). States with comprehensive immunization laws had lower incidence rates for mumps than states without such laws; the highest incidence rates occurred in states with no laws, and intermediate incidence rates were reported from states with partial laws. In addition, the shift in the age distribution of patients that was noted during the mumps outbreaks of the 1980s occurred only in states with partial or no school immunization laws (11). Although the association between mumps incidence rates and state immunization laws during 1993 did not differ from that in 1988, the number of states that had comprehensive immunization laws more than doubled, and this probably contributed to the 65% decrease in the national incidence of mumps during 1993 in comparison with 1988. For example, Tennessee adopted a comprehensive immunization law in September 1988 and noted a 91% decrease in the incidence of mumps during 1993 in comparison with 1988. Mumps incidence rates also decreased in the seven states that did not have immunization laws. These decreases might be attributed partially to the decreased number of cases in states that had immunization laws, which likely resulted in decreased virus transmission to persons in neighboring states that did not have such laws. Similarly, the decreased number of cases in infants and children of preschool ages probably reflects the decreased transmission in families as a result of the reduced incidence among children of school ages. During 1990-1993, mumps incidence decreased among all racial groups. However, incidence rates were higher for black persons, particularly for those 5-19 years of age. In areas without state immunization requirements for school attendance, the higher incidence rate of mumps for blacks may reflect lower vaccination rates for black children in comparison with white children and adolescents (5). Although overall incidence rates for mumps declined, the seasonal pattern for 1988-1993 remained consistent with the pattern characteristic of earlier prevaccine and postvaccine licensure periods (7-9). The mumps surveillance data for 1988-1993 have certain inherent limitations. Because the NNDSS depends on passive reporting, iadditional validation studies are required to estimate the completeness of reporting and accuracy of the data collected. Furthermore, the association between increased mumps vaccine coverage and decreased mumps incidence could not be confirmed because vaccination status of patients was not reported to NNDSS. From 1967 through 1993, an estimated 137 million doses of mumps vaccine (as MMR, monovalent mumps, or other combined vaccines) were distributed in the United States. The vaccine is safe, efficacious, and cost-beneficial in preventing mumps illness (21-23). Groups other than ACIP also have recommended mumps immunization; these groups include the American Academy of Pediatrics, which recommends mumps vaccination of children and adolescents (19), and the American College Health Association (ACHA), which recommends requiring that all students born after 1956 present documentation of vaccination against mumps before matriculation (24). Several approaches would ensure that high rates of vaccination are maintained and transmission of mumps is controlled. First, all health-care providers are encouraged to report mumps cases to their local and state health departments for transmission to NNDSS. Reporting of additional data, including vaccination status, via CDC's National Electronic Telecommunication System for Surveillance (NETSS) is currently being implemented. Second, all states are encouraged to enact comprehensive school immunization laws, if they have not already done so, to ensure that all students receive at least one dose of mumps vaccine. States should continue to implement the two-dose measles vaccination policy, using MMR for both doses, to further decrease mumps susceptibility. Third, other groups that are responsible for populations at risk for mumps (e.g., employers) are encouraged to adopt requirements similar to ACHA's recommendations (24). Fourth, recommended outbreak control measures for mumps (e.g., exclusion policies for susceptible students) should be applied more aggressively (25). As part of the Childhood Immunization Initiative, the national reduction goal for mumps (i.e., the maximum number of cases expected) for 1996 is 1,600 cases. Although the number of mumps cases reported for 1993 reflects achievement of this objective, the incidence could increase as a result of importation of cases and the increasing emphasis on surveillance. CONCLUSION Incidence rates for mumps in the United States have declined substantially since the licensure and widespread use of mumps vaccine. Policies for providing routine vaccination of young children, policies targeting older populations at risk, and the enactment of school immunization laws have all contributed to the decrease in mumps incidence. During 1988-1993, the incidence of mumps decreased further after the number of states with immunization laws increased and the two-dose vaccination schedule for measles using MMR was initiated. References
Not known to have become immune to mumps by either natural or artificial means. Figure_1 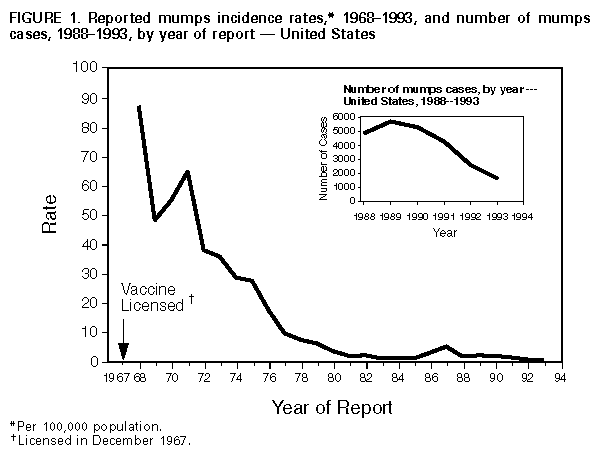 Return to top. Table_1 Note: To print large tables and graphs users may have to change their printer settings to landscape and use a small font size.
TABLE 1. Reported number of mumps cases, by age of patient and year of occurrence -- United States, * 1988-1993
==============================================================================================================================================================
                                                            Year of occurrence
                  ------------------------------------------------------------------------------------------------------------------------
                      1988              1989              1990              1991              1992              1993             Total
Age group         ------------      ------------      ------------      ------------      ------------      ------------     -------------
(yrs)              No.      %        No.      %        No.      %        No.      %        No.      %        No.      %        No.      %
------------------------------------------------------------------------------------------------------------------------------------------
   <1                61    1.5        106    2.1         40    0.9         23    0.7         36    1.7         14    0.9        280    1.3
  1-4               392    9.4        438    8.8        504   11.1        381   11.5        342   15.8        284   17.6      2,341   11.3
  5-9             1,022   24.5      1,194   24.0      1,068   23.5        811   24.4        572   26.4        497   30.8      5,164   24.8
10-14             1,284   30.7      1,324   26.7      1,312   28.9        900   27.1        442   20.4        316   19.6      5,578   26.8
15-19               861   20.6      1,198   24.1        948   20.9        639   19.2        394   18.2        186   11.5      4,226   20.3
>= 20               559   13.4        706   14.2        671   14.8        573   17.2        384   17.7        319   19.7      3,212   15.4

Age known         4,179  100.0      4,966  100.0      4,543  100.0      3,327  100.0      2,170  100.0      1,616  100.0     20,801  100.0

Age unknown         687    --         746    --         749    --         937    --         402    --          76    --       3,597    --

Total             4,866    --       5,712    --       5,292    --       4,264    --       2,572    --       1,692    --      24,398
------------------------------------------------------------------------------------------------------------------------------------------
* Includes the District of Columbia. Excludes states not reporting mumps cases (i.e., New Mexico and Oregon, 1988-1993; Mississippi and Rhode Island, 1988).
==============================================================================================================================================================
Return to top. Table_2 Note: To print large tables and graphs users may have to change their printer settings to landscape and use a small font size.
TABLE 2. Age-specific mumps incidence rates * during selected periods, by age
group -- United States +
==================================================================================================
                                                         Percentage change
                                                    ---------------------------
                       Incidence rates                  From          From
Age group     ---------------------------------      1985-1987      1988-1990
  (yrs)       1985-1987   1988-1990   1991-1993     to 1988-1990   to 1991-1993
-------------------------------------------------------------------------------
  < 1            2.4         1.7         0.6          (-29.2)        (-64.7)
  1-4            4.1         3.0         2.3          (-26.8)        (-23.3)
  5-9            9.7         6.1         3.5          (-37.1)        (-42.6)
10-14           16.9         7.7         3.3          (-54.4)        (-57.1)
15-19           10.3         5.6         2.3          (-45.6)        (-58.9)
 >=20            0.4         0.4         0.2             --          (-50.0)

Total            3.7         2.2         1.1          (-40.5)        (-50.0)
-------------------------------------------------------------------------------
* Per 100,000 population.
+ Includes the District of Columbia. Excludes states not reporting mumps cases (i.e., New Mexico
  and Oregon, 1985-1993; Mississippi, 1985-1988; Oklahoma, 1985-1987; Rhode Island, 1988).
==================================================================================================
Return to top. Figure_2 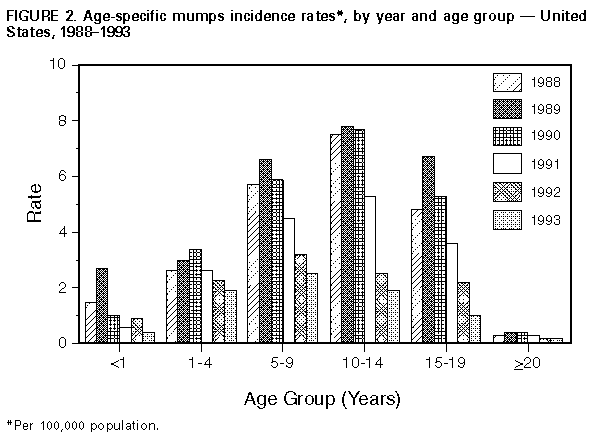 Return to top. Figure_3 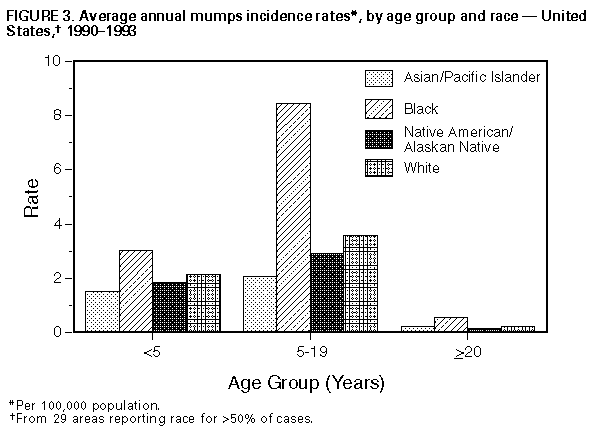 Return to top. Figure_4  Return to top. Table_3 Note: To print large tables and graphs users may have to change their printer settings to landscape and use a small font size.
TABLE 3. Reported mumps incidence rates * for persons 5-19 years of age, by type of
state immunization requirements + -- United States, & 1988-1993
================================================================================================
                                    State immunization requirements
         -------------------------------------------------------------------------------------
                 No laws @                  Partial laws **            Comprehensive laws ++
         -------------------------     -------------------------     -------------------------
                         Incidence                     Incidence                     Incidence
Year     No. of states     rate        No. of states     rate        No. of states     rate
----------------------------------------------------------------------------------------------
1988           14          11.2              19           6.7              16           5.9
1989           11          13.2              19           7.9              21           4.7
1990           11          18.7              19           5.5              21           3.9
1991            8           6.8               5           6.1              38           4.0
1992            8           2.8               5           4.8              38           2.3
1993            7           3.7               4           1.3              40           1.8

Total mean                  9.4                           5.4                           3.8

% decrease &&             (67.0)                        (80.6)                        (69.5)
----------------------------------------------------------------------------------------------
 * Cases per 100,000 population, adjusted for states not reporting mumps (i.e., New Mexico
   and Oregon, 1988-1993; Mississippi and Rhode Island, 1988).
 + Requirements represent classifications at the beginning of the calendar year.
 & Includes the District of Columbia.
 @ No requirement for mumps vaccination before entering school.
** Includes some children but not all children in kindergarten through grade 12 (grades K-12);
   California excluded for 1988 because information concerning age was not available.
++ Requires proof of immunity (i.e., documentation of vaccination or previous mumps infection)
   before entering school (e.g., day care, Head Start, and grades K-12).
&& Incidence rates for 1993 compared with those for 1988.
================================================================================================
Return to top. Figure_5 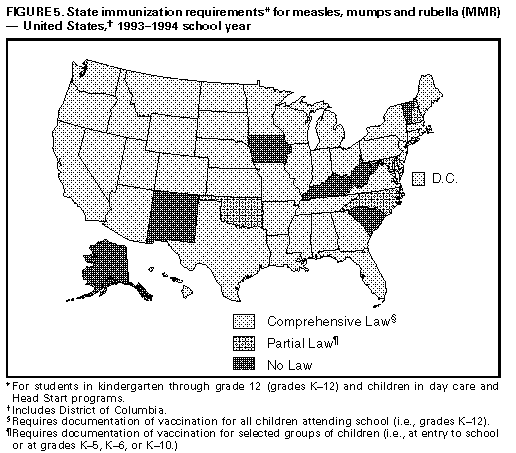 Return to top. Table_4 Note: To print large tables and graphs users may have to change their printer settings to landscape and use a small font size.
TABLE 4. Reported number of mumps cases and estimated incidence rates, * by state -- United States, 1988-1993
========================================================================================================================================
                            1988            1989            1990            1991            1992            1993         1993 compared
                        ------------    ------------    ------------    ------------    ------------    ------------       with 1988
State                     No.   Rate      No.   Rate      No.   Rate      No.   Rate      No.   Rate      No.   Rate      (% change)
--------------------------------------------------------------------------------------------------------------------------------------
Alabama                    16    0.4       29    0.7       19    0.5       15    0.4       14    0.3       22    0.5       (  37.5)
Alaska                     13    2.5        2    0.4        6    1.1       18    3.2        3    0.5       11    1.8       ( -15.4)
Arizona                   148    4.2      131    3.7      143    3.9      123    3.3       84    2.2       19    0.5       ( -87.2)
Arkansas                  180    7.5      208    8.6      140    6.0       46    1.9       16    0.7       10    0.4       ( -94.4)
California                494    1.7      541    1.9      571    1.9      500    1.6      311    1.0      285    0.9       ( -42.3)
Colorado                   33    1.0       86    2.6       28    0.9      136    4.0       34    1.0       18    0.5       ( -45.5)
Connecticut                10    0.3       11    0.3       17    0.5       14    0.4        8    0.2        8    0.2       ( -20.0)
Delaware                    1    0.2        1    0.1        8    1.2        7    1.0        8    1.2        1    0.1           0.0
District of
  Columbia                294   47.6      150   24.8       53    8.7       24    4.0        7    1.2        1    0.2       ( -99.7)
Florida                    43    0.3       65    0.5      197    1.5      500    3.8      288    2.1       48    0.4       (  11.6)
Georgia                    37    0.6       87    1.4       98    1.5       87    1.3       84    1.2       20    0.3       ( -45.9)
Hawaii                     18    1.6       20    1.8       26    2.3       30    2.6       28    2.4       30    2.6       (  66.7)
Idaho                      11    1.1       40    3.9      137   13.6       13    1.3        4    0.4        6    0.5       ( -45.5)
Illinois                  348    3.0      218    1.9      205    1.8      166    1.4      128    1.1       74    0.6       ( -78.7)
Indiana                    84    1.5       49    0.9       27    0.5        7    0.1       12    0.2        8    0.1       ( -90.5)
Iowa                       43    1.5       54    1.9       22    0.8       24    0.9       13    0.5       11    0.4       ( -74.4)
Kansas                    205    8.2      297   11.8       91    3.7       31    1.2        3    0.1        1    0.0       ( -99.5)
Kentucky                  185    5.0        9    0.2        0    0.0        0    0.0        4    0.1        0    0.0       (-100.0)
Louisiana                 365    8.3      783   17.9      118    2.8       37    0.9       35    0.8       20    0.5       ( -94.5)
Maine                       0    0.0        0    0.0        0    0.0        0    0.0        0    0.0        0    0.0           0.0
Maryland                  204    4.4      603   12.8    1,141   23.9      249    5.1       93    1.9       82    1.7       ( -59.8)
Massachusetts              17    0.3       57    1.0       14    0.2        3    0.1        3    0.1        1    0.0       ( -94.1)
Michigan                  236    2.6      161    1.7      177    1.9      121    1.3       85    0.9       80    0.8       ( -66.1)
Minnesota                   2    0.0        2    0.0       16    0.4       21    0.5       26    0.6        2    0.0           0.0
Mississippi                NN +   NA &     87    3.3       28    1.1       23    0.9       33    1.3       17    0.6            NA
Missouri                   68    1.3       87    1.7       62    1.2       40    0.8       39    0.8       46    0.9       ( -32.4)
Montana                     2    0.2        4    0.5        1    0.1        0    0.0        2    0.2        0    0.0       (-100.0)
Nebraska                   11    0.7        6    0.4        0    0.0        9    0.6        7    0.4        1    0.1       ( -90.9)
Nevada                     16    1.5        7    0.6       18    1.5       19    1.5       14    1.1       27    1.9       (  68.8)
New Hampshire             106    9.8       15    1.4       11    1.0        6    0.5        8    0.7        3    0.3       ( -97.2)
New Jersey                 57    0.7      214    2.8      104    1.3       43    0.6       18    0.2       17    0.2       ( -70.2)
New Mexico                 NN     NA       NN     NA       NN     NA       NN     NA       NN     NA       NN     NA            NA
New York
  (excluding NYC @)       110    1.0      176    1.7      161    1.5      111    1.0       88    0.8       46    0.4       ( -58.2)
  NYC                       0    0.0       22    0.3       65    0.9       14    0.2       12    0.2        2    0.0           0.0
N. Carolina                52    0.8       45    0.7      325    4.9      269    4.0      219    3.2      231    3.3       ( 344.2)
N. Dakota                   0    0.0        0    0.0        0    0.0        2    0.3        4    0.6        6    0.9           0.0
Ohio                      144    1.3      165    1.5       91    0.8      112    1.0      117    1.1       74    0.7       ( -48.6)
Oklahoma                  250    7.7      211    6.5      119    3.8       16    0.5       21    0.7       13    0.4       ( -94.8)
Oregon                     NN     NA       NN     NA       NN     NA       NN     NA       NN     NA       NN     NA            NA
Pennsylvania              128    1.1       88    0.7      144    1.2      132    1.1       87    0.7       70    0.6       ( -45.3)
Rhode Island               NN     NA        0    0.0       10    1.0        4    0.4        2    0.2        2    0.2            NA
S. Carolina                 9    0.3       56    1.6       76    2.2      402   11.3       52    1.4       17    0.5       (  88.9)
S. Dakota                   1    0.1        0    0.0        0    0.0        2    0.3        0    0.0        0    0.0       (-100.0)
Tennessee                 214    4.4       89    1.8       56    1.1      189    3.8       15    0.3       19    0.4       ( -91.1)
Texas                     327    1.9      551    3.2      470    2.8      363    2.1      388    2.2      231    1.3       ( -29.4)
Utah                        9    0.5       14    0.8       14    0.8       16    0.9       24    1.3        6    0.3       ( -33.3)
Vermont                     6    1.1        3    0.5        2    0.4        4    0.7        2    0.4        1    0.2       ( -83.3)
Virginia                  139    2.3      125    2.0      108    1.7       70    1.1       58    0.9       40    0.6       ( -71.2)
Washington                 44    0.9       59    1.2       66    1.4      178    3.5       18    0.4       14    0.3       ( -68.2)
W. Virginia                19    1.0       19    1.0       44    2.5       30    1.7       31    1.7       23    1.3       (  21.1)
Wisconsin                 160    3.3       57    1.2       60    1.2       33    0.7       21    0.4       23    0.5       ( -85.6)
Wyoming                     7    1.5        8    1.7        3    0.7        5    1.1        1    0.2        5    1.1       ( -28.6)

Total                   4,866    2.0    5,712    2.3    5,292    2.2    4,264    1.7    2,572    1.0    1,692    0.7       ( -65.2)
-------------------------------------------------------------------------------------------------------------------------------------
* Per 100,000 population.
+ Not notifiable.
& Not applicable.
@ New York City.
=======================================================================================================================================
Return to top. Disclaimer All MMWR HTML versions of articles are electronic conversions from ASCII text into HTML. This conversion may have resulted in character translation or format errors in the HTML version. Users should not rely on this HTML document, but are referred to the electronic PDF version and/or the original MMWR paper copy for the official text, figures, and tables. An original paper copy of this issue can be obtained from the Superintendent of Documents, U.S. Government Printing Office (GPO), Washington, DC 20402-9371; telephone: (202) 512-1800. Contact GPO for current prices. **Questions or messages regarding errors in formatting should be addressed to mmwrq@cdc.gov.Page converted: 09/19/98 |
|||||||||
This page last reviewed 5/2/01
|