Dentists
Dental treatment and preventive services are key to treating and preventing tooth decay, gum disease, and other oral diseases (1,2). The Health Resources and Services Administration notes that as of March 2024, nearly 60 million Americans live in areas designated as having a shortage of dental health professionals (3).
Key Findings

The number of professionally active dentists per 100,000 resident population in the United States was 59.73 in 2011 and 60.84 in 2021, an increase of 1.9%. See Featured Chart for additional analysis.
SOURCE: American Dental Association, Health Policy Institute. Supply of Dentists in the U.S.: 2001–2021. (Copyright 2022 American Dental Association. Reprinted with permission. All rights reserved.). See Sources and Definitions, American Dental Association (ADA) and Health, United States, 2022 Table DentSt.
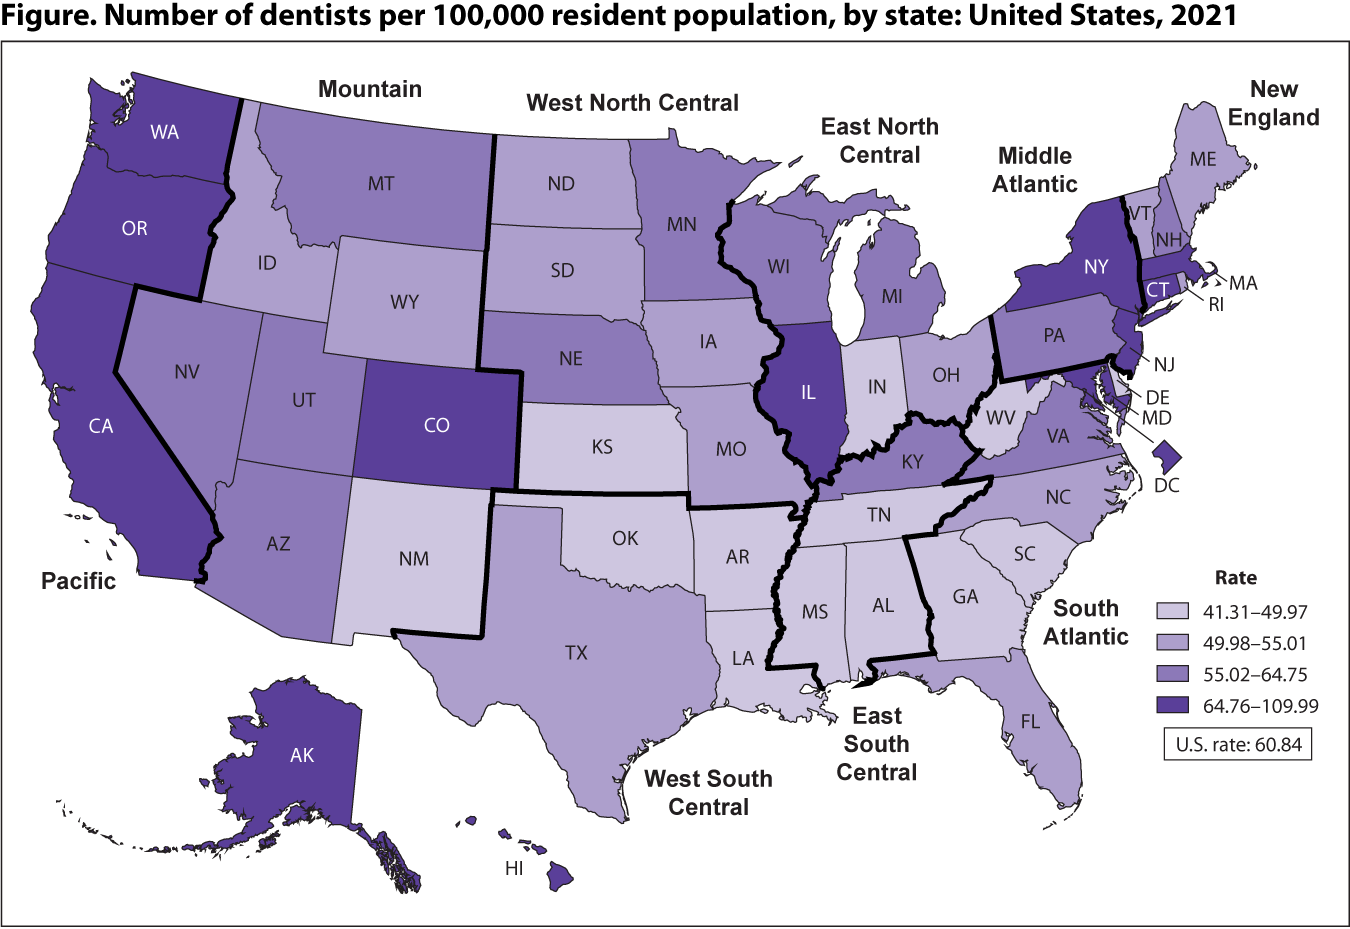
In 2021, the supply of professionally active dentists varied by state and census division.

NOTE: Quartiles contain equal numbers of observations presented as continuous categories.
SOURCE: American Dental Association, Health Policy Institute. Supply of Dentists in the U.S.: 2001– 2021. (Copyright 2022 American Dental Association. Reprinted with permission. All rights reserved.). See Sources and Definitions, American Dental Association (ADA) and Health, United States, 2022 Table DentSt.
- By state, the supply of dentists per 100,000 resident population in 2021 was lowest in Alabama (41.31), Arkansas (41.61), and Mississippi (43.36), and highest in District of Columbia (109.99), Massachusetts (81.99), and Alaska (80.25).
- In 2021, states in the East South Central and West South Central census divisions had the fewest active dentists per 100,000 resident population, while states in the Middle Atlantic and Pacific census divisions had the most.
Active dentists, by state: United States, 2001–2021
SOURCE: American Dental Association, Health Policy Institute.
- Dentists, professionally active: Data are presented for dentists in private practice; dental school (student, faculty, or staff member); armed forces or other federal services; state or local government; hospital; graduate school (student, intern, or resident); or other health or dental organization. Dentists who are not licensed or are retired are excluded. See Sources and Definitions, American Dental Association (ADA).
- Geographic division: For statistical purposes, the U.S. Census Bureau groups the 50 states and District of Columbia into nine divisions based on geographic proximity. For a list of divisions and their states, see Sources and Definitions, Geographic division or region.
- Centers for Disease Control and Prevention. About oral health.
- National Institute of Dental and Craniofacial Research. Oral health in America: Advances and challenges. 2021.
- Health Resources and Services Administration. Designated health professional shortage areas statistics: Second quarter of fiscal year 2024, designated HPSA quarterly summary. U.S. Department of Health and Human Services. 2024.


