2014 Ebola Outbreak in West Africa Epidemic Curves
The 2014-2016 Ebola outbreak in West Africa has ended. Visit the Ebola Outbreak section for information on current Ebola outbreaks.
On March 23, 2014, the World Health Organization (WHO) reported the first cases of EVD in West Africa in what would become the largest Ebola virus epidemic in history. Over two years, a total of 28,616 cases of EVD and 11,310 deaths were reported in Guinea, Liberia, and Sierra Leone. An additional 36 cases and 15 deaths occurred when the outbreak spread outside these three countries.
The following graphs demonstrate the incidence of newly suspected, probable, and confirmed cases over the duration of the epidemic in Guinea, Liberia, and Sierra Leone, the countries most impacted by the epidemic, both in the aggregate and separated by country.
The Frequency of New Cases in Guinea, Liberia, and Sierra Leone during the Ebola Outbreak from March 25, 2014 to April 13, 2016
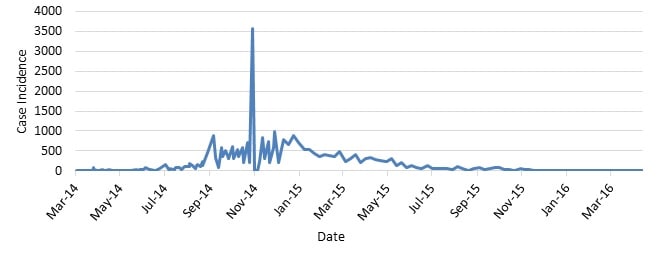
Graph 1: Case Incidence in Guinea, Liberia, and Sierra Leone.
This graph shows the frequency of newly reported cases in Guinea, Liberia, and Sierra Leone provided in WHO Situation Reports beginning on March 25, 2014, through the last situation report on June 10, 2016. The numbers are a total of suspected, probable, and confirmed cases.
| Date | Number of Cases per Month |
|---|---|
| 3/31/2014 | 120 |
| 4/30/2014 | 114 |
| 5/28/2014 | 75 |
| 6/24/2014 | 290 |
| 7/31/2014 | 723 |
| 8/28/2014 | 1730 |
| 9/26/2014 | 3501 |
| 10/31/2014 | 6987 |
| 11/28/2014 | 3559 |
| 12/31/2014 | 3272 |
| 1/28/2015 | 1886 |
| 2/25/2015 | 1637 |
| 3/31/2015 | 1484 |
| 4/29/2015 | 1120 |
| 5/31/2015 | 847 |
| 6/30/2015 | 395 |
| 7/31/2015 | 300 |
| 8/31/2015 | 225 |
| 9/29/2015 | 323 |
| 10/30/2015 | 159 |
| 11/30/2015 | 54 |
| 12/30/2015 | 0 |
| 1/27/2016 | 2 |
| 2/17/2016 | 0 |
| 3/30/2016 | 7 |
| 4/13/2016 | 6 |
The Frequency of New Cases in Guinea during the Ebola Outbreak from March 25, 2014 to April 13, 2016
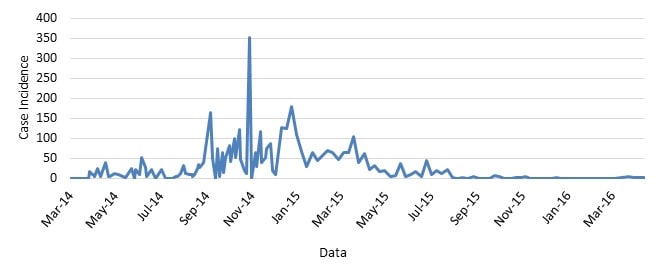
Graph 2: Case Incidence in Guinea.
This graph shows the frequency of newly reported cases in Guinea provided in WHO Situation Reports beginning on March 25, 2014, through the last situation report on June 10, 2016. The numbers are a total of suspected, probable, and confirmed cases.
| Date | Number of Cases per Month |
|---|---|
| 3/31/2014 | 112 |
| 4/30/2014 | 109 |
| 5/28/2014 | 60 |
| 6/24/2014 | 109 |
| 7/31/2014 | 70 |
| 8/28/2014 | 188 |
| 9/26/2014 | 426 |
| 10/31/2014 | 593 |
| 11/28/2014 | 488 |
| 12/31/2014 | 552 |
| 1/28/2015 | 210 |
| 2/25/2015 | 238 |
| 3/31/2015 | 337 |
| 4/29/2015 | 86 |
| 5/31/2015 | 74 |
| 6/30/2015 | 93 |
| 7/31/2015 | 36 |
| 8/31/2015 | 9 |
| 9/29/2015 | 15 |
| 10/30/2015 | 3 |
| 11/30/2015 | 0 |
| 12/30/2015 | 0 |
| 1/27/2016 | 0 |
| 2/17/2016 | 0 |
| 3/30/2016 | 7 |
| 4/13/2016 | 3 |
The Frequency of New Cases in Liberia during the Ebola Outbreak from March 25, 2016 to April 13, 2016

Graph 3: Case Incidence in Liberia.
This graph shows the frequency of newly reported cases in Liberia provided in WHO Situation Reports beginning on March 25, 2014, through the last situation report on June 10, 2016. The numbers are a total of suspected, probable, and confirmed cases.
| Date | Number of Cases per Month |
|---|---|
| 3/31/2014 | 8 |
| 4/30/2014 | 5 |
| 5/28/2014 | 0 |
| 6/24/2014 | 39 |
| 7/31/2014 | 278 |
| 8/28/2014 | 1049 |
| 9/26/2014 | 2080 |
| 10/31/2014 | 3077 |
| 11/28/2014 | 1100 |
| 12/31/2014 | 383 |
| 1/28/2015 | 604 |
| 2/25/2015 | 616 |
| 3/31/2015 | 474 |
| 4/29/2015 | 610 |
| 5/31/2015 | 344 |
| 6/30/2015 | 0 |
| 7/31/2015 | 6 |
| 8/31/2015 | 0 |
| 9/29/2015 | 0 |
| 10/30/2015 | 0 |
| 11/30/2015 | 3 |
| 12/30/2015 | 0 |
| 1/27/2016 | 0 |
| 2/17/2016 | 0 |
| 3/30/2016 | 0 |
| 4/13/2016 | 3 |
The Frequency of New Cases in Sierra Leone during the Ebola Outbreak from March 25, 2014 to April 13, 2016
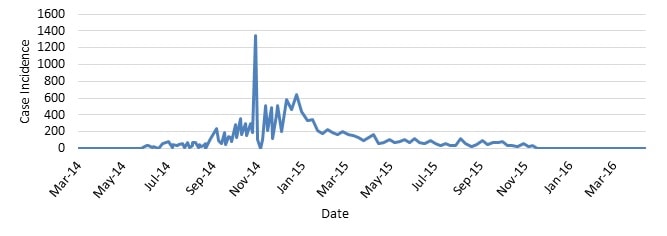
Graph 4: Case Incidence in Sierra Leone.
This graph shows the frequency of newly reported cases in Sierra Leone provided in WHO Situation Reports beginning on March 25, 2014, through the last situation report on June 10, 2016. The numbers are a total of suspected, probable, and confirmed cases.
| Date | Number of Cases per Month |
|---|---|
| 3/31/2014 | 0 |
| 4/30/2014 | 0 |
| 5/28/2014 | 16 |
| 6/24/2014 | 142 |
| 7/31/2014 | 375 |
| 8/28/2014 | 493 |
| 9/26/2014 | 995 |
| 10/31/2014 | 3317 |
| 11/28/2014 | 1771 |
| 12/31/2014 | 2337 |
| 1/28/2015 | 1072 |
| 2/25/2015 | 783 |
| 3/31/2015 | 673 |
| 4/29/2015 | 424 |
| 5/31/2015 | 429 |
| 6/30/2015 | 302 |
| 7/31/2015 | 258 |
| 8/31/2015 | 216 |
| 9/29/2015 | 308 |
| 10/30/2015 | 156 |
| 11/30/2015 | 55 |
| 12/30/2015 | 0 |
| 1/27/2016 | 2 |
| 2/17/2016 | 0 |
| 3/30/2016 | 0 |
| 4/13/2016 | 0 |
The dramatic variation in number of cases reported from the end of October to the beginning of November 2014 is due to a change in the data sources used. Prior to October 2014, the cumulative total numbers were derived from a combination of patient databases and country situation reports. Later, the revised approach used numbers compiled by the Ministries of Health and WHO country offices.