This Quick Learn lesson will take approximately 10 minutes to complete.
When you are finished, you will be able to create an epidemic curve, or “epi curve.”
You can move through this lesson by using the NEXT and BACK icons below.
What is an Epi Curve?
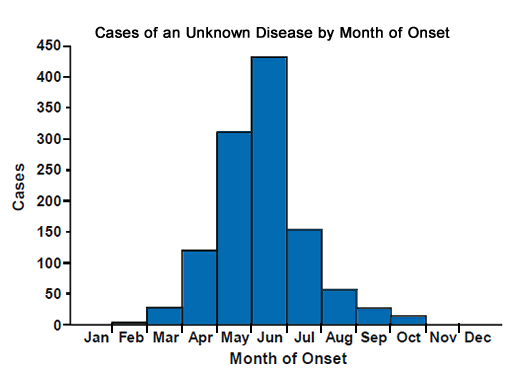
An epi curve is a visual display of the onset of illness among cases associated with an outbreak.
You can learn a lot about an outbreak from an epi curve, such as
- The outbreak's time trend, that is, the distribution of cases over time
- Outliers, that is, cases that stand apart from the overall pattern
- General sense of the outbreak's magnitude
- Inferences about the outbreak's pattern of spread
- The most likely time period of exposure
X and Y Axes
An epi curve is represented by a graph with two axes that intersect at right angles.
The horizontal x-axis is the date or time of illness onset among cases.
The vertical y-axis is the number of cases.
Each axis is divided into equally spaced intervals, although the intervals for the two axes may differ.
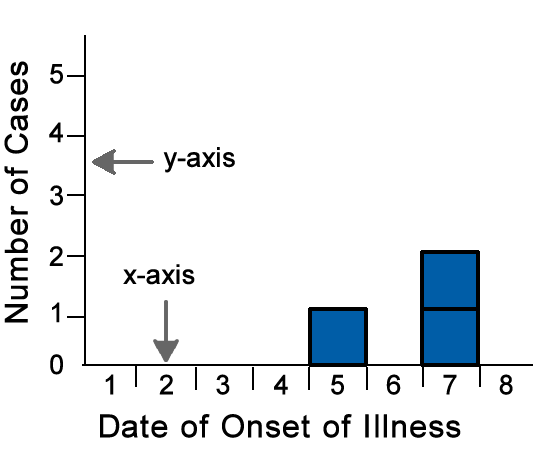
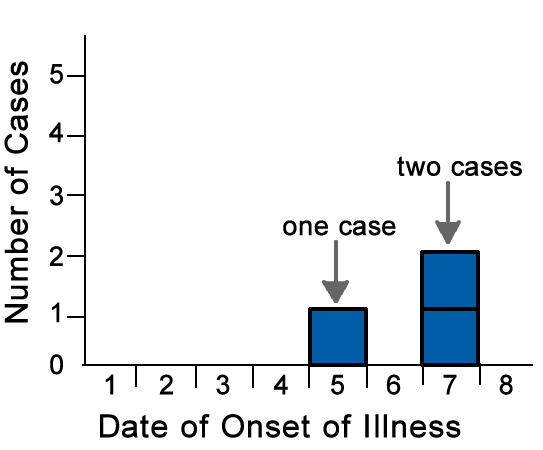
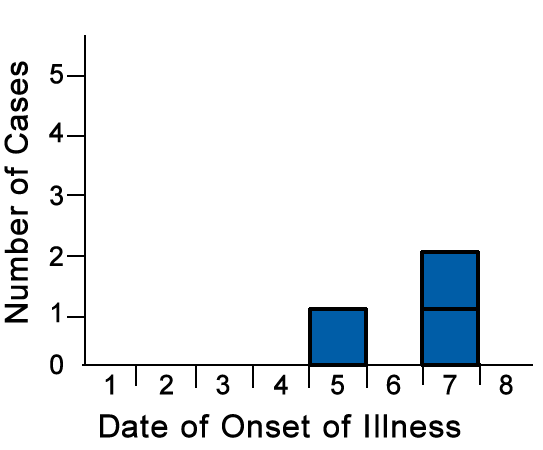
Cases
Cases (represented by boxes) are placed along the x-axis according to the date when their earliest symptoms began.
If symptoms for more than one case began on the same date (or time), the boxes are stacked one above the other.
Time Intervals
The unit of time for the x-axis is based on the incubation period of the disease under investigation and the length of time over which cases are distributed.
As a general rule, the unit of time is set at roughly 1/4 (0.25) of the average incubation period for the illness under investigation.
Average incubation period
multiplied by .25 = Intervals
Time Intervals, continued
If the incubation period of an illness is short, the interval on the epi curve might be indicated in hours or even minutes.
View the example below
The incubation period for infection with E. coli O1257:H7 is usually 3–4 days. In this case, you would probably use an interval of one day on the x-axis.
4 days multiplied by 0.25 = 1 day
intervals (4 x 0.25 = 1)
Determining a Title
An epi curve should have a title that describes it, including the type of illness, the place where the outbreak occurred, and the time period.
Cases of [insert illness name] by date of onset, [insert location and time period]
View the example below.
Cases of E. coli O157:H7 by Date of Onset, Epps, Louisiana, February, 2012
Your Turn: Exercise 1
Seven cases of hepatitis A have been reported in Homer, Virginia. Construct the epi curve from the line list below.
Select the column heading that you would use to label the x-axis of the epi curve.
- 1
- 2
- 3
- 4
- 5
- 6
- 7
- 42
- 31
- 23
- 46
- 54
- 49
- 31
- M
- M
- M
- M
- M
- M
- M
- Dec 13
- Jan 5
- Jan 6
- Jan 8
- Jan 9
- Jan 10
- Jan 20
- Dec 26
- Jan 12
- Jan 8
- Jan 16
- Jan 12
- Jan 13
- Jan 20
Exercise 1: Incorrect
That is incorrect.
The correct answer is Date of Onset.
In an epi curve, the date of illness onset is on the x-axis.
The number of cases should go on the y-axis.
Exercise 1: Incorrect
That is incorrect.
The correct answer is Date of Onset.
In an epi curve, the date of illness onset is on the x-axis.
The number of cases should go on the y-axis.
Exercise 1: Incorrect
That is incorrect.
The correct answer is Date of Onset.
In an epi curve, the date of illness onset is on the x-axis.
The number of cases should go on the y-axis.
Exercise 1: Correct
That is correct.
The correct answer is Date of Onset.
In an epi curve, the date of illness onset is on the x-axis.
The number of cases should go on the y-axis.
Exercise 1: Incorrect
That is incorrect.
The correct answer is Date of Onset.
In an epi curve, the date of illness onset is on the x-axis.
The number of cases should go on the y-axis.
Your Turn: Exercise 2
Given that the average incubation period for hepatitis A is 28-30 days, what intervals would you use on the x-axis?
Exercise 2: Incorrect
Given the average incubation period for hepatitis A is 28-30 days, and the unit of time is roughly one-quarter the average incubation period, you would use an interval of 7 days on the x-axis.
28 X 0.25 = 7
Exercise 2: Correct
Given the average incubation period for hepatitis A is 28-30 days, and the unit of time is roughly one-quarter the average incubation period, you would use an interval of 7 days on the x-axis.
28 X 0.25 = 7
Exercise 2: Incorrect
Given the average incubation period for hepatitis A is 28-30 days, and the unit of time is roughly one-quarter the average incubation period, you would use an interval of 7 days on the x-axis.
28 X 0.25 = 7
Your Turn: Exercise 3
What is the appropriate title for the epi curve?

Exercise 3: Incorrect
The title should include both the name of the disease and the place where the outbreak occurred. The correct title is
Hepatitis A Cases by Date of Onset in Homer, Virginia, December 2011 - January 2012
Exercise 3: Incorrect
The title should include both the name of the disease and the place where the outbreak occurred. The correct title is
Hepatitis A Cases by Date of Onset in Homer, Virginia, December 2011 - January 2012
Exercise 3: Correct
The title should include both the name of the disease and the place where the outbreak occurred. The correct title is
Hepatitis A Cases by Date of Onset in Homer, Virginia, December 2011 - January 2012
Your Turn: Exercise 4
Using the following information from a line listing, which date from the Options below represents the Date of Onset for Case 1?
| Case | Age | Sex | Date of Onset | Date of Diagnosis |
|---|---|---|---|---|
| 1 | 42 | M | Dec 13 | Dec 26 |

Options
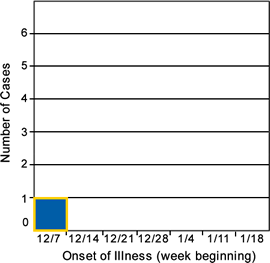
Exercise 4: Correct
| Case | Age | Sex | Date of Onset | Date of Diagnosis |
|---|---|---|---|---|
| 1 | 42 | M | Dec 13 | Dec 26 |
The date of onset is during the week of 12/7.
Exercise 4: Incorrect
| Case | Age | Sex | Date of Onset | Date of Diagnosis |
|---|---|---|---|---|
| 1 | 42 | M | Dec 13 | Dec 26 |
The date of onset is during the week of 12/7.
Exercise 4: Incorrect
| Case | Age | Sex | Date of Onset | Date of Diagnosis |
|---|---|---|---|---|
| 1 | 42 | M | Dec 13 | Dec 26 |
The date of onset is during the week of 12/7.
Exercise 4: Incorrect
| Case | Age | Sex | Date of Onset | Date of Diagnosis |
|---|---|---|---|---|
| 1 | 42 | M | Dec 13 | Dec 26 |
The date of onset is during the week of 12/7.
Exercise 4: Incorrect
| Case | Age | Sex | Date of Onset | Date of Diagnosis |
|---|---|---|---|---|
| 1 | 42 | M | Dec 13 | Dec 26 |
The date of onset is during the week of 12/7.
Exercise 4: Incorrect
| Case | Age | Sex | Date of Onset | Date of Diagnosis |
|---|---|---|---|---|
| 1 | 42 | M | Dec 13 | Dec 26 |
The date of onset is during the week of 12/7.
Exercise 4: Incorrect
| Case | Age | Sex | Date of Onset | Date of Diagnosis |
|---|---|---|---|---|
| 1 | 42 | M | Dec 13 | Dec 26 |
The date of onset is during the week of 12/7.
Your Turn: Exercise 5
Using the following information from a line listing, which date from the Options below represents the Date of Onset for Case 5?
| Case | Age | Sex | Date of Onset | Date of Diagnosis |
|---|---|---|---|---|
| 5 | 54 | M | Jan 9 | Jan 12 |
Options
Exercise 5: Incorrect
Case 5 would be plotted on the week beginning 1/4.
| Case | Age | Sex | Date of Onset | Date of Diagnosis |
|---|---|---|---|---|
| 5 | 54 | M | Jan 9 | Jan 12 |
Exercise 5: Incorrect
Case 5 would be plotted on the week beginning 1/4.
| Case | Age | Sex | Date of Onset | Date of Diagnosis |
|---|---|---|---|---|
| 5 | 54 | M | Jan 9 | Jan 12 |
Exercise 5: Incorrect
Case 5 would be plotted on the week beginning 1/4.
| Case | Age | Sex | Date of Onset | Date of Diagnosis |
|---|---|---|---|---|
| 5 | 54 | M | Jan 9 | Jan 12 |
Exercise 5: Incorrect
Case 5 would be plotted on the week beginning 1/4.
| Case | Age | Sex | Date of Onset | Date of Diagnosis |
|---|---|---|---|---|
| 5 | 54 | M | Jan 9 | Jan 12 |
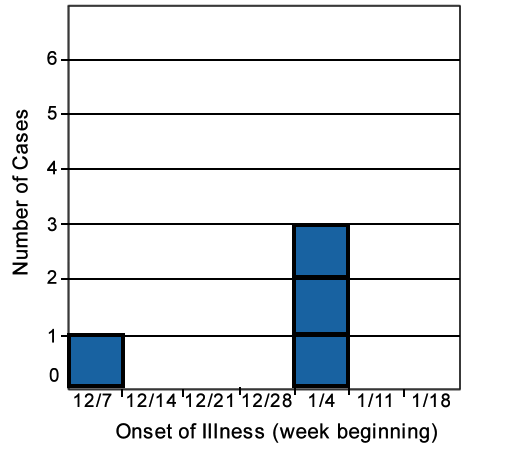
Exercise 5: Correct
Case 5 would be plotted on the week beginning 1/4.
| Case | Age | Sex | Date of Onset | Date of Diagnosis |
|---|---|---|---|---|
| 5 | 54 | M | Jan 9 | Jan 12 |
Exercise 5: Incorrect
Case 5 would be plotted on the week beginning 1/4.
| Case | Age | Sex | Date of Onset | Date of Diagnosis |
|---|---|---|---|---|
| 5 | 54 | M | Jan 9 | Jan 12 |
Exercise 5: Incorrect
Case 5 would be plotted on the week beginning 1/4.
| Case | Age | Sex | Date of Onset | Date of Diagnosis |
|---|---|---|---|---|
| 5 | 54 | M | Jan 9 | Jan 12 |
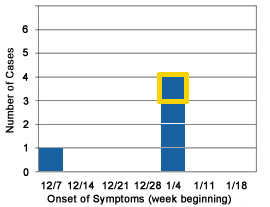
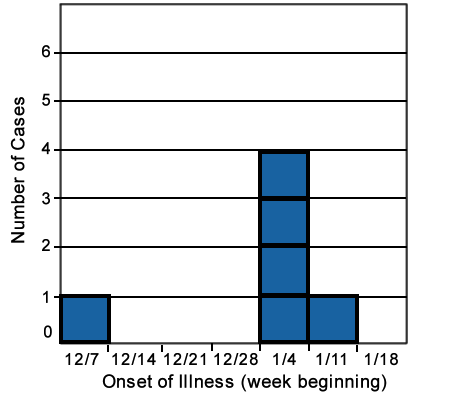
Summary
Congratulations!
You have created a basic epi curve. The completed epi curve is below.
Hepatitis A Cases by Date of Onset in Homer, Virginia,
December 2011–January 2012
To view other Quick Learns, visit CDC Learning Connection.