Model Performance Evaluation Program Report of Results: February 2020
MPEP February 2020 pdf icon[PDF – 824 KB]
The purpose of this report is to present results of the U.S. Centers for Disease Control and Prevention (CDC) Model Performance Evaluation Program (MPEP) for Mycobacterium tuberculosis complex (MTBC) drug susceptibility testing survey sent to participants in August 2019.
Primary Classification
This report contains DST results submitted to CDC by survey participants at 70 laboratories in 35 states.
The participants were asked to indicate the primary classification of their laboratory (Figure 1). MPEP participants self-classified as:
- 50 (72%): Health department laboratory (e.g., local, county, state)
- 10 (14%): Hospital laboratory
- 7 (10%): Independent/Reference laboratory (non-hospital based)
- 2 (3%): Federal government laboratory
- 1 (1%): Other (Medical Manufacturing Company)
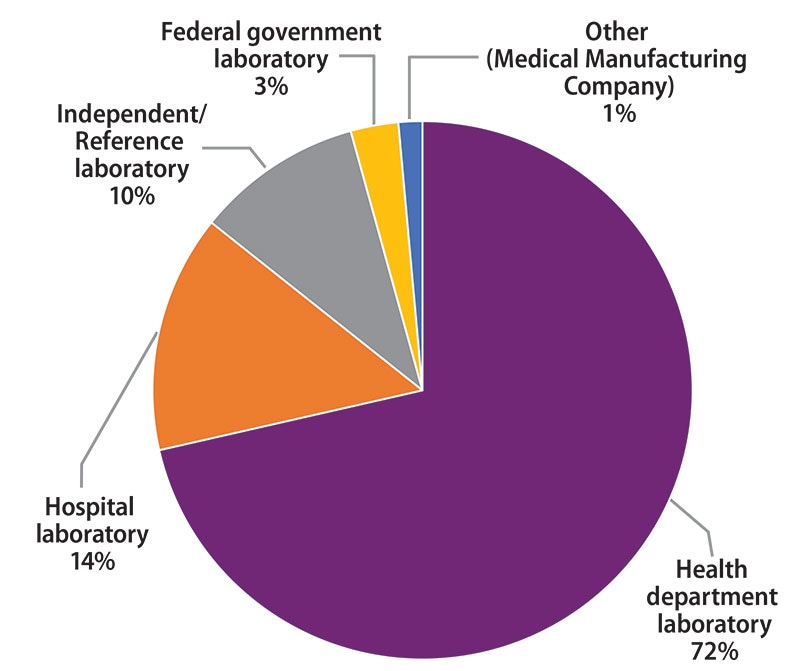
Figure 1. Primary Classification of Participating Laboratories, February 2020
Annual Number of MTBC Drug Susceptibility Tests Performed
The number of MTBC isolates tested for drug susceptibility by the 70 participants in 2019 (excluding isolates used for quality control) is shown in Figure 2. In 2019, the counts ranged from 0 to 1,039 tests. Participants at 28 (40%) laboratories reported testing 50 or fewer DST isolates per year. Laboratories with low MTBC DST volumes are encouraged to consider referral of testing because of concerns about maintaining proficiency [3].
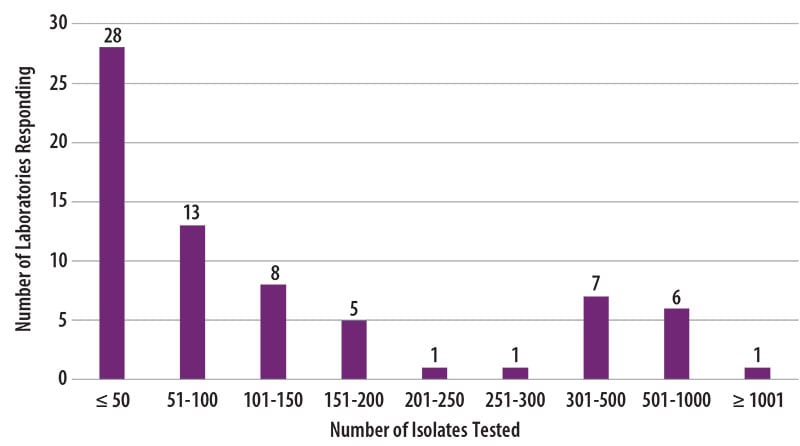
Figure 2. Distribution of the Annual Volume of MTBC Isolates Tested for Drug Susceptibility by Participants in Previous Calendar Year (n=70)
MTBC DST Methods Used by Participants
The DST methods that were used by participating laboratories for this panel of MTBC isolates are displayed in Figure 3. Furthermore, 42 (60%) laboratories reported results for only one method, 24 (34%) laboratories reported two methods, and 4 (6%) laboratories noted three susceptibility methods.
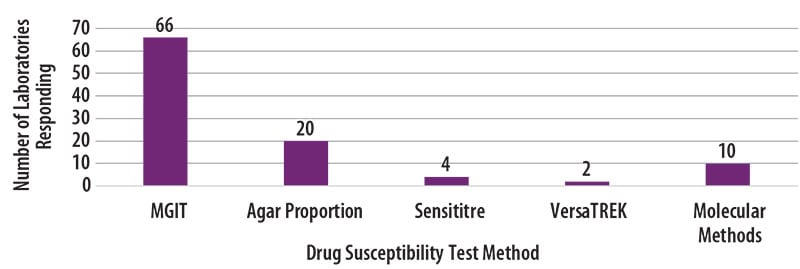
Figure 3. MTBC Drug Susceptibility Test Method Used by Participants (n=102)
Molecular methods reported by 10 participants are shown in Figure 4. The method used most frequently by laboratories (5) was targeted DNA sequencing (50%), including pyrosequencing and Sanger sequencing. Two (20%) laboratories reported use of line probe assays, Genotype MTBDRplus and MTBDRsl by Bruker, two (20%) reported results for the Cepheid Xpert MTB/RIF assay, and one (10%) reported results from whole genome sequencing.
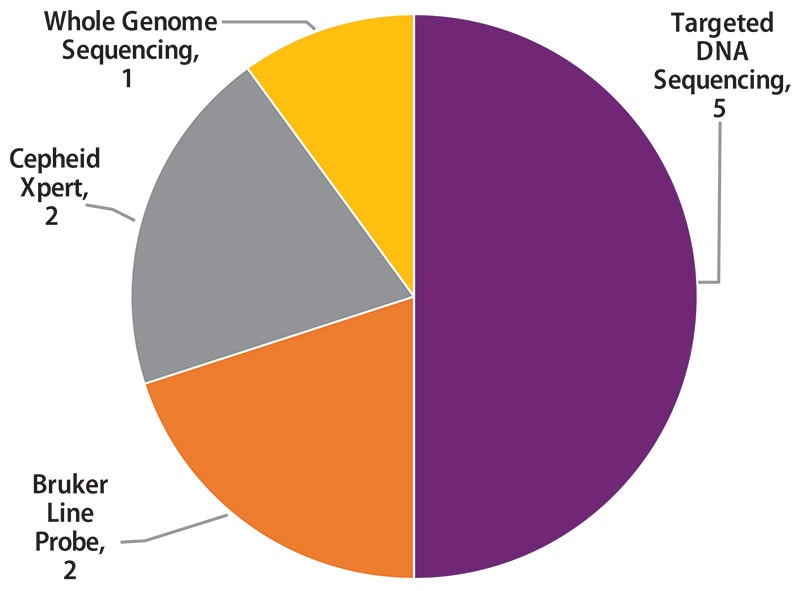
Figure 4. Molecular Method Reported (n=10)
Antituberculosis Drugs Tested by Participants
The number of participating laboratories that reported testing each antituberculosis drug in the February 2020 survey is presented in Figure 5. CLSI recommends testing a full panel of first-line drugs (rifampin [RMP], isoniazid [INH], ethambutol [EMB] and pyrazinamide [PZA])[1] because it represents a combination of tests that provides the clinician with comprehensive information related to the four-drug antituberculosis therapy currently recommended for most patients. All participants reported results for three of the first-line drugs (RMP, INH and EMB) and 66 (94%) also reported results for PZA by growth-based DST methods.
For 24 laboratories reporting second-line drug results (with the exception of streptomycin), eight (33%) tested all three secondline injectable drugs and at least one fluoroquinolone needed to confidently define XDR TB. The second-line injectable drugs are amikacin, kanamycin and capreomycin. Fluoroquinolones include ofloxacin, ciprofloxacin, levofloxacin and moxifloxacin.
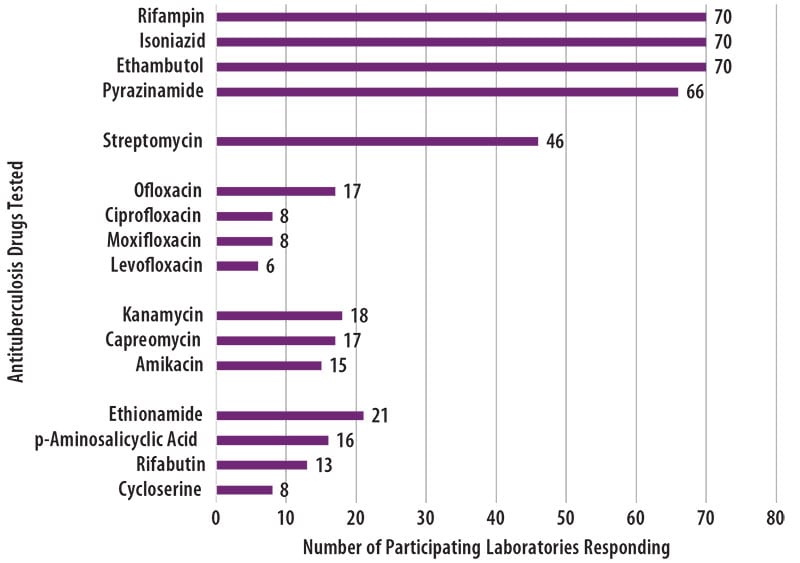
Figure 5. The antituberculosis drugs tested by MPEP participants is displayed in a horizontal bar graph.
Anticipated growth-based and molecular results for the panel of MTBC isolates sent to participants in February 2020 are shown in the tables below. Although CDC recommends broth-based methods for routine first-line DST of MTBC isolates, the results obtained by the reference agar proportion method (except for pyrazinamide, in which MGIT was performed) are shown in Table 1. Minimum inhibitory concentration testing result for rifampin was also considered for Isolate 2020E. Molecular results obtained by DNA sequencing are listed in Table 2 [2].
Table 1. Expected Growth-based Results for February 2020 Survey
Note—S=susceptible, R=resistant, V=variable
| Isolate | RMP | INH | EMB | PZA | Second-line Drugs Resistant to: |
| 2020A | R | S | S | S | STR |
| 2020B | S | R | R+ | S | |
| 2020C | S | S | S | S | |
| 2020D | R | S | S | S | |
| 2020E | V* | S | S | S |
* Isolate has mutation that may result in variable results by growth-based methods. 80% consensus for a single categorical result of either susceptible or resistant was not achieved for this isolate among participating laboratories.
+ Although EMB resistance was expected, >80% of participating laboratories reported susceptible. This may be due to the presence of a mutation with reported variable resistance in growth-based methods due to an MIC close to the critical concentration.
Table 2. Expected Molecular Results (Mutations Detected in Loci Associated with Resistance) for February 2020 Survey
Note—Empty cell=No mutation detected
| Isolate | rpoB* | katG | ahpC | embB | pncA |
| 2020A | Ser531Leu | ||||
| 2020B | Ser315Thr | G-88A | Met306Ile | ||
| 2020C | Leu511Val | ||||
| 2020D | Val146Phe+ | Thr135Ala | |||
| 2020E | Ser522Gln¥ |
* E.coli numbering system used
+May also be indicated as Val176Phe
¥ Mutation may result in variable results by growth-based methods
- CLSI, Susceptibility Testing of Mycobacteria, Nocardiae spp., and Other Aerobic Actinomycetes, in 3rd Ed. CLSI Standard M24. 2018, Clinical and Laboratory Standards Institute: Wayne, PA.
- Campbell, P.J., et al., Molecular detection of mutations associated with first- and second-line drug resistance compared with conventional drug susceptibility testing of Mycobacterium tuberculosis. Antimicrob Agents Chemother, 2011. 55(5): p. 2032-41.
- APHL, TB Drug Susceptibility Testing Expert Panel Meeting Summary Report. 2007, Association of Public Health Laboratories: Washington, D.C.
- Almeida Da Silva, P.E. and J.C. Palomino, Molecular basis and mechanisms of drug resistance in Mycobacterium tuberculosis: classical and new drugs. J Antimicrob Chemother, 2011. 66(7): p. 1417-30.
- Zhang, Y. and W.W. Yew, Mechanisms of drug resistance in Mycobacterium tuberculosis. Int J Tuberc Lung Dis, 2009. 13(11): p. 1320-30.
- Availability of an assay for detecting Mycobacterium tuberculosis, including rifampin-resistant strains, and considerations for its use – United States, 2013. MMWR Morb Mortal Wkly Rep, 2013. 62(41): p. 821-7.
- Van Deun, A., et al., Rifampin drug resistance tests for tuberculosis: challenging the gold standard. J Clin Microbiol, 2013. 51(8): p. 2633-40.
- Whitfield, M.G., et al., The potential use of rifabutin for treatment of patients diagnosed with rifampicin-resistant tuberculosis. J Antimicrob Chemother, 2018. 73(10): p. 2667-2674.
- Zhang, Y. and W.W. Yew, Mechanisms of drug resistance in Mycobacterium tuberculosis: update 2015. Int J Tuberc Lung Dis, 2015. 19(11): p. 1276-89.
- Centers for Disease Control and Prevention, Treatment of Tuberculosis, American Thoracic Society, CDC, and Infectious Diseases Society of America. 2003, MMWR. p. 4,11,19-20.
- Ramaswamy, S.V., et al., Single nucleotide polymorphisms in genes associated with isoniazid resistance in Mycobacterium tuberculosis. Antimicrob Agents Chemother, 2003. 47(4): p. 1241-50.
- Ando, H., et al., A silent mutation in mabA confers isoniazid resistance on Mycobacterium tuberculosis. Mol Microbiol, 2014. 91(3): p. 538-47.
- Starks, A.M., et al., Mutations at embB codon 306 are an important molecular indicator of ethambutol resistance in Mycobacterium tuberculosis. Antimicrob Agents Chemother, 2009. 53(3): p. 1061-6.
- Angra, P.K., et al., Performance of tuberculosis drug susceptibility testing in U.S. laboratories from 1994 to 2008. J Clin Microbiol, 2012. 50(4): p. 1233-9.
- Madison, B., et al., Multicenter evaluation of ethambutol susceptibility testing of mycobacterium tuberculosis by agar proportion and radiometric methods. J Clin Microbiol, 2002. 40(11): p. 3976-9.
- Siu, G.K., et al., Mutations outside the rifampicin resistance-determining region associated with rifampicin resistance in Mycobacterium tuberculosis. J Antimicrob Chemother, 2011. 66(4): p. 730-3.
- Whitfield, M.G., et al., Mycobacterium tuberculosis pncA Polymorphisms That Do Not Confer Pyrazinamide Resistance at a Breakpoint Concentration of 100 Micrograms per Milliliter in MGIT. Journal of clinical microbiology, 2015. 53(11): p. 3633-3635.
- Van Deun, A., et al., Mycobacterium tuberculosis strains with highly discordant rifampin susceptibility test results. J Clin Microbiol, 2009. 47(11): p. 3501-6.
- Rigouts, L., et al., Rifampin resistance missed in automated liquid culture system for Mycobacterium tuberculosis isolates with specific rpoB mutations. J Clin Microbiol, 2013. 51(8): p. 2641-5.
- van Ingen, J., et al., Low-level rifampicin-resistant Mycobacterium tuberculosis strains raise a new therapeutic challenge. Int J Tuberc Lung Dis, 2011. 15(7): p. 990-2.
- Ho, J., P. Jelfs, and V. Sintchencko, Phenotypically occult multidrug-resistant Mycobacterium tuberculosis: dilemmas in diagnosis and treatment. J Antimicrob Chemother, 2013. 68(12): p. 2915-20.
- Jeong, D.H., et al., Successful Treatment with a High-dose Rifampin-containing Regimen for Pulmonary Tuberculosis with a Disputed rpoB Mutation. Intern Med, 2018. 57(22): p. 3281-3284.
- Shah, N.S., et al., Clinical Impact on Tuberculosis Treatment Outcomes of Discordance Between Molecular and Growth-Based Assays for Rifampin Resistance, California 2003-2013. Open Forum Infect Dis, 2016. 3(3): p. ofw150.