Skip directly to the search box, site navigation, or content.
NOTICE: The information on this page is no longer being updated and may have changed. The information is accurate only as of the last page update.
Infections with the Outbreak Strain of Salmonella Saintpaul
By Date of Illness Onset by State (n=234*)
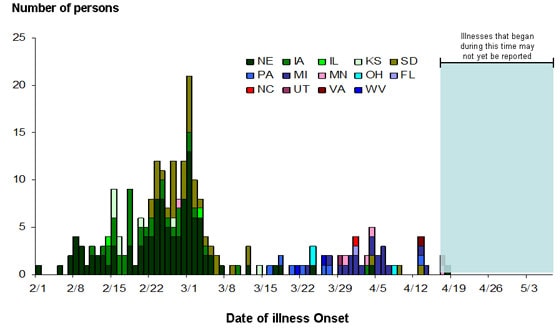
The outbreak can be visually described with a chart showing the number of persons who became ill each day. This chart is called an epidemic curve or epi curve. It shows that illnesses began in early February, peaked in early March and have been tapering off in April. Illnesses that occurred after April 17, 2009 may not yet be reported due to the time it takes between when a person becomes ill and when the illness is reported. This takes an average of 2 to 3 weeks. Please see the Salmonella Outbreak Investigations: Timeline for Reporting Cases for more details
* For whom information was reported as of May 7, 2009. One case-patient without an onset date was excluded.
NOTICE: The information on this page is no longer being updated and may have changed. The information is accurate only as of the last page update.
Content Source: Centers for Disease Control and Prevention
National Center for Emerging and Zoonotic Infectious Diseases (NCEZID)
Division of Foodborne, Waterborne, and Environmental Diseases (DFWED)
Quick Links
Contact CDC
Error processing SSI file
s.pageName=document.title s.channel="Salmonella" s.hier1="NCEZID~DFWED~Salmonella~Saintpaul" s.prop22="NCEZID" s.prop23="DFWED" s.prop24="Salmonella" s.prop25="Saintpaul" Error processing SSI file