Skip directly to the search box, site navigation, or content.
NOTICE: The information on this page is no longer being updated and may have changed. The information is accurate only as of the last page update.
Investigation Update: Multistate Outbreak of Human Salmonella Newport Infections Linked to Raw Alfalfa Sprouts
n=35 for whom information was reported as of 06/02/10 at 11:00 pm EDT*
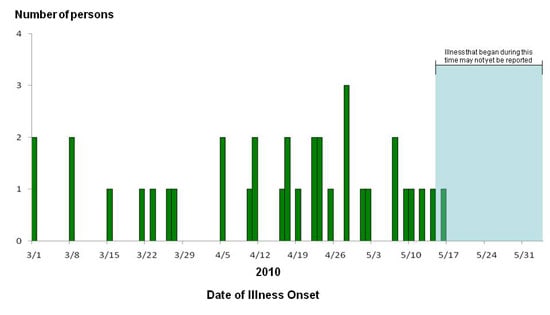
* Some illness onset dates have been estimated from other reported information.
The outbreak can be visually described with a chart showing the number of people who became ill each day. This chart is called an epidemic curve or epi curve. Illnesses that occurred after May 16, 2010, might not yet be reported due to the time it takes between when a person becomes ill and when the illness is reported. This takes an average of 2 to 3 weeks. For more details, please see the Salmonella Outbreak Investigations: Timeline for Reporting Cases.
NOTICE: The information on this page is no longer being updated and may have changed. The information is accurate only as of the last page update.
Content Source: Centers for Disease Control and Prevention
National Center for Emerging and Zoonotic Infectious Diseases (NCEZID)
Division of Foodborne, Waterborne, and Environmental Diseases (DFWED)