The Effect of a Park-Based Physical Activity Program on Cardiovascular, Strength, and Mobility Outcomes Among a Sample of Racially/Ethnically Diverse Adults Aged 55 or Older
ORIGINAL RESEARCH — Volume 15 — December 27, 2018
Hannah E. Kling, MPH1; Emily M. D’Agostino, DrPH1; Ja’mese V. Booth, MS1; Hersila Patel, MPH1; Eric Hansen, MS1; M. Sunil Mathew, MS2; Sarah E. Messiah, PhD, MPH2,3 (View author affiliations)
Suggested citation for this article: Kling HE, D’Agostino EM, Booth JV, Patel H, Hansen E, Mathew MS, et al. The Effect of a Park-Based Physical Activity Program on Cardiovascular, Strength, and Mobility Outcomes Among a Sample of Racially/Ethnically Diverse Adults Aged 55 or Older. Prev Chronic Dis 2018;15:180326. DOI: http://dx.doi.org/10.5888/pcd15.180326external icon.
PEER REVIEWED
Abstract
Introduction
Many older adults are not physically active despite the well-documented health benefits of regular exercise. We examined cardiovascular, strength, and mobility outcomes among a sample of racially/ethnically diverse adults aged 55 or older participating in a community park-based physical activity program.
Methods
We assessed the following among adults aged 55 or older who attended a 1-hour park-based fitness class 2 or 3 times per week for 21 weeks: 1) 3 fitness outcomes, 2) systolic and diastolic blood pressure, 3) height and weight (to assess body mass index), and 4) pulse. We collected data at baseline (August–September 2016) and follow-up (January–February 2017). Linear regression analysis, adjusting for sex, age, and race/ethnicity, examined the association between program participation and changes in outcomes.
Results
Adjusted models showed a mean decrease in systolic blood pressure (−3.80 mm Hg; 95% CI, −6.75 to −0.84 mm Hg) and diastolic blood pressure (−1.54 mm Hg; 95% CI, −3.01 to −0.06 mm Hg) and a mean increase in number of arm curls completed in 30 seconds (1.66; 95% CI, 0.71–2.61) from baseline to follow-up among all participants. Hispanic participants, compared with non-Hispanic white and non-Hispanic black participants, showed greater improvements in mean body mass index (−2.48; 95% CI, −4.60 to −0.34), systolic blood pressure (8.59 mm Hg; 95% CI, −16.82 to −0.36 mm Hg), diastolic blood pressure (−7.06 mm Hg; 95% CI, −11.16 to −2.97 mm Hg), and pulse (−6.53 beats per minute; 95% CI, −11.38 to −1.67 beats per minute).
Conclusion
Park-based fitness classes tailored to older, racially/ethnically diverse adults can improve cardiovascular health and strength.
Introduction
One in 4 Americans have multiple chronic conditions such as heart disease, stroke, cancer, type 2 diabetes, obesity, and arthritis (1–3) Americans aged 65 or older have more chronic conditions than their younger-age counterparts: 3 of 4 have multiple chronic conditions (1,4). Among adults aged 65 or older, 91% have at least 1 chronic condition and 73% have at least 2 chronic conditions (5). These conditions are associated with disability, decreased quality of life, and increased health care costs (6).
Racial/ethnic minority populations have a disproportionate burden of multiple chronic conditions (4). Older adults, racial/ethnic minorities, and low income populations are more likely to be sedentary or more likely to not follow recommended physical activity guidelines than the general population (7,8). For example, non-Hispanic white adults aged 65 or older in the United States report higher levels of physical activity than same-aged non-Hispanic black and Hispanic adults (8). The Hispanic and non-Hispanic black population in South Florida’s Miami-Dade County have a disproportionate burden of preventable chronic disease compared with the non-Hispanic white population living in that area (9,10).
Physical activity is a key strategy for preventing chronic disease (11). Physicians recommend physical activity to prevent and treat the development of functional decline related to aging and improve stamina and muscle strength in people with chronic disabling conditions (12). Physical activity also increases the ability to maintain and continue to live independently and reduces the risk of falling and fracturing bones (12–15). Older adults are recommended to do at least 150 minutes of moderate-intensity aerobic physical activity, at least 75 minutes of vigorous-intensity aerobic activity, or a combination of moderate and vigorous physical activity weekly. They are also recommended to engage in activities that strengthen major muscles 2 or more days per week and should perform balance-enhancing physical activity on 3 or more days per week (16).
Parks are ideal places to promote physical activity because they are typically free of charge and provide a safe environment for families and people of all ages (3). Parks are often present in neighborhoods and around homes and may be easily accessible to people in surrounding areas, making parks optimal settings to implement exercise programs. Evidence-based physical activity programs targeting older adults increase activity-related quality of life, and many community-based physical activity interventions have been proven to reduce disease incidence and to be cost effective (17,18). However, studies document that racial/ethnic minority groups tend to live in neighborhoods that lack proximity to safe and accessible recreation (19,20). Few studies have examined how park-based physical activity classes might affect the health of older adults. The objectives of our study were to examine cardiovascular, strength, and mobility outcomes among a sample of racially/ethnically diverse adults aged 55 or older before and after participation in 21 weeks of a community park–based physical activity program and to explain differences in fitness outcomes across racial/ethnic groups.
Methods
We conducted an observational, prospective cohort study with a noncontrolled pre–post design. This study was approved by the Sterling Institutional Review Board. We collected data at 2 points: at baseline in fall 2016 (late August and early September) and at follow-up in winter 2017 (late January and early February). Eligible participants were men and women aged 55 or older. The fitness classes were offered free of charge at 8 parks in various locations throughout Miami-Dade County and were advertised through media, fliers, and word of mouth.
Fitness classes
Participants enrolled by completing a program registration and demographic form on a rolling basis from May 2016 through September 2016 at 8 designated park facilities.
Fitness classes were adapted from the EnhanceFitness program, an evidence-based group exercise program that encourages increased activity, energy, and empowerment among older adults to “sustain independent lives” (21). Each class emphasized consistent body movement throughout a 1-hour period, 2 or 3 times per week. Miami-Dade County Department of Parks, Recreation and Open Spaces (MDPROS) recreation leaders were certified to conduct group fitness classes by the YMCA. They instructed each session in an open, multipurpose room inside recreation centers at each park. Five instructors were Hispanic and 4 were non-Hispanic black. Six instructors led the class in English, one led in Spanish, and one led in a mixture of English and Spanish. Each exercise class followed a similar schedule: 10 minute warm-up, 20 minutes of cardiovascular exercises (movement, steps, and/or dancing to music), 15 minutes of strengthening exercises, and 15 minutes of cool-down (stretching, balancing, and meditation). Participants were encouraged to hold 2-lb or 5-lb weights or wear ankle weights to increase exercise intensity. Water breaks were included.
Study measures
We collected baseline data before participants entered their first class and follow-up data at the end of the program. To maximize data collection, we encouraged participants to attend a make-up class if they missed their testing days. Health and wellness specialists employed by MDPROS collected data. They were trained to collect biometric and fitness data by University of Miami faculty members.
Demographic characteristics
We collected demographic data at enrollment only. Participants completed a demographic profile, which included questions on age, sex, and race/ethnicity.
Biometric measurements
We collected data on height and weight at baseline and follow-up and calculated body mass index (BMI) as weight in kilograms divided by height in meters squared (kg/m2). We measured height in meters by using a stadiometer (Seca 217 Mechanical Telescopic Model; Seca North America East Medical Scales & Measuring Devices) and weight in kilograms by using a calibrated digital scale (Seca Model 869; Seca North America East Medical Scales & Measuring Devices). Participants were asked to remove shoes, heavy clothes, and items from their pockets. Weight category was defined according to Centers for Disease Control and Prevention guidelines as normal weight (BMI <25.0), overweight (BMI 25.0–29.9), or obese (BMI ≥30.0) (22).
We used an automatic blood pressure machine (American Diagnostic Corporation e-sphyg 2 Automatic Sphygmomanometer, Model 9002) to measure heartbeats per minute, systolic blood pressure, and diastolic blood pressure at baseline and follow-up. We measured blood pressure 3 consecutive times for each patient, with a minute rest between measurements. The first measure was dropped, and the remaining 2 values were averaged for analysis to decrease the potential for white-coat hypertension (23). We used the appropriate cuff size for each participant.
Fitness tests
We used components of the standardized Functional Fitness Test, designed for adults aged 60 or older, to measure each participant’s strength and mobility at baseline and follow-up (24).
Arm curls. We assessed arm strength by timed arm curls. To perform the arm curl test, participants sat in a chair and held either a 5-lb dumbbell (women) or an 8-lb dumbbell (men) in the right hand or wrapped a 5-lb or 8-lb cuff weight around the right wrist. Participants were required to hang the right arm straight on the right side of the body, bend the right elbow, bringing the right hand up to the right shoulder while keeping the right elbow close to the body, and then return it down to the straight arm position. This full movement was considered 1 repetition. We recorded the total number of repetitions completed in 30 seconds.
Chair stands. We assessed leg strength by timed chair stands. Participants began by sitting in a chair with arms folded across the chest, placing hands on the shoulders. Participants were to stand up out of the chair and then return to the sitting position. The complete action was considered 1 repetition. We recorded the total number of repetitions completed in 30 seconds.
8-Foot up-and-go test. We assessed mobility by the 8-foot up-and-go test. Participants were to sit in a chair, stand up, walk around a cone set 8 feet in front of the chair and then return to the chair to sit. The goal was to perform this test as quickly as possible without running. The stopwatch began when participants were fully standing up out of the chair and stopped when participants sat back down into the chair. We recorded completion time in seconds.
Statistical analysis
We computed descriptive statistics to summarize characteristics across all participants at baseline and 21-week follow-up. We generated means and standard deviations (SDs) for all continuous data (age, BMI, systolic and diastolic blood pressure, heartbeats per minute, number of arm curls, number of chair stands, and 8-foot up-and-go test). We tabulated categorical data (sex, race/ethnicity) as frequency and percentage. We performed t tests to determine whether study outcomes differed significantly across racial/ethnic groups at baseline.
We used linear regression models to test the association between program participation and changes in cardiovascular and fitness outcomes from baseline to follow-up, adjusting for sex, age, and race/ethnicity. We converted data on race/ethnicity to binary variables (non-Hispanic white vs not; non-Hispanic black vs not; Hispanic vs not) for all regression models.
For any given week during the 21-week study, the average number of participants in classes throughout the 8 parks was 192 (Figure). A total of 117 participants consented to participate, provided demographic information, and participated in baseline data collection. Of these 117 participants, 106 participated in the 21-week follow-up data collection.
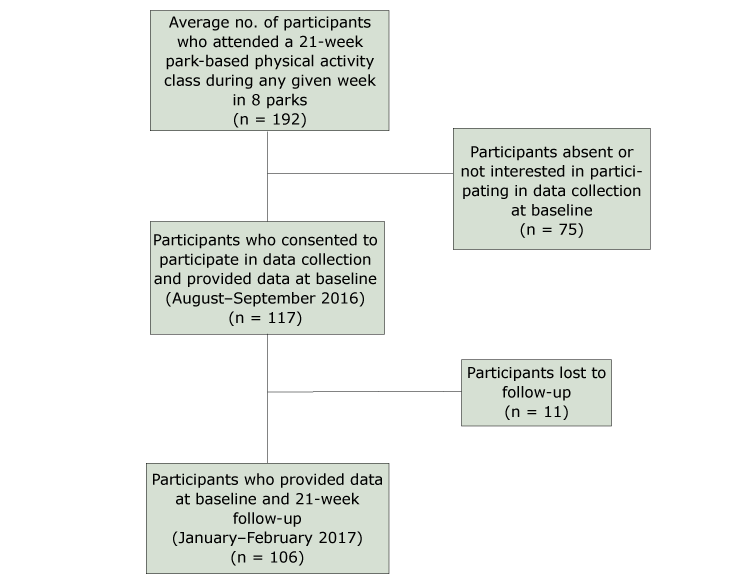
Figure.
Flow of participants enrolled and tested in a park-based physical activity class for adults aged 55 or older offered at 8 parks in Miami-Dade County, Florida, 2016–2017. [A text version of this figure is also available.]
We used an α of .05 to determine significance. A sample-size calculation showed that a minimum of 66 participants was needed to reach a power of 0.80 with an α set to .05. We calculated the power of our study sample size to be 0.95. We conducted all analyses in SAS version 9.3 (SAS Institute, Inc).
Results
Of the 106 participants, 95 (89.6%) were women, 54 (50.9%) were aged 70 or older (range, 57–89), 57 (53.8%) were Hispanic, and 30 (28.3%) were non-Hispanic black (Table 1).
BMI among all races/ethnicities combined did not change from baseline (29.6) to follow-up (28.7) The greatest mean decrease in BMI was among non-Hispanic black participants (from 31.4 to 29.1). Both systolic and diastolic blood pressure decreased among all races/ethnicities combined during the study period, from 138.0 mm Hg to 132.9 mm Hg (systolic) and from 74.4 mm Hg to 72.0 mm Hg (diastolic). Non-Hispanic white participants had the greatest decrease in systolic blood pressure (12.4 mm Hg), compared with non-Hispanic black participants (4.9 mm hg) and Hispanic participants (4.4 mm Hg). Non-Hispanic black and Hispanic participants had similar decreases in diastolic blood pressure (2.9 mm Hg and 2.8 mm Hg, respectively), whereas non-Hispanic white participants had no change.
The number of arm curls among all races/ethnicities combined increased from 25.2 curls to 25.9 arm curls during the study period. The number of arm curls increased among Hispanic participants by almost 2 repetitions and stayed the same for non-Hispanic black and non-Hispanic white participants. The number of chair stands stayed the same for all races/ethnicities. Non-Hispanic white and Hispanic participants improved in the 8-foot up-and-go test (by 1 second), whereas non-Hispanic black participants stayed about the same.
Crude estimates showed a significant mean decrease among all participants in systolic blood pressure from baseline to follow-up (−3.65 mm Hg; 95% CI, −6.64 to −0.66 mm Hg; P = .02) and a significant increase in the number of arm curls (1.63; 95% CI, 0.68–2.59; P < .001) (Table 2).
After adjusting for age, race/ethnicity, and sex, regression models showed a mean decrease for all participants in systolic blood pressure (−3.80 mm Hg; 95% CI, −6.75 to −0.84 mm Hg, P < .001), diastolic blood pressure (−1.54 mm Hg; 95% CI, −3.01 to −0.06 mm Hg; P = .04), and number of arm curls completed in 30 seconds (1.66; 95% CI, 0.71–2.61) (Table 3). Hispanic participants showed the greatest decrease in BMI (−2.48; 95% CI, −4.60 to −0.34; P = .02), systolic blood pressure (−8.59 mm Hg; 95% CI, −16.82 to −0.36 mm Hg; P = .04), diastolic blood pressure (−7.06 mm Hg; 95% CI, −11.16 to −2.97 mm Hg; P < .001) and pulse (−6.53 beats per minute; 95% CI, −11.38 to −1.67 beats per minute; P = .009), compared with non-Hispanic black and non-Hispanic white participants (Table 3). As participant age increased, systolic blood pressure increased (0.72 mm Hg; 95% CI, 0.38–1.06 mm Hg; P < .001), the number of arm curls (−0.18; 95% CI, −0.29 to −0.07; P = .002) and chair stands (−0.08; 95% CI, −0.15 to −0.02; P = .01) decreased, and the number of seconds to complete the 8-foot up-and-go test increased (0.18 seconds; 95% CI, 0.13–0.24 seconds; P < .001) (Table 3). Women had a slight increase in diastolic blood pressure (5.96 mm Hg; 95% CI, 2.48–9.44 mm Hg; P < .001) from baseline to follow-up.
Discussion
This study examined the cardiovascular health and fitness effects of participation in a 21-week park-based physical activity program among adults aged 55 or older. Compared with non-Hispanic white and non-Hispanic black participants, Hispanic participants had the largest decreases in mean BMI, systolic blood pressure, diastolic blood pressure, and pulse, although each race/ethnicity showed decreases in systolic blood pressure, diastolic blood pressure, and pulse and increases in arm strength during the study period. Also, non-Hispanic black participants showed a mean decrease in BMI that moved them from the obese (mean BMI, 31.4) to the overweight (mean BMI, 29.1) category after completing the 21-week program. Although not a significant decrease, this improvement is important because obesity-related death rates (ie, deaths caused by such conditions as heart disease and stroke), are higher for the non-Hispanic black population than for the non-Hispanic white population.
The older adult population in Miami-Dade County is majority Hispanic. The Hispanic population in the United States performs less physical activity than the non-Hispanic white population, and the Hispanic population in Miami-Dade County has a disproportionately greater burden of cardiovascular disease and high blood pressure than the non-Hispanic white population (8,9). Our study showed that Hispanic participants had significantly greater improvements in blood pressure and pulse than non-Hispanic white and non-Hispanic black participants after the 21-week program.
Our study also showed that as age increased, arm strength and mobility significantly decreased and systolic blood pressure significantly increased. The decrease in arm strength and mobility may be explained by the gradual decline in the ability to add muscle mass as people age. In addition, blood pressure typically increases with age as cardiovascular fitness becomes more of a challenge. As such, regular exercise is particularly important to older adults because consistent physical activity can help slow muscle loss and the overall decline of cardiovascular health.
Older adults have higher rates of chronic diseases than younger adults and do not reach their recommended physical activity levels, which when achieved, may help prevent the development of chronic diseases (1,4,7). Exercise classes may not be attractive to some older adults, particularly those with limited mobility, because of travel. Matching fitness-class levels to ability also may be difficult. Our study suggests that providing a safe, accessible, affordable, and appropriate park-based physical activity programs to older adults can help to improve cardiovascular and fitness outcomes in this population.
Walking proximity to parks promotes physical activity and improves other health outcomes, but research on park-based exercise classes is limited (25). A survey of visitors at a large city park found that adults who did not self-identify as non-Hispanic white visited parks more frequently than adults who self-identified as older non-Hispanic white and that adults who visited parks met their national physical activity recommendations for daily exercise. Increasing the availability and accessibility of community parks might positively affect physical activity levels among racial/ethnic minority groups and promote park usage among older adults (26). Racial/ethnic minority neighborhoods are significantly less likely than white neighborhoods to have access to recreational facilities and have lower-quality park resources (27). Furthermore, walkable green space positively influences life longevity among seniors (28). Attracting older adults to parks by offering tailored programs may encourage this population to take advantage of additional park amenities, thus increasing positive health effects.
Our study has several limitations. The study sample consisted primarily of racial/ethnic minority participants and women. Study findings may not be generalizable to other racial/ethnic populations and men. Also, the decrease in systolic blood pressure among non-Hispanic white participants was not significant, most likely because of the small number of non-Hispanic white participants in our sample.
The fitness classes offered may have varied slightly in the amount of time each class spent on cardiovascular exercises, strength exercises, and cool-down. Because class instructors and population fitness levels differed across sites, such variations were appropriate. During the cardiovascular portion of the class, some instructors encouraged the use of weights whereas some instructors preferred to use weights after cardiovascular exercises were completed. Every class at every park site did reach at least 20 minutes of cardiovascular exercises.
Another limitation is that the frequency of classes (2 or 3 times per week) varied across park sites, potentially affecting program effectiveness. However, group demographics were similar across park sites, so it is unlikely that trends across demographic factors systematically varied according to program frequency. In addition, causal inference is limited because we collected data from volunteer participants attending a park-based physical activity class and we did not include a control group. Furthermore, we did not collect information on family history of disease, current disease status, medication use, class enjoyment, motivation, stress, and likelihood to continue participating. This information would have permitted the inclusion of additional covariates in our analyses. Lastly, we did not account for participation in exercise classes outside of the park-based fitness classes.
Strengths of our study include the observation of racial/ethnic minority populations, who are often underrepresented in research studies. The study sample also captured data on Miami-Dade County’s primarily Hispanic and non-Hispanic black population, giving proper representation to the city’s racial/ethnic distribution. Our study observed exercise programs in different parks across a wide geographic area in South Florida. The MDPROS is the third largest county system in the United States, consisting of 270 parks and 13,573 acres of land. Our study investigated physical activity classes held in neighborhood parks, which are typically small parks in the middle of neighborhoods that cater to the local community, in contrast to regional parks, which are larger, host numerous events and programs, have natural attractions, or are dedicated to preserving land. The neighborhood park is a unique and particularly absent topic in public health literature.
Park-based fitness programs dedicated to older adults have the potential to promote cardiovascular health and fitness among this population, particularly among older Hispanic adults. Parks are community oriented, easily accessible, and can provide opportunities for community-based physical activity programming. Our study found that attending a park-based fitness class 2 or 3 times per week during a 21-week period was associated with improved cardiovascular health and fitness outcomes among older adults, including improvements in systolic blood pressure, diastolic blood pressure, and number of arm curls. Further research on different types of fitness classes offered in community parks to various racial/ethnic populations may encourage local entities to implement more physical activity–related programs to help decrease and prevent chronic diseases among older adults.
Acknowledgments
The authors have no financial, consultant, institutional, or other relationships that might lead to a bias or a conflict of interest in this article. The findings and conclusions are those of the authors and do not necessarily represent the views of the MDPROS or the University of Miami. No financial support or funding was received for this study. No copyrighted materials or surveys, instruments, or tools were adapted or used in this article or study.
Author Information
Corresponding Author: Sarah E. Messiah, PhD, MPH, Department of Pediatrics, University of Miami, Leonard M. Miller School of Medicine, Mailman Center for Child Development, Room 4011, 1580 NW 10th Ave, Miami, FL 33130. Telephone: 305-243-1943. Email: smessiah@med.miami.edu.
Author Affiliations: 1Miami-Dade County Department of Parks, Recreation and Open Spaces, Miami, Florida. 2Department of Pediatrics, University of Miami, Leonard M. Miller School of Medicine, Miami, Florida. 3Department of Public Health Sciences, University of Miami, Leonard M. Miller School of Medicine, Miami, Florida.
References
- Centers for Disease Control and Prevention. Multiple chronic conditions. https://www.cdc.gov/chronicdisease/about/multiple-chronic.htm. Updated January 20, 2016. Accessed May 31, 2018.
- Centers for Disease Control and Prevention. Chronic diseases: the leading causes of death and disability in the United States. https://www.cdc.gov/chronicdisease/overview/index.htm. Updated June 28, 2017. Accessed May 31, 2018.
- Joseph RP, Maddock JE. Observational park-based physical activity studies: a systematic review of the literature. Prev Med 2016;89:257–77. CrossRefexternal icon PubMedexternal icon
- Centers for Disease Control and Prevention. Hispanic health. https://www.cdc.gov/vitalsigns/hispanic-health/index.html. Updated May 2015. Accessed May 31, 2018.
- National Council on Aging. Chronic disease self-management fact sheet. 2012. https://www.aarp.org/livable-communities/learn/health-wellness/info-12-2012/ncoa-chronic-disease-selfmanagement-fact-sheet.html. Accessed July 1, 2018.
- Centers for Disease Control and Prevention. Healthy aging: improving and extending quality of life among older Americans. At a glance. https://www.google.com/url?sa=t&rct=j&q=&esrc=s&source=web&cd=1&ved=0ahUKEwix57K8l7PbAhWNwFMKHbMZDV8QFggpMAA&url=https%3A%2F%2Fstacks.cdc.gov%2Fview%2Fcdc%2F6842%2Fcdc_6842_DS1.pdf&usg=AOvVaw0UT2EnVLCtGEn94ujvBED9. Published 2009. Accessed June 1, 2018.
- Taylor WC, Baranowski T, Young DR. Physical activity interventions in low-income, ethnic minority, and populations with disability. Am J Prev Med 1998;15(4):334–43. CrossRefexternal icon PubMedexternal icon
- Keadle SK, McKinnon R, Graubard BI, Troiano RP. Prevalence and trends in physical activity among older adults in the United States: a comparison across three national surveys. Prev Med 2016;89:37–43. CrossRefexternal icon PubMedexternal icon
- Zevallos MD, Wilcox ML, Jean N, Acuña JM. Profile of the older population living in Miami-Dade County. Medicine 2016;95(20):e3630. CrossRefexternal icon PubMedexternal icon
- Statistical Atlas. Relative ethno-racial composition by age, graph number 3. 2015. https://statisticalatlas.com/place/Florida/Miami/Race-and-Ethnicity. Accessed July 1, 2018.
- Durstine JL, Gordon B, Wang Z, Luo X. Chronic disease and the link to physical activity. J Sport Health Sci 2013;2(1):3–11. CrossRefexternal icon
- Centers for Disease Control and Prevention. Older adults. Physical activity and health: a report of the Surgeon General. https://www.cdc.gov/nccdphp/sgr/pdf/sgrfull.pdf. Created 1999. Accessed June 1, 2018.
- Chodzko-Zajko WJ, Proctor DN, Fiatarone Singh MA, Minson CT, Nigg CR, Salem GJ, et al. American College of Sports Medicine position stand. Exercise and physical activity for older adults. Med Sci Sports Exerc 2009;41(7):1510–30. PubMedexternal icon
- Buford TW, Anton SD, Clark DJ, Higgins TJ, Cooke MB. Optimizing the benefits of exercise on physical function in older adults. PM R 2014;6(6):528–43. CrossRefexternal icon PubMedexternal icon
- Zubala A, MacGillivray S, Frost H, Kroll T, Skelton DA, Gavine A, et al. Promotion of physical activity interventions for community dwelling older adults: a systematic review of reviews. PLoS One 2017;12(7):e0180902. CrossRefexternal icon PubMedexternal icon
- World Health Organization. Recommended levels of physical activity for adults aged 65 and above. Physical activity and older adults. http://www.who.int/dietphysicalactivity/factsheet_olderadults/en/. Published 2017. Accessed July 1, 2018.
- Wilcox S, Dowda M, Griffin SF, Rheaume C, Ory MG, Leviton L, et al. Results of the first year of active for life: translation of 2 evidence-based physical activity programs for older adults into community settings. Am J Public Health 2006;96(7):1201–9. CrossRefexternal icon PubMedexternal icon
- Roux L, Pratt M, Tengs TO, Yore MM, Yanagawa TL, Van Den Bos J, et al. Cost effectiveness of community-based physical activity interventions. Am J Prev Med 2008;35(6):578–88. CrossRefexternal icon PubMedexternal icon
- Elgar FJ, Pförtner TK, Moor I, De Clercq B, Stevens GWJM, Currie C. Socioeconomic inequalities in adolescent health 2002–2010: a time-series analysis of 34 countries participating in the Health Behaviour in School-aged Children study. Lancet 2015;385(9982):2088–95. CrossRefexternal icon PubMedexternal icon
- World Health Organization. Social determinants of health and well-being among young people. Health Behaviour in School-aged Children (HBSC) study: international report from the 2009/2010 survey. http://www.euro.who.int/__data/assets/pdf_file/0003/163857/Social-determinants-of-health-and-well-being-among-young-people.pdf. Published 2012. Accessed July 1, 2018.
- ProjectEnhance. What is EnhanceFitness? http://www.projectenhance.org/enhancefitness.aspx. Published 2017. Accessed June 1, 2018.
- Centers for Disease Control and Prevention. About adult BMI. https://www.cdc.gov/healthyweight/assessing/bmi/adult_bmi/index.html. Updated August 29, 2017. Accessed May 31, 2018.
- Franklin SS, Thijs L, Asayama K, Li Y, Hansen TW, Boggia J, et al. The cardiovascular risk of white-coat hypertension. J Am Coll Cardiol 2016;68(19):2033–43. CrossRefexternal icon PubMedexternal icon
- Rikli RE, Jones CJ. Functional fitness normative scores for community-residing older adults, ages 60–94. J Aging Phys Act 1999;7(2):162–81. CrossRefexternal icon
- Mowen A, Orsega-Smith E, Payne L, Ainsworth B, Godbey G. The role of park proximity and social support in shaping park visitation, physical activity, and perceived health among older adults. J Phys Act Health 2007;4(2):167–79. CrossRefexternal icon PubMedexternal icon
- Reed JA, Price AE. Demographic characteristics and physical activity behavior of park-visitors versus non-visitors. J Community Health 2012;37(6):1264–8. CrossRefexternal icon PubMedexternal icon
- Moore LV, Diez Roux AV, Evenson KR, McGinn AP, Brines SJ. Availability of recreational resources in minority and low socioeconomic status areas. Am J Prev Med 2008;34(1):16–22. CrossRefexternal icon PubMedexternal icon
- Takano T, Nakamura K, Watanabe M. Urban residential environments and senior citizens’ longevity in megacity areas: the importance of walkable green spaces. J Epidemiol Community Health 2002;56(12):913–8. CrossRefexternal icon PubMedexternal icon
Tables
| Measurement | Non-Hispanic White (n = 10) | Non-Hispanic Black (n = 30) | Hispanic (n = 57) | All Races/Ethnicities (n = 106)a | ||||
|---|---|---|---|---|---|---|---|---|
| Baselineb | Follow-Up | Baselineb | Follow-Up | Baselineb | Follow-Up | Baselineb | Follow-Up | |
| BMIc | 27.7 (3.9) | 29.1 (4.6) | 31.4 (5.1) | 29.1 (5.7) | 29.0 (4.8) | 28.2 (5.0) | 29.6 (4.9) | 28.7 (5.2) |
| Systolic blood pressure, mm Hg | 137.1 (22.3) | 124.7 (19.4) | 140.2 (18.7) | 135.3 (21.4) | 136.4 (19.7) | 132.0 (17.3) | 138.0 (20.0) | 132.9 (18.7) |
| Diastolic blood pressure, mm Hg | 76.3 (12.2) | 76.0 (9.5) | 78.4 (12.2) | 75.5 (8.5) | 71.3 (8.9) | 68.5 (8.5) | 74.4 (10.6) | 72.0 (9.1) |
| Heartbeats per minute | 76.0 (13.0) | 73.1 (14.6) | 76.6 (14.3) | 76.1 (15.1) | 69.7 (9.6) | 70.8 (9.8) | 73.0 (11.9) | 73.0 (12.1) |
| No. of arm curls completed within 30 secondsd | 29.1 (7.3) | 28.7 (8.7) | 26.8 (6.7) | 26.2 (7.8) | 23.6 (7.4) | 25.4 (5.4) | 25.2 (7.2) | 25.9 (6.4) |
| No. of chair stands completed within 30 secondsd | 15.8 (3.4) | 15.2 (4.2) | 14.2 (3.6) | 14.6 (4.7) | 14.0 (3.0) | 14.2 (3.6) | 14.2 (3.2) | 14.3 (3.1) |
| 8-Foot up-and-go testd, seconds | 5.9 (2.0) | 4.8 (1.0) | 6.9 (2.4) | 7.0 (6.7) | 6.6 (2.2) | 6.5 (4.0) | 6.6 (2.2) | 6.5 (6.5) |
Abbreviation: BMI, body mass index.
a At baseline and follow-up, 9 (8.5%) were missing data on race/ethnicity, 95 (89.6%) were women, and 54 (50.9%) were aged ≥70.
b t tests showed no significant difference in fitness outcomes across the racial/ethnic groups at baseline (P > .05 for all) with the exception of 1) diastolic blood pressure (P = .01) and BMI P = .045) among non-Hispanic black participants, compared with each other racial/ethnic group and 2) diastolic blood pressure (P = .001), number of arm curls (P = .02), and number of chair stands (P = .003) among Hispanic participants, compared with each other racial/ethnic group.
c Defined as weight in kilograms divided by height in meters squared (22).
d Arm curl, chair stand, and 8-foot up-and-go tests followed guidelines of the Functional Fitness Test (24).
| Predictor Variable | Timea, βb (95% Confidence Interval) [P Value] |
|---|---|
| BMIc | −0.02 (−0.80 to 0.76) [.97] |
| Systolic blood pressure, mm Hg | −3.65 (−6.64 to −0.66) [.02] |
| Diastolic blood pressure, mm Hg | −1.38 (−2.94 to 0.17) [.08] |
| Heartbeats per minute | −0.31 (−2.09 to 1.48) [.74] |
| No. of arm curls completed within 30 secondsd | 1.63 (0.68 to 2.59) [<.001] |
| No. of chair stands completed within 30 secondsd | 0.49 (−0.07 to 1.06) [.09] |
| 8-Foot up-and-go testd, seconds | −0.29 (−0.78 to 0.19) [.24] |
Abbreviation: BMI, body mass index.
a Time defined as baseline to 21-week follow-up.
b Based on linear regression modeled estimates.
c Defined as weight in kilograms divided by height in meters squared (22).
d Arm curl, chair stand, and 8-foot up-and-go tests followed guidelines of the Functional Fitness Test (24).
| Predictor Variables | βa (95% CI) | ||||||
|---|---|---|---|---|---|---|---|
| BMIb | Systolic Blood Pressure, mm Hg | Diastolic Blood Pressure, mm Hg | Heartbeats Per Minute | No. of Arm Curlsc | No. of Chair Standsc | 8-Foot Up-and-Goc, Seconds | |
| Timed | −0.11 (−0.89 to 0.67) [.79] | −3.80 (−6.75 to −0.84) [.01] | −1.54 (−3.01 to −0.06) [.04] | −0.30 (−2.04 to 1.45) [.74] | 1.66 (0.71 to 2.61) [<.001] | 0.54 (−0.02 to 1.09) [.06] | −0.33 (−0.80 to 0.12) [.15] |
| Sex | 0.34 (−1.45 to 2.12) [.71] | 4.63 (−2.36 to 11.63) [.19] | 5.96 (2.48 to 9.44) [<.001] | −4.54 (−8.67 to −0.42) [.03] | 0.45 (−1.85 to 2.76) [.70] | −0.45 (−1.8 to 0.90) [.51] | 0.68 (−0.43 to 1.78) [.23] |
| Age | −0.05 (−0.18 to 0.04) [.25] | 0.72 (0.38 to 1.06) [<.001] | −0.06 (−0.23 to 0.11) [.52] | −0.05 (−0.25 to 0.15) [.60] | −0.18 (−0.29 to −0.07) [.002] | −0.08 (−0.15 to −0.02) [.01] | 0.18 (0.13 to 0.24) [<.001] |
| Race/ethnicity | |||||||
| Non-Hispanic white | −2.80 (−5.61 to 0.02) [.05] | −7.22 (−18.05 to 3.62) [.19] | −1.27 (−6.66 to 4.12) [.64] | −7.63 (5.15 to −1.37) [.70] | 2.79 (−0.71 to 6.30) [.12] | 0.88 (−1.16 to 2.91) [.40] | −0.90 (−2.60 to 0.80) [.30] |
| Non-Hispanic black | −0.71 (−3.03 to 1.61) [.55] | −0.74 (−9.41 to 7.93) [.87] | −0.87 (−5.18 to 3.45) [.69] | −1.37 (−6.48 to 3.74) [.60] | 0.21 (−2.58 to 3.00) [.88] | −0.63 (−2.24 to 0.99) [.45] | 1.08 (−0.27 to 2.44) [.12] |
| Hispanic | −2.48 (−4.60 to −0.34) [.02] | −8.59 (−16.82 to −0.36) [.04] | −7.06 (−11.16 to −2.97) [<.001] | −6.53 (−11.38 to −1.67) [.009] | 0.46 (−2.18 to 3.10) [.73] | 0.38 (−1.15 to 1.90) [.63] | −0.44 (−1.73 to 0.85) [.51] |
Abbreviation: BMI, body mass index; CI, confidence interval.
a Based on linear regression modeled estimates; adjusted models included sex, age (continuous variable), and race/ethnicity as potential confounders.
b Defined as weight in kilograms divided by height in meters squared (22).
c Arm curl, chair stand, and 8-foot up-and-go tests followed guidelines of the Functional Fitness Test (24).
d Time defined as baseline to 21-week follow-up.
The opinions expressed by authors contributing to this journal do not necessarily reflect the opinions of the U.S. Department of Health and Human Services, the Public Health Service, the Centers for Disease Control and Prevention, or the authors’ affiliated institutions.