Diabetes Quality of Care and Maintenance in New England: Can Cross-State Collaboration Move Us Forward?
ORIGINAL RESEARCH — Volume 15 — December 27, 2018
Dora M. Dumont, PhD, MPH1,2; Caitlin Pizzonia, MPH, CPH3,4; Stephanie Poulin, MPH, MT (ASCP)5; Paul Meddaugh, MS6 (View author affiliations)
Suggested citation for this article: Dumont DM, Pizzonia C, Poulin S, Meddaugh P. Diabetes Quality of Care and Maintenance in New England: Can Cross-State Collaboration Move Us Forward? Prev Chronic Dis 2018;15:180250. DOI: http://dx.doi.org/10.5888/pcd15.180250external icon.
PEER REVIEWED
Abstract
Introduction
State efforts to identify subpopulations at higher risk for inadequate diabetes maintenance are sometimes hampered by small sample size. We provide a model of a cross-state collaboration that might provide the foundation for identifying political and economic forces underlying inter- and intra-state variability in chronic disease care.
Methods
We collected Behavioral Risk Factor Surveillance System data directly from 5 of 6 New England states and ran multivariate logistic regressions on 5 exposures: race/ethnicity, federal poverty level (FPL) bracket, insurance status (yes or no), insurance type (public or private), and state of residence. Our sample consisted of adults aged 35 or older diagnosed with diabetes. Outcomes included whether respondents with diabetes received complete annual diabetes care (≥2 hemoglobin A1c tests, eye examination, foot examination), had ever taken a diabetes self-management class, or reported diabetes-related retinopathy.
Results
Half (50.4%) of our sample had incomplete annual diabetes care. In multivariate logistic regressions, race/ethnicity and FPL bracket were not major drivers of outcomes, although Hispanic/Latino adults had significantly higher risk than non-Hispanic white adults of not knowing how many hemoglobin A1c tests they had had in the past year or what such a test is (adjusted odds ratio = 2.74 [95% confidence interval, 1.15–6.56]) and of diabetes-related retinopathy (adjusted odds ratio = 3.13 [95% confidence interval, 1.61–6.10]). With few exceptions, higher FPL bracket, insurance status, insurance type, and state of residence were not associated with diabetes maintenance.
Conclusion
Inadequate annual diabetes care among adults with diagnosed diabetes was endemic even in this relatively advantaged US census division, and traditional disparities (eg, race/ethnicity, FPL bracket) only partially explained patterns in diabetes maintenance activities. Interstate analyses can create the foundation for active partnerships to identify and address the causes of lapses in care.
Introduction
Readers of this article in many parts of the country may pass street signs advertising offers to buy diabetes test strips (Figure 1), a clue that people with diabetes may turn to such transactions as a last resort when their diabetes maintenance needs exceed their insurance coverage or other economic resources. The magnitude of this gap between needs and resources is likely to grow, because the prevalence of diabetes in the United States is projected to triple by 2050 (1). Careful maintenance can control diabetes and reduce the risk of adverse outcomes such as retinopathy or neuropathy, but such control is challenging for both patients and the health care system.

Figure 1.
Sign advertising offers to buy diabetes test strips. Photo produced by author. [A text description of this figure is also available.]
Studies are inconsistent about the extent and causes of disparities in the quality of diabetes care and self-management, but they do show that long-standing racial/ethnic disparities in quality of care, patient engagement, and outcomes may be narrowing (2–6). Studies are largely consistent about the association between not having insurance and quality-of-care metrics (3,7,8), but they are less consistent about whether type of insurance matters (9,10). Some inconsistency among studies can be attributed to differences in study design and to differences in approaches to adjusting for socioeconomic status (SES) (10). Similarly, variability in studies that show continued disparities instead of narrowed racial/ethnic disparities may result from the use of national data instead of state or health system data (3,4).
Inconsistent patterns, however, may also reflect the limitations of traditional analytical frameworks. An analysis by region or census division, rather than a state or national analysis, allows an assessment of interstate variability in collections of states assumed to share common features. We combined data from 5 of 6 New England states to assess the “usual suspects” (race/ethnicity and SES) in disparities in diabetes quality of care and self-management and suggest ways to investigate other factors that may drive lapses in diabetes care.
Methods
We used data from the diabetes module of the 2015 Behavioral Risk Factor Surveillance System (BRFSS) data (2016 for Massachusetts) from 5 participating New England states (unweighted n = 42,127) (11–15). We excluded a sixth New England state, New Hampshire, which did not use the diabetes module in 2015 or 2016. Because some variables of interest, notably primary source of health insurance coverage, were derived from state-added questions and thus were not available from the Centers for Disease Control and Prevention, we obtained data sets directly from participating states. Because Massachusetts used the diabetes module only for a split sample (ie, divided into ≥2 versions of the questionnaire) and Maine used it for only 1 of 2 versions, we limited the analytical data set accordingly. We further limited analysis to adults aged 35 or older with diagnosed diabetes (unweighted n = 3,781) to improve comparability of educational attainment and income brackets. Younger adults are more likely to still be in the educational process, and diabetes diagnoses are still rare before age 35, despite recent increases in type 2 diabetes among younger adults.
We used multiple variables to determine adequacy of annual diabetes care. Clinical guidelines indicate that people with diabetes should receive annually at least 2 hemoglobin A1c (HbA1c) tests (an HbA1c test provides information on average glucose concentration during a 2–3-month period and is a staple of tracking diabetes control), an eye examination with dilation by a health care provider, and a foot examination by a health care provider (16). Respondents were asked how many HbA1c tests they had received in the past 12 months; we created a binary variable to identify those who received the recommended 2 tests and those who received fewer than 2 tests. More frequent HbA1c tests are recommended when diabetes is poorly controlled or when treatment regimens are changed; however, because BRFSS does not specify glycemic status, we set all respondents to the same minimum recommendation. Respondents were asked about the length of time since their last eye examination with dilation and about the last time a provider examined their feet for sores or irritation; for both, we created a binary variable to determine whether eyes and feet were examined in the past year in accordance with clinical guidelines. We then created a composite variable (“complete annual diabetes care”) to identify whether the respondent received all 3 recommended annual examinations in the past year.
In addition, we created a set of 4 variables to assess patient engagement in care. Respondents with diabetes were asked whether they had ever taken a course or class on diabetes self-management. We created a second measure, from the question on how many HbA1c tests respondents had received in the past year, to determine the number of respondents who did not know how many HbA1c tests they had had in the past year or did not know what an HbA1c test is. For the third measure, we used the question on how frequently people examined their feet for sores or irritations to create a binary variable for respondents who never examined their feet for sores or irritations. A fourth variable identified respondents who did not see a health care provider about their diabetes at all in the past year. Because daily foot self-examinations and daily glucose tests are not necessarily advised for all patients with diabetes, we did not include these measures in our analysis. Finally, poor diabetes control was assessed by the question “Has a doctor ever told you that diabetes has affected your eyes or that you have retinopathy?” For all outcomes, values identified as clinical or logical outliers (>24 HbA1c tests in past year, >60 foot examinations in past year, saw a provider for diabetes >24 times in the past year, or examined own feet >3 times daily) were removed from analysis along with missing observations; the maximum number removed for any outcome was 202.
The primary exposures of interest were race/ethnicity and SES. We categorized race/ethnicity as non-Hispanic black, Hispanic/Latino, non-Hispanic white, and all other race/ethnicities. “Other” categories were combined because of small numbers. We measured SES in 2 ways: educational attainment and percentage of federal poverty level (FPL). Educational attainment was categorized as less than high school diploma, high school diploma or GED, 1 to 3 years of college, and 4 or more years of college. We translated self-reported annual household income brackets into a percentage of FPL by using methodology made available by the CDC, household size, and year-specific FPL thresholds used to determine Affordable Care Act eligibility (17). We categorized percentage of FPL as less than 200% FPL, 200% to 399% FPL, 400% FPL or more. Because of large numbers of missing observations for income (202,307 of 912,945; 22.2%), we created an additional category, “income unknown,” to retain those respondents in the analysis and compare them with respondents with known income. Covariates were age (35–54 y, 55–64 y, ≥65 y), sex, whether the respondent was the sole adult in household, whether the respondent was covered by any type of health insurance (yes or no), and the respondent’s state of residence. We added 2 additional covariates to assess the possible contributions of individual health behaviors: current smoking status and engagement in leisure-time physical activity.
The final weighted sample represented 919,355 persons aged 35 or older with diagnosed diabetes. We conducted bivariate analyses to test for interstate variability in the prevalence of demographic characteristics and outcomes, and we performed multivariate logistic regressions with FPL bracket and educational attainment as primary exposures. We conducted a secondary analysis with primary source of health care coverage (private, Medicaid, Medicare, Veterans Administration or other, or none) as a primary exposure. Vermont was excluded from this secondary analysis because its data set did not include information on primary source of health care coverage. Massachusetts, which enacted its own health care reform in 2006, has data on an additional insurance option (Commonwealth Care); because this type of coverage is a public–private hybrid, we excluded these observations (n = 4) from analysis. We performed all analyses in SAS version 9.4 (SAS Institute Inc) by using survey weights provided by CDC to accommodate the BRFSS complex sampling methodology. To account for the split samples in Maine and Massachusetts, we created a new final weight variable from the individual state weight variables provided by CDC.
Results
Of the 919,355 persons aged 35 or older with diabetes represented by our sample, most (76.8%) were residents of Massachusetts (50.4% [463,488]) or Connecticut (26.4% [243,121]) (Table 1). Two demographic variables varied significantly among states: race/ethnicity and those living below 200% of FPL. Most (75.0%) of the sample was non-Hispanic white, the percentage of whom ranged from 64.2% in Connecticut to 95.5% in Vermont. The percentage of respondents living below 200% of FPL ranged from 27.0% in Massachusetts to 52.4% in Maine. The percentage of respondents whose income was unknown also varied significantly among states; it ranged from 11.3% in Maine to 26.4% in Massachusetts. However, diabetes prevalence, the percentage of respondents aged 65 or older, and the percentage of respondents whose body mass index was greater than 30.0 were similar across the 5 New England states.
The 5 states varied on several outcome measures (Table 2). Maine and Vermont had lower rates than other states of several poor outcomes: no provider foot examination in past year; no self-examination of feet; and not knowing how many HbA1c tests were received in the past year or what an HbA1c test is. Across the 5 states, 50.4% of all respondents did not receive complete annual diabetes care, 51.0% had ever taken a class on diabetes self-management, and 17.9% reported having diabetes-related retinopathy.
Multivariate logistic regressions showed that race/ethnicity and FPL bracket were not major drivers of annual diabetes care, patient engagement, or reporting of diabetes-related retinopathy (Figure 2). Compared with non-Hispanic white respondents, Hispanic/Latino respondents had a significantly higher risk of not knowing how many HbA1cs they had had in the past year or what an HbA1c is (adjusted odds ratio [AOR] = 2.74; 95% confidence interval [CI], 1.15–6.56]) and reporting diabetes-related retinopathy (AOR = 3.13; 95% CI, 1.61–6.10). Non-Hispanic black respondents did not differ from non-Hispanic white respondents for any of the outcomes. Similarly, respondents living at 400% or more of FPL had significantly less risk than those living at less than 200% of FPL of not knowing how many HbA1cs they had had in the past year or what an HbA1c is (AOR = 0.20; 95% CI, 0.05–0.78) and reporting diabetes-related retinopathy (AOR = 0.41; 95% CI, 0.22–0.75).
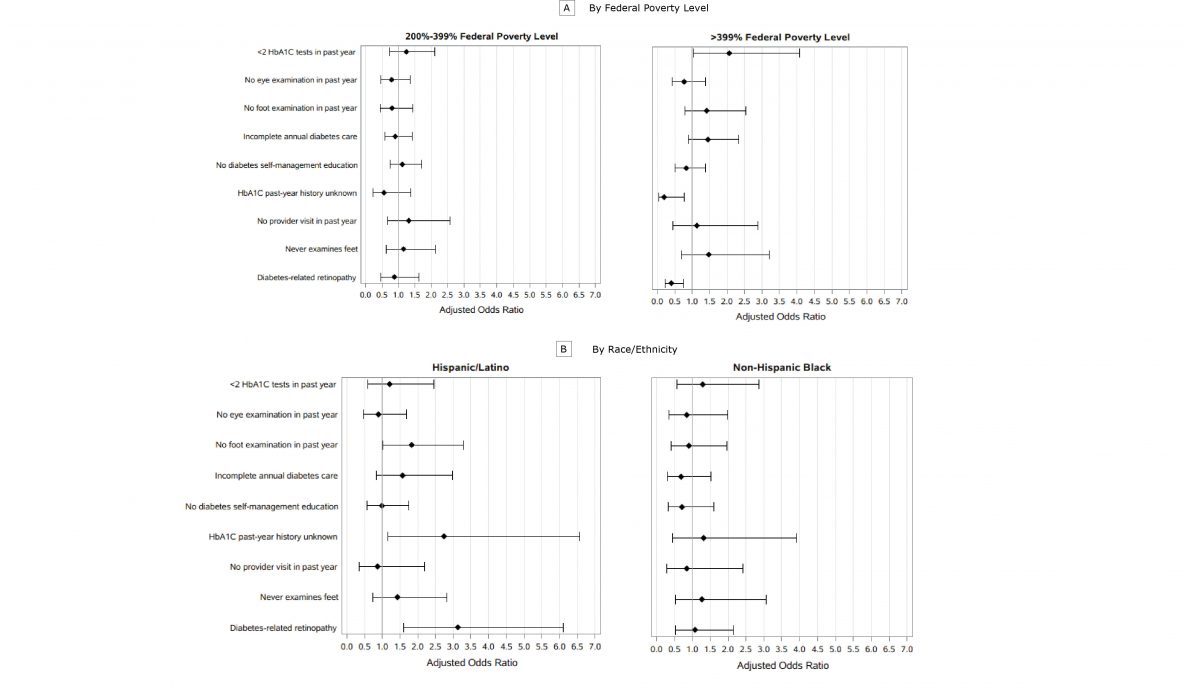
Figure 2.
Adjusted odds ratios for diabetes maintenance activities in 5 New England states, 2015 and 2016. Covariates were race/ethnicity, age group, education, sex, insurance (yes or no), sole adult in household, any leisure-time physical activity, current smoker, and state of residence. A, Adjusted odds ratio by FPL, where reference group is <200% of the FPL. B, Adjusted odds ratio by race/ethnicity, where reference group is non-Hispanic white. Error bars indicate 95% confidence intervals. Data sources: 2015 Connecticut BRFSS, 2015 Maine BRFSS, 2016 Massachusetts BRFSS, 2015 Rhode Island BRFSS, 2015 Vermont BRFSS. Abbreviations: BRFSS, Behavioral Risk Factor Surveillance System; FPL, federal poverty level; HbA1c, hemoglobin A1c. [A tabular version of this figure is also available.]
Among the 4 states with data on insurance type, we found only 1 case of a difference between people with public insurance and people with private insurance. Additional regression models showed that personal behaviors (smoking and physical activity) and state of residence were only rarely associated with the outcomes investigated.
Discussion
Our data show that inadequate diabetes maintenance is endemic even in a relatively wealthy US census division with high rates of insurance coverage and generally strong access to health care and related health services. Most people with diagnosed diabetes in our sample had at least some interaction with their health care provider in the past year for diabetes care, but only half reported receiving all 3 recommended annual tests, half had ever taken a class on how to manage their diabetes, and almost 1 in 5 reported having diabetes-related retinopathy. Our findings thus highlight 2 questions about secondary prevention among people with diabetes in 1 US census division: what are the likely drivers of inadequate diabetes maintenance, and does a multistate approach to chronic disease surveillance provide additional guidance to states as they increasingly move into an era of simultaneous examination of claims data, clinical data, and survey data?
Our results appear largely consistent with national data on disparities in diabetes prevalence and maintenance activities as described by CDC (16). We found that people with diabetes who are Hispanic/Latino and people in a lower FPL bracket are less likely to know how many HbA1c tests they had had in the past year or what an HbA1c test is. Hispanic/Latino people and people in a lower FPL bracket were also more likely to report having diabetes-related retinopathy. Overall, however, long-standing explanations of disparities by race/ethnicity, SES, and insurance status only partially explain who is likely to have inadequate diabetes maintenance. The increasing use of clinical and claims data for population health analyses may help identify whether patterns in diabetes maintenance result more from individual-level factors (eg, race/ethnicity, SES, insurance status) than from factors related to the health care system. However, it is not always easy to distinguish between the 2 types of factors. For example, adhering to guidance on foot self-examination might reflect clear communication between patients and providers as much as it reflects individual health behaviors, and failure to meet annual clinical guidelines may result from either provider oversight or patient failure to comply with provider recommendations.
Future investigations perhaps should track the path from distal causes of population health (eg, political and economic factors) (18) to measures of diabetes maintenance. For example, in the complex and shifting world of health insurance, mechanisms such as “churning” in and out of coverage or increasing underinsurance though various out-of-pocket expenses (19–23) may explain patterns of incomplete care more than the simple type of payer does. Recent studies investigated food insecurity as a more precise measure than income or education of whether limited economic resources are associated with poor diabetes maintenance (24–27). The Commonwealth Care option in Massachusetts may highlight a problem in post-2014 data in other states: these states do not distinguish subsidized plans purchased on state or federal exchanges from other private insurance.
The increasing availability of clinical and claims data promises to shed new light on patterns and causes of incomplete diabetes care and poor outcomes, but it also increases the risk of researchers and practitioners becoming lost in analytical forests. We suggest that multistate collaborative analyses like ours can establish a helpful foundation by highlighting structures underlying health care and health more readily than either national or state-specific analyses alone. Other studies have conducted regional and census district analyses (28–31), and these typically indicate that northeastern states have a lower prevalence of diabetes and chronic disease risk factors such as overweight, cigarette smoking, physical inactivity, and consumption of unhealthy foods. Although our analysis does not compare New England with other US census divisions of the United States, it provides further data on the gaps in care, even in this relatively advantaged area of the country.
Finally, in our study, partnering to combine data allowed states with smaller populations and sample sizes, which often struggle with public health surveillance, to produce more reliable estimates for small population subgroups and low-prevalence outcomes. Partnering may be particularly viable at the census district level, because the assumption is that census districts share common socioeconomic and cultural features. We hope that combining data with neighboring states will aid in not only the identification of a disproportionate burden among small population subgroups but also more effective planning of state or cross-state interventions. We also propose that partnerships can be built on to pool states’ surveillance capacity. Discussion among the coauthors generated hypotheses for follow-up analyses: were patterns of missing data on annual examinations driven by inadequate provider availability, either geographically in rural areas, or by insufficient numbers of primary care providers? Did different rates of engagement in diabetes education reflect varying levels of provider engagement and referral across states or different levels of state health department support for diabetes education infrastructure? Our regional collaboration may also encourage state-to-state sharing of success stories and lessons learned to increase the prevalence of preventive care practices among adults with diabetes in New England.
This study has several limitations. The study sample was dominated by Massachusetts and Connecticut, and although we found few significant differences in diabetes measures across states in our sample, the disproportionate role of these 2 states may mask important differences in Maine, Rhode Island, and Vermont. That we found few significant differences may also reflect small sample sizes for some of the outcomes and population subgroups, even with the pooling of data. BRFSS data are self-reported, and self-reported data are subject to recall bias, particularly for less-memorable health care events during the 1-year lookback period. Some measures may be especially prone to recall bias, such as the relatively minor procedure of a provider foot examination or whether blood drawn was for an HbA1c test rather than for another test. Previous studies have found that self-reported diabetes data were either underreported or overreported compared with data extracted from medical records, although agreement between these 2 sources of data is stronger when tests are routine and easily understood (32). Given the complex world of health insurance, it may also be that the measure of having any insurance at all and the measure on primary source of health care coverage at 1 point in time do not adequately capture data on serious gaps in coverage (eg, “churning” or increasing out-of-pocket mechanisms) that may account for lapses in care. Although some studies have examined insulin use as a proxy for poorly controlled diabetes, it would have been an unreliable measure for poor control in our study because BRFSS does not distinguish between type 1 diabetes and type 2 diabetes beyond a rough proxy of age of diagnosis. Finally, the policy-based economic and health care system factors that may explain inadequate diabetes maintenance will require additional state-specific research. We argue, however, that analyses like ours can provide the initial guidance for subsequent research and for building cross-state collaborations.
Acknowledgments
We thank Maria McKenna of the Massachusetts Department of Public Health. The authors have no conflicts of interest or financial relationships to report and used no copyrighted material, instruments, or tools except the Behavioral Risk Factor Surveillance System.
Author Information
Corresponding Author: Dora M. Dumont, PhD, MPH, Department of Epidemiology, Brown University, 3 Capitol Hill, Providence, RI 02908. Telephone: 401-222-4804. Email: dora.dumont@health.ri.gov.
Author Affiliations: 1Rhode Island Department of Health, Providence, Rhode Island. 2Department of Epidemiology, Brown University, Providence, Rhode Island. 3University of Southern Maine, Portland, Maine. 4Maine Center for Disease Control and Prevention, Augusta, Maine. 5Connecticut Department of Public Health, Hartford, Connecticut. 6Vermont Department of Health, Burlington, Vermont.
References
- Boyle JP, Thompson TJ, Gregg EW, Barker LE, Williamson DF. Projection of the year 2050 burden of diabetes in the US adult population: dynamic modeling of incidence, mortality, and prediabetes prevalence. Popul Health Metr 2010;8(1):29. CrossRefexternal icon PubMedexternal icon
- Hu R, Shi L, Liang H, Haile GP, Lee DC. Racial/ethnic disparities in primary care quality among type 2 diabetes patients, Medical Expenditure Panel Survey, 2012. Prev Chronic Dis 2016;13:E100. CrossRefexternal icon PubMedexternal icon
- Hu R, Shi L, Rane S, Zhu J, Chen CC. Insurance, racial/ethnic, SES-related disparities in quality of care among US adults with diabetes. J Immigr Minor Health 2014;16(4):565–75. CrossRefexternal icon PubMedexternal icon
- Nwasuruba C, Osuagwu C, Bae S, Singh KP, Egede LE. Racial differences in diabetes self-management and quality of care in Texas. J Diabetes Complications 2009;23(2):112–8. CrossRefexternal icon PubMedexternal icon
- Oladele CR, Barnett E. Racial/ethnic and social class differences in preventive care practices among persons with diabetes. BMC Public Health 2006;6(1):259. CrossRefexternal icon PubMedexternal icon
- Richard P, Alexandre PK, Lara A, Akamigbo AB. Racial and ethnic disparities in the quality of diabetes care in a nationally representative sample. Prev Chronic Dis 2011;8(6):A142. PubMedexternal icon
- Nelson KM, Chapko MK, Reiber G, Boyko EJ. The association between health insurance coverage and diabetes care; data from the 2000 Behavioral Risk Factor Surveillance System. Health Serv Res 2005;40(2):361–72. CrossRefexternal icon PubMedexternal icon
- Canedo JR, Miller ST, Schlundt D, Fadden MK, Sanderson M. Racial/ethnic disparities in diabetes quality of care: the role of healthcare access and socioeconomic status. J Racial Ethn Health Disparities 2018;5(1):7–14. CrossRefexternal icon PubMedexternal icon
- Zhang JX, Huang ES, Drum ML, Kirchhoff AC, Schlichting JA, Schaefer CT, et al. Insurance status and quality of diabetes care in community health centers. Am J Public Health 2009;99(4):742–7. CrossRefexternal icon PubMedexternal icon
- Doucette ED, Salas J, Wang J, Scherrer JF. Insurance coverage and diabetes quality indicators among patients with diabetes in the US general population. Prim Care Diabetes 2017;11(6):515–21. CrossRefexternal icon PubMedexternal icon
- Connecticut State Department of Public Health. Connecticut Behavioral Risk Factor Surveillance System. https://portal.ct.gov/DPH/Health-Information-Systems–Reporting/Hisrhome/Connecticut-Behavioral-Risk-Factor-Surveillance-System-CT-BRFSS. Accessed November 23, 2018.
- Maine Department of Health and Human Services. Behavioral Risk Factor Surveillance System. https://www.maine.gov/dhhs/mecdc/public-health-systems/data-research/brfss. Accessed November 23, 2018.
- Commonwealth of Massachusetts. Behavioral Risk Factor Surveillance System. https://www.mass.gov/behavioral-risk-factor-surveillance. Accessed November 23, 2018.
- State of Rhode Island Department of Health. http://www.health.ri.gov/data/behaviorriskfactorsurvey. Accessed November 23, 2018.
- Vermont Department of Health. Vermont BRFSS: adult health survey. http://www.healthvermont.gov/health-statistics-vital-records/population-health-surveys-data/brfss. Accessed November 23, 2018.
- Centers for Disease Control and Prevention. National diabetes statistics report, 2017. 2017. https://www.cdc.gov/diabetes/pdfs/data/statistics/national-diabetes-statistics-report.pdf. Accessed March 15, 2018.
- Centers for Disease Control and Prevention. Statistical brief on the health care access module, 2013 and 2014. https://www.cdc.gov/brfss/data_documentation/pdf/2013-2014_hcs.pdf. Accessed December 15, 2017.
- Nosrati E, Ash M, Marmot M, McKee M, King LP. The association between income and life expectancy revisited: deindustrialization, incarceration and the widening health gap. Int J Epidemiol 2017. PubMedexternal icon
- Riggs KR, Buttorff C, Alexander GC. Impact of out-of-pocket spending caps on financial burden of those with group health insurance. J Gen Intern Med 2015;30(5):683–8. CrossRefexternal icon PubMedexternal icon
- Woolhandler S, Himmelstein DU. Life or debt: underinsurance in America. J Gen Intern Med 2013;28(9):1122–4. CrossRefexternal icon PubMedexternal icon
- Schoen C, Collins SR, Kriss JL, Doty MM. How many are underinsured? Trends among U.S. adults, 2003 and 2007. Health Aff (Millwood) 2008;27(4):w298–309. CrossRefexternal icon PubMedexternal icon
- Schoen C, DesRoches C. Uninsured and unstably insured: the importance of continuous insurance coverage. Health Serv Res 2000;35(1 Pt 2):187–206. PubMedexternal icon
- Schoen C, Solís-Román C, Huober N, Kelchner Z. On Medicare but at risk: a state-level analysis of beneficiaries who are underinsured or facing high total cost burdens. New York (NY): Commonwealth Fund; 2016. https://www.commonwealthfund.org/sites/default/files/documents/___media_files_publications_issue_brief_2016_may_1874_schoen_on_medicare_but_at_risk_v5.pdf. Accessed December 15, 2017.
- Berkowitz SA, Berkowitz TSZ, Meigs JB, Wexler DJ. Trends in food insecurity for adults with cardiometabolic disease in the United States: 2005–2012. PLoS One 2017;12(6):e0179172. CrossRefexternal icon PubMedexternal icon
- Knight CK, Probst JC, Liese AD, Sercye E, Jones SJ. Household food insecurity and medication “scrimping” among US adults with diabetes. Prev Med 2016;83:41–5. CrossRefexternal icon PubMedexternal icon
- Patel MR, Piette JD, Resnicow K, Kowalski-Dobson T, Heisler M. Social determinants of health, cost-related nonadherence, and cost-reducing behaviors among adults with diabetes: findings from the National Health Interview Survey. Med Care 2016;54(8):796–803. CrossRefexternal icon PubMedexternal icon
- Gucciardi E, Vahabi M, Norris N, Del Monte JP, Farnum C. The intersection between food insecurity and diabetes: a review. Curr Nutr Rep 2014;3(4)324–332.
- Barker LE, Kirtland KA, Gregg EW, Geiss LS, Thompson TJ. Geographic distribution of diagnosed diabetes in the U.S.: a diabetes belt. Am J Prev Med 2011;40(4):434–9. CrossRefexternal icon PubMedexternal icon
- Gurka MJ, Filipp SL, DeBoer MD. Geographical variation in the prevalence of obesity, metabolic syndrome, and diabetes among US adults. Nutr Diabetes 2018;8(1):14. CrossRefexternal icon PubMedexternal icon
- Michimi A, Wimberly MC. Spatial patterns of obesity and associated risk factors in the conterminous U.S. Am J Prev Med 2010;39(2):e1–12. CrossRefexternal icon PubMedexternal icon
- Troost JP, Rafferty AP, Luo Z, Reeves MJ. Temporal and regional trends in the prevalence of healthy lifestyle characteristics: United States, 1994–2007. Am J Public Health 2012;102(7):1392–8. CrossRefexternal icon PubMedexternal icon
- Collet TH, Taffé P, Bordet J, Burnand B, Peytremann-Bridevaux I. Reproducibility of diabetes quality of care indicators as reported by patients and physicians. Eur J Public Health 2014;24(6):1004–9. CrossRefexternal icon PubMedexternal icon
Tables
| Characteristic | Connecticut | Maine | Massachusetts | Rhode Island | Vermont | P Valueb | All 5 States |
|---|---|---|---|---|---|---|---|
| Unweighted no. of respondents to diabetes module | 1,350 | 644 | 440 | 738 | 609 | — | 3781 |
| Prevalence of diabetes, % | 12.1 | 12.6 | 12.1 | 12.4 | 10.6 | .71 | 12.1 |
| Weighted no. (%c) of respondents | 243,121 (26.4) | 101,361 (10.6) | 463,488 (50.4) | 72,444 (7.7) | 38,941 (4.8) | — | 919,355 (100.0) |
| Race/ethnicity | |||||||
| Non-Hispanic black | 14.4 | 0.3 | 10.4 | 7.1 | 0.2 | <.001 | 9.6 |
| Hispanic/Latino | 16.1 | 0.9 | 9.8 | 16.1 | 0.3 | 10.6 | |
| Non-Hispanic white | 64.2 | 94.2 | 75.3 | 71.8 | 95.5 | 75.0 | |
| All other races/ethnicities | 5.3 | 4.7 | 4.6 | 4.9 | 3.9 | 4.8 | |
| Female | 46.4 | 47.0 | 50.3 | 46.9 | 45.4 | .57 | 48.4 |
| Aged ≥65 | 46.3 | 51.3 | 50.1 | 47.8 | 48.5 | .47 | 49.0 |
| Sole adult in household | 29.9 | 34.7 | 36.5 | 30.0 | 29.5 | .06 | 33.8 |
| Education | |||||||
| No high school diploma | 23.6 | 16.3 | 19.2 | 25.9 | 16.8 | .16 | 20.5 |
| High school diploma or GED | 32.5 | 38.7 | 32.0 | 29.7 | 39.1 | 33.0 | |
| 1–3 y of college | 24.8 | 30.2 | 29.1 | 27.2 | 27.0 | 27.8 | |
| ≥4 y of college | 19.1 | 14.9 | 19.7 | 17.2 | 17.1 | 18.7 | |
| Type of insuranced | |||||||
| Private | 36.3 | 30.5 | 24.6 | 37.7 | —e | <.001 | 29.7 |
| Medicaid | 10.5 | 8.9 | 12.3 | 6.2 | 10.9 | ||
| Medicare | 40.3 | 43.2 | 54.6 | 43.1 | 48.0 | ||
| Other | 7.0 | 9.6 | 3.8 | 8.7 | 5.8 | ||
| Income | |||||||
| <200% Federal poverty level | 37.6 | 52.4 | 27.0 | 39.3 | 40.1 | <.001 | 34.2 |
| Income unknown | 16.7 | 11.3 | 26.4 | 23.4 | 20.1 | <.001 | 22.2 |
| Current smoker | 14.4 | 13.4 | 16.3 | 17.1 | 13.5 | .68 | 15.4 |
| No leisure-time physical activity | 39.6 | 35.2 | 37.3 | 44.4 | 41.7 | .38 | 38.4 |
Abbreviations: —, does not apply; BRFSS, Behavioral Risk Factor Surveillance System.
a Data sources: diabetes module in 2015 Connecticut BRFSS, 2015 Maine BRFSS, 2016 Massachusetts BRFSS, 2015 Rhode Island BRFSS, 2015 Vermont BRFSS (11–15). All values are percentages unless otherwise indicated. New Hampshire was not included in the analysis because it did not use the diabetes module in 2015 or 2016. All values are weighted number (percentage) unless otherwise indicated.
b Determined by χ2 test.
c Denominator is the number of respondents in all 5 states.
d Massachusetts, which enacted its own health care reform in 2006, has data on an additional insurance option (Commonwealth Care); because this type of coverage is a public–private hybrid, we excluded these observations from analysis.
e Vermont excluded because its data set did not include information on primary source of health care coverage.
| Measure | Connecticut (N = 243,121) | Maine (N = 101,361) | Massachusetts (N = 463, 488) | Rhode Island (N = 72,444) | Vermont (N = 38,941) | Pb | All 5 States, % (95% Confidence Interval) |
|---|---|---|---|---|---|---|---|
| Annual diabetes carec | |||||||
| <2 HbA1c tests in past year | 23.8 | 19.6 | 19.5 | 18.2 | 23.2 | .43 | 20.7 (17.4–23.9) |
| No eye examination in past year | 28.0 | 25.6 | 27.2 | 23.0 | 25.0 | .77 | 26.8 (23.5–30.1) |
| No foot examination in past year | 24.9 | 12.7 | 23.7 | 22.6 | 17.3 | .005 | 22.4 (19.2–25.7) |
| Incomplete annual diabetes care | 54.7 | 43.4 | 49.7 | 51.3 | 49.1 | .10 | 50.4 (46.6–54.2) |
| Patient engagement in diabetes care | |||||||
| Had never taken a course or class on diabetes self-management | 53.8 | 41.3 | 51.6 | 51.9 | 50.3 | .04 | 51.0 (47.3–54.7) |
| Did not know the number of HbA1c tests received in past year or did not know what an HbA1c test is | 13.0 | 4.4 | 9.2 | 11.0 | 3.5 | .001 | 9.6 (7.5–11.7) |
| Never examines feet | 19.9 | 9.8 | 17.0 | 15.0 | 18.2 | .04 | 16.9 (13.9–19.9) |
| Did not see provider about diabetes in past year | 10.2 | 9.5 | 12.2 | 8.6 | 9.5 | .55 | 11.0 (8.3–13.6) |
| Poor diabetes control | |||||||
| Diabetes-related retinopathy | 18.6 | NA | 17.1 | 19.6 | 19.8 | .77 | 17.9 (15.0–20.7) |
Abbreviations: BRFSS, Behavioral Risk Factor Surveillance System; HbA1c, hemoglobin A1c; NA, not applicable.
a Data sources: diabetes modules of 2015 Connecticut BRFSS, 2015 Maine BRFSS, 2016 Massachusetts BRFSS, 2015 Rhode Island BRFSS , 2015 Vermont BRFSS (11–15). All values are percentages unless otherwise indicated. New Hampshire was not included in the analysis because it did not use the diabetes module in 2015 or 2016. All numbers are weighted.
b Determined by χ2 test.
c Complete annual diabetes care consists of 2 HbA1c tests, an eye examination with dilation by a health care provider, and a foot examination by a health care provider (11).
The opinions expressed by authors contributing to this journal do not necessarily reflect the opinions of the U.S. Department of Health and Human Services, the Public Health Service, the Centers for Disease Control and Prevention, or the authors’ affiliated institutions.