Using Small-area Estimation to Describe County-level Disparities in Mammography
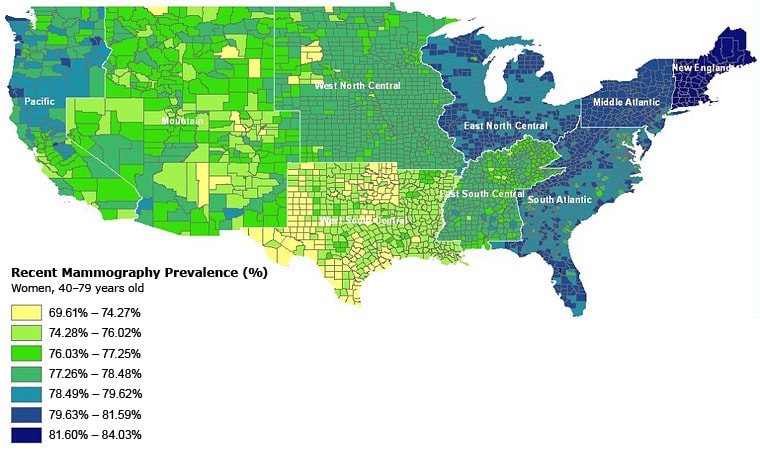
Figure. County-level prevalence of recent mammography (in the past 2 years) for women aged 40 to 79 years in the continental United States. Estimated using data from the 2000 Behavioral Risk Factor Surveillance System and US Decennial Census. US Census divisions are New England (Maine, New Hampshire, Vermont, Rhode Island, Massachusetts), Middle Atlantic (New York, Pennsylvania, New Jersey, Connecticut), South Atlantic (Virginia, West Virginia, Delaware, Maryland, District of Columbia, North Carolina, South Carolina, Georgia, Florida), East South Central (Kentucky, Mississippi, Alabama, Tennessee), East North Central (Wisconsin, Illinois, Michigan, Indiana, Ohio), West North Central (North Dakota, South Dakota, Nebraska, Kansas, Minnesota, Iowa, Missouri), West South Central (Louisiana, Texas, Oklahoma, Arkansas), Mountain (Montana, Idaho, Wyoming, Nevada, Utah, Colorado, Arizona, New Mexico), and Pacific (Washington, Oregon, California, Alaska, and Hawaii). With the exception of some counties within each division, the map generally shows a mammography rate of 81.60%-84.03% for New England, 79.63-81.59 for Middle Atlantic, 78.49-81.59 for South Atlantic and East North Central, 77.26-78.48 for West North Central and East South Central, 69.61-77.25 for West South Central, 74.28-78.48 for Mountain, and 76.03-79.62 for Pacific regions. Hawaii and Alaska were not assessed. |
|
|
|
|
|
|
|