NSSP Update – March 2020
A Technical Newsletter for the NSSP Community of Practice | April 2020
Community of Practice
- Highlights of the Community’s COVID-19 Syndromic Surveillance Activities
- Subcommittee Updates
- ESSENCE Queries
Spotlight on Syndromic Surveillance
Questions and Tips
Collaborations
Highlights of the Community’s COVID-19 Syndromic Surveillance Activities

Similar to how collaboration among epidemiologists, analysts, and others in the field has been used to respond to cases of e-cigarette, or vaping, product use-associated lung injury (EVALI), collaboration has been important—and will continue to be important—to everyone working in syndromic surveillance for the coronavirus disease 2019 (COVID-19) response.
On February 5, 2020, the NSSP Community of Practice (CoP) hosted an ad hoc call to discuss the ongoing COVID-19 response. During that call, epidemiologists from different levels of public health discussed the syndromic queries that have been developed for both case-finding and future trend monitoring. Additionally, Natasha Close (WA) demonstrated the COVID-19 dashboard recently shared on the NSSP ESSENCE myESSENCE library. (This recording can be viewed on the Knowledge Repository.)

The NSSP CoP’s monthly call in February 2020 focused on how community members are working with data providers to collect travel history. These data can be used when responding to an emerging disease or condition of interest. Participants described their typical processes for collecting information and, specifically, what they were doing to support the COVID-19 response. By pooling their collective knowledge, community members learned new strategies for improving data collection.
A COVID-19 Slack channel has been created to facilitate real-time discussion among community members, NSSP staff, and other stakeholders. Some community members are using Slack to get feedback that they can use to improve queries, whereas others are using the channel for concensus gathering. Slack is, essentially, a collaborative hub for sharing files and ideas in one searchable space. To join ongoing conversations about the coronavirus response, please email nssp@cdc.gov with the subject line “Add to COVID-19 Slack.”
Subcommittee Updates
Technical Subcommittee
- States (KS, OR, WA) are piloting death records as a new ESSENCE data source.
- In April, CDC will look for six to nine volunteers to help test new functionality for the Access & Management Center (AMC) that will allow data sharing to be controlled by syndrome, subsyndrome, and Chief Complaint and Discharge Diagnosis (CCDD) category. If interested, please email NSSP@cdc.gov.
- Technical Subcommittee seeks volunteers to join or lead a CCDD Improvement Workgroup.
Overdose Surveillance Subcommittee
- Co-chairs are working with the Council of State and Territorial Epidemiologists (CSTE) Overdose Surveillance Subcommittee to streamline efforts and identify opportunities for collaboration.
- The January 2020 call described Overdose to Action (OD2A), a cooperative agreement that aims to increase timeliness and comprehensiveness of data and to use those data to inform public health response and prevention activities.
Data Quality Subcommittee
- AZ described methods for pulling metadata to add to OD2A Rapid Emergency Department (ED) reports, and
- MEDITECH’s available batching process for syndromic surveillance (SyS) was presented.
Syndrome Definition Subcommittee
- A new Disaster-related Mental Health Syndrome Definition is available in the Knowledge Repository’s Syndrome Library and in ESSENCE as a CCDD category.
- During the February 2020 call, Natasha Close (WA) demonstrated how to use the Coronavirus Dashboard posted in myESSENCE Library.
SPHERR Subcommittee
In January 2020, SPHERR conducted two practice exchange calls in which members shared their current SyS-related emergency response and recovery activities:
- Call #1: Members discussed work on a guidance document that would integrate syndromic surveillance with preparedness activities.
- Call #2: Members discussed strategies for monitoring cold weather-related illnesses and injuries.
Core Committee
CSTE will host an in-person working meeting for the NSSP CoP Core Committee members in March 2020. Members will discuss ways to achieve the CoP’s mission to “advance syndromic surveillance capabilities nationwide” in 2020. Core Committee members aim to—
- Identify best practices, lessons learned from NSSP CoP activities, and two or three priority activities for the community to pursue; and
- Develop a road map for the NSSP CoP to implement in 2020.

- NSSP Community of Practice (CoP) Landing Page and Calendar:
https://https://nsspcommunityofpractice.org/
CoP overview, description of workgroups and committees, call calendar and conference lines, and links to NSSP resources - NSSP CoP Basecamp:
https://3.basecamp.com/3164497/join/MxRBAPzoNn8M
Online collaborative space for the NSSP CoP that includes call recordings, slides, and brief notes from committee meetings - Knowledge Repository (KR):
https://knowledgerepository.syndromicsurveillance.org/
Curated webinars, use cases, syndromes, stories of surveillance in action, meeting recordings, journal articles, and more

Look for a new NSSP CoP website in Spring 2020!
ESSENCE Queries
January and February 2020


A key feature of NSSP–ESSENCE is its ability to use free-text definitions across different fields to generate custom queries. The syndromic surveillance community can use this feature to develop and refine category definitions and to identify and respond to public health events that may not be apparent in established categorical definitions (i.e., syndromes, subsyndromes, and Chief Complaint and Discharge Diagnosis [CCDD] categories).
This word cloud summarizes free-text and coded values that epidemiologists and data analysts queried in ESSENCE during November 2019. We created it by using the Wordcloud2 package in RStudio. The relative size of the terms suggests the frequency of use in a query. NSSP super administrators can query ESSENCE usage logs to learn what queries are run nationwide and how long they take to complete.
Questions and Tips
Q: How can I use the data quality filters in NSSP–ESSENCE when running a query?
A: The Data Flow tab provides both an at-a-glance and a detailed view of Processed, Exceptions, and Filtered records.
By default, the DQ Dashboard shows all your site’s data—every feed, every facility. The view you’ll see in the bar chart will look something like this:

By using other tabs, however, you can see different views that apply different metrics—and each serves a different purpose.
For example, you can use the DQ Dashboard’s Data Flow tab to identify ESSENCE backlogs and other processing issues. To do this, select the Data Flow tab and click the Visit Count Comparison graph. This option lets you see a bar chart with the Count of your site’s Processed Messages by arrived_date as well as your site’s Processed and ESSENCE visit counts by c_visit_date. The y-axis shows the message count, and the x-axis shows the arrived_date. You can drill down even more by selecting any one metric (e.g., Processed Visits versus Processed Messages) to get a better sense of comparison.
If you notice a backlog or see only the sent messages from an earlier Visit Date, you should see a jump in the Processed Message count without a corresponding increase in the ESSENCE and Processed Visit trendlines. Here is an example:

Detailed information about these graphs can be found in the BioSense Platform User Manual for the Data Quality Dashboard. Contact your site inspectors for more information by emailing NSSP@cdc.gov.
Q: How can I use the DQ Dashboard to get facility-level information on Exceptions?
A: To get Processed, Exceptions, or Filtered records for the site, you need to make a few changes. The default selection for Feed is All Feeds. To see Filtered or Exceptions by facility, start by clicking Deselect All feeds.

Once done, select the facility of interest. Change the Date Range to match dates of interest. Give the dashboard a few minutes to realign and display facility-level metrics.
Now you will see data flow metrics for the facility of interest. Here is an example:

Spotlight on Syndromic Surveillance Practice

NSSP’s Role in the EVALI Investigation
The National Syndromic Surveillance Program (NSSP) has received widespread recognition for its role in characterizing e-cigarette, or vaping, product-use associated lung injury (EVALI). CDC Principal Deputy Director, Dr. Anne Schuchat, underscored the unique role that syndromic surveillance plays in characterizing EVALI. “First, it is clear that the outbreak represented a new phenomenon and not recognition of a common syndrome that had evaded our attention,” Schuchat said. “Today’s report in the New England Journal of Medicine (NEJM) regarding analysis of data from the CDC’s National Syndromic Surveillance Program makes it clear that a sharp rise in emergency department visits began in June 2019. And occurrences peaked in September 2019, consistent with our active case reporting from public health departments around the country.”1 For a comprehensive account of how syndromic data were used to characterize EVALI, please read the NEJM special report “Syndromic Surveillance for E-Cigarette, or Vaping, Product Use-Associated Lung Injury.”2
Related Link
NPR Health Transcript. CDC Says THC Additive is the Culprit in Most Vaping Deaths [Internet]. 2019 Dec 21 [cited 2020 Jan 10]
Collaborations
Kansas* Uses Syndromic Data to Improve Case Reporting for EVALI

Photo Courtesy of C-Span. Kansas Department of Health and Environment Secretary, Dr. Lee Norman, testifies to Congress about the need for a public health investigation of e-cigarette, or vaping, product use-associated lung injury.
The outbreak of e-cigarette, or vaping, product use-associated lung injury (EVALI) in the United States received widespread media attention when CDC began investigating a cluster of teens and young adults in Wisconsin and Illinois hospitalized with unexplained, sudden onset severe acute respiratory distress. With the increasing popularity of vaping among youth combined with the severity of this illness, there was a push to identify and prevent additional cases quickly.
The Kansas Department of Health and Environment (KDHE), which routinely uses syndromic data to detect potential health problems, took initiative to make sure healthcare providers unfamiliar with EVALI would not mistake it for other conditions. Kansas epidemiologists began using the national severe lung injury query to actively identify suspected cases. They soon realized that vaping-related terms alone did not always identify people with EVALI and that a diagnosis could be masked by, for example, a patient’s drug or alcohol use. They refined the EVALI query to make it more sensitive and excluded age groups not affected (young children and the elderly) to make the query more specific. They regularly examined this line-level data.
Syndromic surveillance data on EVALI helped Kansas health officials understand the emergence of this condition in their state and raise awareness across health facilities. By communicating with hospitals and infection prevention staff to request records for suspected cases, Kansas health officials also improved medical facility reporting of this life-threatening condition. Through funding from the National Syndromic Surveillance Program, syndromic surveillance is improving the nation’s public health. Read the full story. >>
*EVALI-related content was provided by Epidemiologist Gabriel Ann Haas, Vital Bureau of Epidemiology and Public Health Informatics, Kansas Department of Health and Environment.
Related Links
MMWR: Characteristics of Persons Who Report Using Only Nicotine-Containing Products Among Interviewed Patients with E-cigarette, or Vaping, Product Use–Associated Lung Injury — Illinois, August–December 2019

Wildfires in California: A Critical Use Case for Expanding State Capacity and Sharing Information across Public Health Jurisdictions
In 2018, California experienced its most destructive wildfire season on record—7,571 fires burned nearly 1.7 million acres, damaged or destroyed 23,300 structures, and resulted in 93 confirmed fatalities.1 More than 25 million acres of California wildlands are classified as very high or extreme fire threats—a risk area covering more than half the state.2 The Camp Fire, which began November 8, 2018, remains California’s deadliest wildfire ever.1
At the onset of the fires, California’s decentralized and independent public health jurisdictions were in various stages of becoming part of CDC’s National Syndromic Surveillance Program (NSSP). NSSP scientists contacted Sacramento, San Mateo, and other affected sites to propose technical assistance, guidance, and resources. They shared tried and tested queries and visualizations that the Washington State Department of Health had developed to monitor wildfire events. Epidemiologists in Sacramento and San Mateo counties quickly adapted the wildfire-related syndrome definitions and surveillance techniques. They set up monitoring and response plans based on wildfire proximity and magnitude and established data-sharing relationships across jurisdictional lines.
The differences between Sacramento and San Mateo Counties’ surveillance approach shows just how flexible syndromic surveillance can be. Sacramento, for example, monitored emergency department (ED) visits for other wildfire-related health concerns, combining syndromic data with air quality data to improve situational awareness for public messaging. San Mateo consulted with scientists at San Diego County Health and Human Services Agency, an early adopter of syndromic surveillance, and used San Diego’s work as a model for integrating syndromic data with its existing surveillance plan to monitor for health effects of wildfire smoke exposure.
California’s use of syndromic data during the 2018 wildfire season helped launch syndromic surveillance capacity-building initiatives among local health agencies. Further, the state’s experience demonstrates the utility, reliability, and timeliness of syndromic data for monitoring and characterizing wildfire-related health impacts.
Read the full story about this impressive collaboration that evolved out of the 2018 response to wildfires in California. Outcomes include a pilot program on climatic exposures and respiratory health outcomes, formation of new cross-jurisdictional relationships, and a desire for regional collaboration and information exchange around emerging areas of syndromic surveillance.
2California Department of Forestry and Fire Protection. Community wildfire prevention and mitigation report: In response to Executive Order N-05-19 [Internet]. Sacramento (CA): California Department of Forestry and Fire Protection, 2019 Feb. Executive summary; p. 2. Available from: https://www.fire.ca.gov/media/5584/45-day-report-final.pdf
Georgia Uses Syndromic Surveillance to Identify Cryptosporidiosis Outbreak at Water Park

cryptosporidium
Georgia uses syndromic surveillance to detect potential illness from recreational waters, such as pools and water parks. For the past decade, Georgia’s North Central Health District (NCHD) has experienced increases in Cryptosporidium in Houston County. Cryptosporidium (“Crypto”) is a microscopic parasite that causes diarrhea and other symptoms. Crypto is the leading cause of waterborne disease among people in the United States.1In July 2018, a new water park opened in Houston County without proper permits. Within 1 month, local public health epidemiologists received complaints of Crypto. On August 8, 2018, NCHD was notified of possible illnesses. NCHD requested contact information for the initial complainants and assistance from the Georgia Department of Public Health (DPH), Acute Disease Epidemiology Section (ADES), to review syndromic surveillance data. On the morning of August 9, ADES epidemiologists provided historic syndromic data suggesting two potential cases. By the end of the day, the two potential cases were laboratory confirmed, two potential cases were pending laboratory results, and two suspect cases were epidemiologically linked with the laboratory confirmed cases. Local epidemiologists and environmental health specialists worked with the water park owner and staff to close the park until proper chlorine levels and contact times were met and the Cryptosporidium was inactive.
A total of 119 cases of Cryptosporidium were associated with this outbreak. The rapid reporting of syndromic surveillance cases within the first week of the outbreak prompted health officials to expand the dates of concern and to investigate additional recreational water facilities.
Read the full story to learn why Georgia includes syndromic data as part of its comprehensive surveillance program.

Collaborations between health departments and CDC programs* improve how syndromic surveillance gets done. The list of collaborations that follows, while not exhaustive, summarizes ongoing efforts to develop and improve syndrome definitions, conduct pilot tests and exercises, and improve processes to achieve public health goals more efficiently:
- Develop syndrome definition for pregnancy, delivery, and miscarriage.
- Collaborator: CDC’s Maternal and Infant Health/Maternal and Infant Health Branch
- THE SYNDROME DEFINITION IS COMPLETE! NSSP will inform the community when this definition is available for use and has been added to the Knowledge Repository.
- Develop syndrome definition for injecting drug users and endocarditis (infection of inner lining of heart chamber and valves).
- Collaborator: CDC’s National Center for Emerging and Zoonotic Infectious Diseases, Epidemiology Research and Innovations Branch
- Develop syndrome definition for motor vehicle collision syndrome.
- Collaborator: CDC’s Division of Unintentional Injury Prevention and the Transportation Safety Team
- THE SYNDROME DEFINITION IS COMPLETE! NSSP will inform the community when this definition is available for use and has been added to the Knowledge Repository.

- Develop syndrome definition for child abuse and neglect.
- Collaborator: CDC’s Division of Violence Prevention
- THE SYNDROME DEFINITION IS COMPLETE! NSSP will inform the community when this definition is available for use and has been added to the Knowledge Repository.
- Develop syndrome definition for child sexual abuse.
- Collaborator: CDC’s Division of Violence Prevention
- Develop syndrome definition for teen dating violence.
- Collaborator: CDC’s Division of Violence Prevention
- Develop syndrome definition for homeless populations.
- Collaborator: CDC’s Division of Violence Prevention
- THE SYNDROME DEFINITION IS COMPLETE! NSSP will inform the community when this definition is available for use and has been added to the Knowledge Repository.
- Develop syndrome definition for animal bites.
- Collaborator: CDC’s National Center for Environmental Health
- Develop syndrome definition for synthetic marijuana.
- Collaborator: CDC’s Opioid and Overdose Team
- Develop strategies to capture radiation exposures following a radiation disaster and examine whether syndromic surveillance can use poison control center data to supplement existing radiation exposure surveillance.
- Collaborator: CDC’s National Center for Environmental Health
- Assess whether snake bites increase after natural disasters and if data from NSSP and poison control centers can be incorporated to analyze snake bite incidence pre- and post-disaster.
- Collaborator: CDC’s National Center for Environmental Health
*The priorities driving these projects may change. Content is updated monthly to keep current with agency and program changes.
Technical Updates
New NSSP Publications
- BioSense Platform User Manual for the Data Quality Dashboard—The Data Quality (DQ) Dashboard is an interactive tool that helps site administrators identify potential data processing issues by measuring timeliness, completeness, and validity of data. This comprehensive manual covers navigation and graph functionality. It includes data flow visualizations and gives an overview of Plot Builder exportable charts. Published February 2020!

Two more manuals are scheduled for publication. Look for them in the Technical Resource Center, Technical Publications and Standards.
- BioSense Platform User Manual for Data-Quality-on-Demand Programs—For years, NSSP has regularly provided measures on data completeness, timeliness, and validity to site administrators. And, just as data quality has improved, so have our ways of getting information to site administrators quickly.
The Data-Quality-on-Demand (DQOD) programs described in this manual offer real-time access to data quality measures and flexible ways to run reports. SAS Studio users can run data quality checks on their site data as needed and on their schedule.

- BioSense Platform User Manual for SAS Studio—SAS Studio is a customizable, Web browser-based interface for analyzing and visualizing complex data. The manual explains how to configure your SAS account and efficiently use SAS Studio to connect to and analyze your site’s data. Also covered are the basic interface, features, navigation, and functionality.

Current Month and Upcoming Events
| March 17 | Vendor patches in testing and development environments: 6:00–10:00 AM ET |
| March 19 | Vendor patches in onboarding and production environments: 6:00–10:00 AM ET |
Last Month’s Technical Assistance
| February 18 | Deployed vendor patches in testing and development environments |
| February 20 | Deployed vendor patches in onboarding and production environments |
Participation: The map below shows participation in NSSP as of March 31, 2020, with 59 sites (47 states and the District of Columbia).
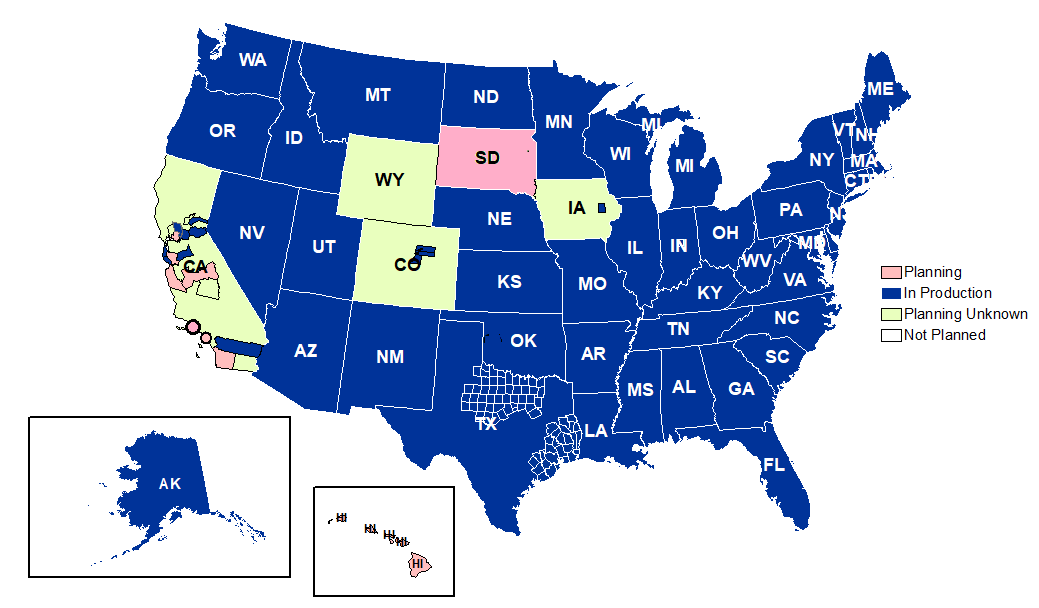
Definitions: NSSP consolidates facilities that provide data under a single data administrative authority called a site administrator. These facilities and single-site administrator constitute a site.
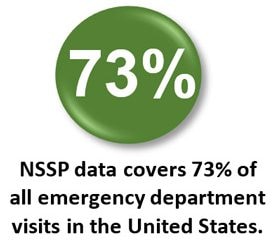
Coverage: NSSP publishes data for emergency department (ED) visit coverage each quarter. As of March 31, 2020, data from EDs covered about 73% of all ED visits in the country. There were 5,041 facilities, including 3,310 EDs from 59 sites (47 states and the District of Columbia), actively contributing data to the NSSP BioSense Platform. The calculation method is described in the December 2018 issue of NSSP Update.
