NSSP Update – April 2019

- Community of Practice
- Popular Community Resources
- NSSP Community of Practice Call
- Implementation Guide for Syndromic Surveillance
- CDC Funding Recipients and Partnerships
- ESSENCE Queries

- Data Quality Corner
- Questions and Tips
- Syndrome Definitions
- Spotlight Article: Developing a Multidisciplinary Syndromic Surveillance Academic Research Program in the United Kingdom
- Technical Updates
- April Updates to the AMC
- Technical Achievements
- Current Month and Upcoming Events
- Last Month’s Technical Assistance
- NSSP Participation
People
Community of Practice
Popular Community Resources

Are you looking for resources to get started with syndromic surveillance? Or, maybe you want to advance your practice and build capacity around new surveillance topics? The International Society for Disease Surveillance (ISDS) Surveillance Knowledge Repository (www.surveillancerepository.org) is an online database with more than 2,000 resources related to surveillance practice. This repository houses resources of varying types including conference abstracts, journal articles, webinars, trainings, and more.
- New to Syndromic Surveillance? Try these resources to get started:
- The Syndrome Definition Library is a critical resources for anyone who is starting to develop syndrome definitions for syndromic surveillance and wants to see examples of syndromes already in use across the nation. Also, if you want to share your syndrome definitions to get feedback—in any stage of development—you can submit a syndrome to be published in the library here. Feedback from peers is invaluable.
- The Webinar Library includes more than 180 FREE webinars on topics ranging from Opioids and Overdose Surveillance to Questions about ESSENCE. Some of the most viewed webinars include:
- Opioid Surveillance Webinar Series: Parts 1, 2, and 3
- Analyze US Census Data in R with tidycensus
- ESSENCE Trainings: Queries Series (Building Queries, Using Queries, Sharing Queries)
- BioSense Platform: Introduction to SAS Studio Basics
- Looking to learn more about the impact of syndromic surveillance on the health of populations across the nation? Do you have a story of accomplishment (e.g., a successful collaboration, new partners in surveillance, or other positive event or activity) to share? Please consider sharing your story with the community, through the Stories of Surveillance in Action Library so others can benefit from your experiences. Two new stories have just been added!
- The Webinar Library includes more than 180 FREE webinars on topics ranging from Opioids and Overdose Surveillance to Questions about ESSENCE. Some of the most viewed webinars include:
NSSP Community of Practice Call
Please join the monthly NSSP CoP call. This call is powered by community members who share guidance, resources, and technical assistance. The call includes a forum for discussion and questions. The next call will be held on April 23, 2019, 3:00–4:30 PM ET. The discussion topic is Drownings & Submersion Events. Click here to register for the entire call series.
To access slides and recordings from previous calls, visit the NSSP Community of Practice Group Page.
Implementation Guide for Syndromic Surveillance
| HL7 2.5.1 Implementation Guide Milestones* | |
|---|---|
| Time Frame | Activity |
| 2015 | Completed Version 2.0 Final RELEASE** |
| 2016 | Released Erratum and Clarification Documents for Version 2.0 |
| 2017 Summer | Released Version 2.2 Working Draft for Community Comment and Consensus |
| 2017 Winter | Released Version 2.3 for Review and Community Comment |
| 2018 March | Released Version .09 |
| 2018 Spring | Submitted DRAFT HL7 Guide for Balloting: Implementation Guide for Syndromic Surveillance Release 1.0 Standard for Trial Use (STU) HL7 Version 2.5.1 |
| 2018 Fall (October–December) |
|
| 2018 November– 2019 March |
|
| 2019 February |
|
| 2019 April | Submit Request to Publish Implementation Guide as a “Standard for Trial Use” |
| 2019 Spring (April–June) | 90-day Publication of Implementation Guide to HL7 Members |
| 2019 July-August | Release to Public: HL7 2.5.1 Implementation Guide for Syndromic Surveillance for Trial Use Version 1 |
* Milestones last updated January 30, 2019.
** Version 2.0 is currently being used; subsequent versions are working drafts only.
Shaded activities have been completed.
CDC Funding Recipients and Partnership Updates
ELC Webinar Highlights Syndromic Surveillance
During a webinar held on March 20, 2019, syndromic surveillance was highlighted as a new activity that will be part of the Epidemiology and Laboratory Capacity (ELC) Health Information Systems cooperative agreement. The priorities for syndromic surveillance have not changed. Participants in the new cooperative agreement will see continued emphasis on coverage and number of facilities that transmit syndromic data to the BioSense Platform. The cooperative agreement is designed to meet the needs of public health jurisdictions while encouraging participation in the NSSP Community of Practice.
To increase the use of syndromic data and more fully integrate these data into a comprehensive surveillance system, funding recipients will need to develop at least two collaborative projects (one with a CDC program). The collaborative projects must use syndromic surveillance to meet a public health department need for surveillance data.
Funding Opportunities for Syndromic Surveillance
- The National Center for Injury Prevention and Control (NCIPC) has released the Overdose Data to Action (CDC-RFA-CE19-1904D), due May 2, 2019. This request for application builds upon the Enhanced State Opioid Overdose Surveillance (ESOOS) program. Contact your ESOOS coordinator for more information.
- Applications for the ELC competitive funding announcement (released February 28, 2019) are due May 10, 2019. Activities previously funded under NSSP will now be included under project C, Health Information Systems (HIS) capacity. Contact the ELC HIS lead for additional information.
CDC Web Resources:
Enhanced State Opioid Overdose Surveillance (ESOOS), Opioid Overdose: State Information
ESSENCE QUERIES
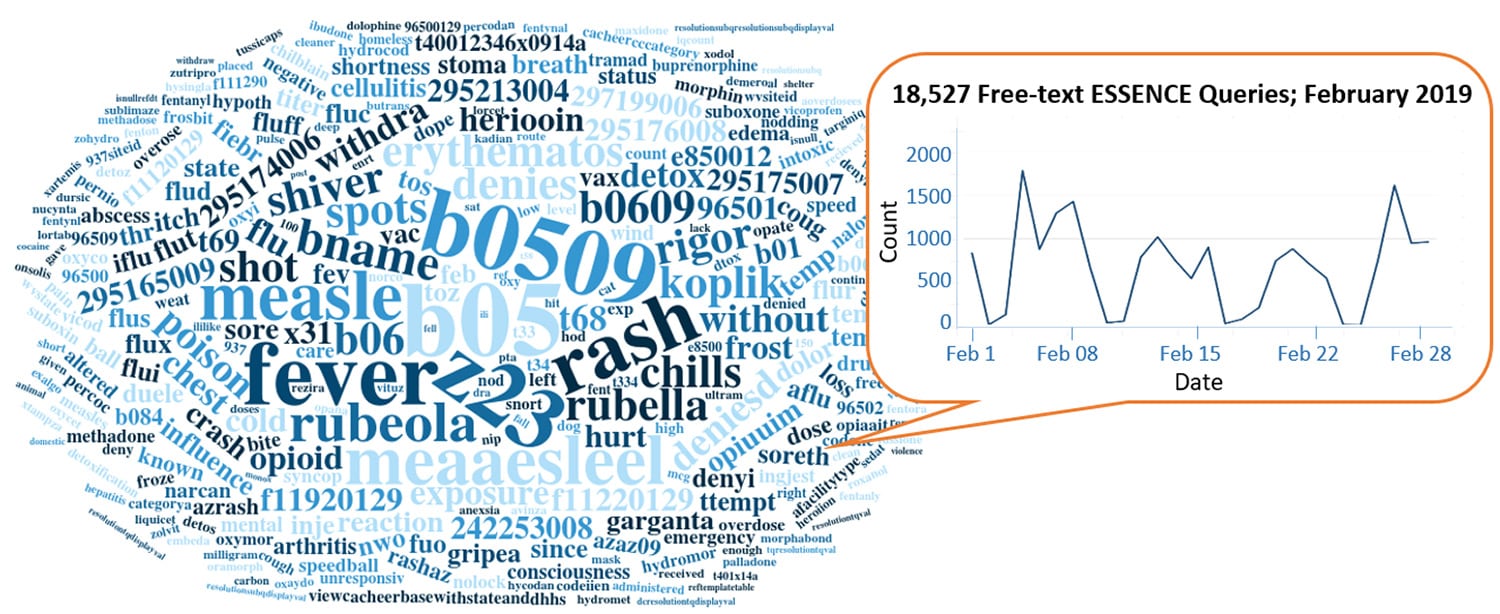
Query Terms from February 2019
A key feature of NSSP–ESSENCE is its ability to use free-text definitions across different fields to generate custom queries. The SyS community can use this feature to develop and refine category definitions and to identify and respond to public health events that may not be apparent in established categorical definitions (i.e., syndromes, subsyndromes, and Chief Complaint and Discharge Diagnosis [CCDD] categories).
This word cloud summarizes free-text and coded values that epidemiologists and data analysts queried in ESSENCE during February 2019. Only NSSP super administrators can query ESSENCE usage logs to learn what queries are run nationwide and how long they take to complete. This word cloud was generated using the Wordcloud2 package in RStudio. The relative size of the terms suggest the frequency of use in a query.
Do you enjoy seeing national-level data depicted in a word cloud? Let us know!
Practice
Data Quality Corner
Data—the foundation for making sound public health decisions—must be managed from collection through analysis and reporting. NSSP can work with sites to assess and improve data quality. Each month, NSSP provides site-specific reports on three essential and integrated measures of data quality: completeness, timeliness, and validity. Reports can be accessed in each site’s secure shared folder and are available toward the end of the month. The Data Quality Corner can help you use these reports to bolster and maintain the integrity of your site’s data quality.
Validity Conformance Changes
We heard you! You told us about your concern with the inclusion of null values in the nonconforming calculations for Validity, and we listened. Look for significant improvements to the NSSP Monthly Validity Report and NSSP Daily Onboarding Validity Report.
Previously, calculations for conforming and nonconforming statistics for validity included records with null (or missing) values in the denominator. This affected the number and percentage of records and visits shown as conforming or nonconforming to PHIN guide standards. Starting in March, we began to update the reports so that null values will be entirely separate. Null values will not affect the numerator or denominator for calculations of conformance. Only records with a reported code will be used to calculate conforming and nonconforming values. Records with null values will be presented in a separate category. This change will allow for more accurate representation of conforming and nonconforming values and percentages of valid records for coded data elements. Note. This change will apply to both monthly production reports and daily onboarding reports.
The following example illustrates how this change will affect percentage calculations:
| Old Facility_Type_Code Validity | |||
| Facility Name | Value | Records | % Records |
| Facilities | ALL_CONFORMING | 100 | 50.0% |
| A | 261QE0002X | 70 | 35.0% |
| A | 261QM2500X | 30 | 15.0% |
| Facilities | ALL_NONCONFORMING | 100 | 50.0% |
| A | $Missing | 80 | 40.0% |
| A | 102-5 | 20 | 10.0% |
| New Facility_Type_Code Validity | |||
| Facility Name | Value | Records | % Records |
| Facilities | ALL_CONFORMING | 100 | 83.33% |
| A | 261QE0002X | 70 | 58.333% |
| A | 261QM2500X | 30 | 25.0% |
| Facilities | ALL_NONCONFORMING | 20 | 16.667% |
| A | 102-5 | 20 | 16.667% |
| Facilities | ALL_Null | 80 | 100.0% |
| A | $Missing | 80 | 100.0% |
Here’s another example that illustrates the differences between Old and New Conformance calculations:
| Old Overall Conforming Calculation | |
| Numerator | 100 |
| Denominator | 200 |
| Percent | 50% |
| Old Non-Conforming Calculation | |
| Numerator | 100 |
| Denominator | 200 |
| Percent | 50% |
| New Overall Conforming Calculation | |
| Numerator | 100 |
| Denominator | 120 |
| Percent | 83.33% |
| New Non-Conforming Calculation | |
| Numerator | 20 |
| Denominator | 120 |
| Percent | 16.67% |
Race Code Validity
Multiple Races. Did you know that NSSP Data Quality Reports and ESSENCE Data Quality Dashboards were updated to account for multi-race reporting? This change was made a few months ago to accommodate instances where the visit record has more than one distinct race code for the patient and multiple race codes are transmitted in a repeating segment.
A message could have race codes for “White,” “African American,” and “Asian”—three different race codes in one visit record. When this happens, the race codes are stored in a single field, separated by semicolons. Previously, a field formatted this way would have been flagged as invalid. Now, multiple valid race codes are not flagged as invalid.
Refused to Answer. The “refused to answer” code (PHC1175) has been added to the list of valid codes. ESSENCE Data Quality Dashboards were updated to account for the additional code and the change will be reflected in the March Data Quality Reports. This is another instance where requests from the community led to improved functionality.
NSSP Updates the Data Dictionary (Version 34)
Later this month, NSSP will release version 34 of the NSSP Data Dictionary. This update includes numerous additions to ESSENCE data elements. For example, the ESSENCE tab now includes all data elements from the back-end Web database and ESSENCE Data Details fields available only in the Web application. All data types and processing descriptions of ESSENCE data elements will now be available to the user community. Also, we updated the ArchiveProcessed tab to further clarify the Travel History processing logic.
Note. We are also assessing a community request to incorporate all ESSENCE application programming interface data elements into a future version of the data dictionary.
Questions and Tips
Q: What does an ESSENCE API “request” look like?
A: In the February issue of NSSP Update, we explained that an application programming interface, or API, is a structured and consistent way for one machine (or application) to exchange information with another machine or application. You may select an API based on a query your created in the ESSENCE user-interface (six are offered) or create your own from scratch by writing it yourself. This API is the URL you would use to make a request for data from ESSENCE. The API includes query parameters and a line of code that describes how the response will be displayed. The response could be displayed as text (e.g., list of the syndromes being queried) or as tabular data, time series graph, etc.
Here’s an example of query parameters created in Table Builder that summarize counts of opioid overdoses by particular age groups, by quarter, by location where patients visited an emergency department at some time, and by facility type (emergency care). The tabular output is created with quarters in a row, geography as a nested row, and age groups as the columns.
Query Parameters

1Dec2018&startDate=1Jan2016&ccddCategory=cdc%20opioid%20overdose%20v2&geographySystem=hospital&datasource=va_hosp&detector=nodetectordetector&ageNCHS=11-14&ageNCHS=15-24&ageNCHS=25-34&ageNCHS=35-44&ageNCHS=45-54&ageNCHS=55-64&ageNCHS=65-74&ageNCHS=75-84&ageNCHS=85-1000&ageNCHS=unknown&timeResolution=quarterly&hasBeenE=1&medicalGroupingSystem=essencesyndromes&userId=455&site=885&site=914&site=908&site=890&site=934&site=930&site=902&site=912&site=925&site=936&site=894&hospFacilityType=emergency%20care&aqtTarget=TableBuilder&rowFields=timeResolution&rowFields=site&rowFields=ageNCHS&columnField=ccddCategory
You have the tools at your disposal to create an API request. The BioSense Platform hosts RStudio (including R Markdown and Shiny), which you can use to access ESSENCE data, do analyses, and create your own reports. (Contact your site administrator for access.)
Some programming knowledge is essential, but if you’ve used R before, you will find constructing the code for an ESSENCE API request to be straightforward.
Resources
R for Data Science, R Markdown: The Definitive Guide, Text Mining with R
This explanation was provided by CDC Health Scientist Aaron Kite-Powell from his presentation at the ISDS 2019 Annual Conference: How to Use RStudio with ESSENCE Application Programming Interfaces. Upcoming newsletters will include more info about APIs. Also see ESSENCE documentation on APIs (login required ).

Q: What updates were made to ESSENCE 4.0?
A: The splash screen is new. The MyEssence overview lists all MyEssence tabs in a table interface, with each including a description. The community expressed a need to keep notes, so you can now add personal notes, see tabs that have been shared and with whom, and identified managed tabs. You can also hide tabs. Note. We’re developing a Help button that will link to documentation.
Q: Are the new features to myEssence tab available in all versions of ESSENCE, or just in NSSP–ESSENCE?
A: All features can be incorporated into other (local) versions of ESSENCE.
Q: Will the creator be able to edit the name of the myEssence tab after it has been shared?
A: Yes, the creator can control the naming convention.
Q: When you run a query by week, how do you count the weeks?
A: The weeks are based on MMWR week calculation. The MMWR week is the week of the epidemiologic year for which the National Notifiable Diseases Surveillance System (NNDSS) disease report is assigned for the purposes of MMWR disease incidence reporting and publishing. When a notifiable disease case is reported to the state or local health department, it is assigned (coded) to an MMWR week.1 To see the corresponding calendar dates, visit https://ibis.health.state.nm.us/resource/MMWRWeekCalendar.html
1MMWR Week Fact Sheet [Internet]. National Notifiable Diseases Surveillance System, Division of Health Informatics and Surveillance, National Center for Surveillance, Epidemiology and Laboratory Services. Available from: http://wwwn.cdc.gov/nndss/document/MMWR_Week_overview.pdf
The preceding questions are from a webinar held on Thursday, March 4, 2019, by CDC Health Scientist Aaron Kite-Powell and Wayne Loschen of Johns Hopkins University Applied Physics Laboratory. During the 90-minute webinar, they describe new ESSENCE features and share tips and tricks. The webinar, “ESSENCE Q&A v4.0,” is posted in the Knowledge Repository.
Q: What is a syndrome definition?
A: According to Developing, Evaluating, and Disseminating Definitions for Syndromic Surveillance in Public Health Practice,1 a syndrome definition is a set of criteria that identify visits to a healthcare facility. In syndromic surveillance, the terms queries, definitions, syndromes, subsyndromes, groupings, and classifications are often used interchangeably. A syndrome definition comprises one or all of the following components:
- Discharge diagnosis codes
These standardized codes provide a method to search the clinically assigned diagnoses to capture records of interest. There are two coding systems commonly found in syndromic data: International Classification of Diseases, Clinical Modification (ICD CM) and Systematized Nomenclature of Medicine Clinical Terms (SNOMED CT). - Keywords
Terms related to the topic of interest can be used to search free text fields, such as patient chief complaint, admission reason, and triage notes to capture records. These terms may or may not be a collection of symptoms. For example, restaurant name could be a keyword. - Negations
A query may define discharge diagnosis codes or keywords that should not be identified. These are used to exclude records falsely identified with the query.
1International Society of Disease Surveillance Syndrome Definition Committee. Developing, Evaluating, and Disseminating Definitions for Syndromic Surveillance in Public Health Practice: A Guidance Document Version 1 [Internet]. 2019 Jan [cited 2019 Mar 21]. Available from: https://knowledge-repository.s3.amazonaws.com/references/SDC_Syndrome%20Definition%20Guidance%20document_FINAL.PDF
Syndrome Defintions
Getting Started with Drowning and Submersion Syndrome Definitions

Drowning ranks fifth among the leading causes of unintentional injury death in the United States, averaging 3,536 fatal unintentional non-boating drownings per year in the United States from 2005 through 2014. About 20% of these deaths occur in children 14 years of age and younger. For every child who dies from drowning, another five receive emergency department (ED) care for their submersion injuries.1
Following the process outlined in the ISDS Syndrome Definition Committee’s recently published Developing, Evaluating, and Disseminating Definitions for Syndromic Surveillance in Public Health Practice: A Guidance Document,2 this article describes how the NSSP team assessed whether drowning and submersion surveillance queries in NSSP–ESSENCE could be improved.
Background: Existing Syndromes
This work by NSSP began as a side project in 2018 to test the viability of and to improve drowning-related syndromes in NSSP–ESSENCE. At the time, the only available syndrome was the NSSP–ESSENCE Chief Complaint SubSyndrome “DrowningOrSubmersion.” This syndrome uses the Chief Complaint field, searching for one or more of the following terms: DROWN, DROWNED, DROWNING, SUBMERSION, SUBMERGE, or UNDER WATER.
This DrowningOrSubmersion ESSENCE SubSyndrome does not leverage other fields and sometimes captures a few false positives and misses true drowning or submersion visits, so there is room for improvement. Keep in mind, however, that the subsyndrome in ESSENCE captures intended ED visits quite well. In this walkthrough, we are improving upon an already successful syndrome definition.
Scope and Purpose
Improvements to the Drowning-related query are intended to supplement injury prevention work and more accurately track drowning-related injury trends. The goals are to limit false positives present in the existing subsyndrome returns and leverage other fields to increase accurate visit counts. This query should work on the nationwide de-identified NSSP–ESSENCE Chief Complaint Query Validation (CCQV) data and function in existing syndromic surveillance systems across most states and public health jurisdictions. To further encourage use, the query will be executed in the CCDD field, a concatenation of the ESSENCE-processed Chief Complaint and the Discharge Diagnosis fields.
Components
Discharge Diagnosis
- W16.__1 – W16 codes for any external cause of morbidity involving a fall, jump, or dive into specific types of water. The 1 in the 6th place of this code indicates the external cause caused drowning or submersion
- W16.[49]1X – W16 codes that end with 41X or 91X involve fall, jump, or dive into unspecified water
- Y21 – This is an event of undetermined intent code involving drowning and submersion
- X71 – Intentional self-harm by drowning and submersion
- V90 – Drowning and submersion due to accident to watercraft
- W65 – Accidental drowning and submersion while in bath-tub
- W67 – Accidental drowning and submersion while in swimming-pool
- W69 – Accidental drowning and submersion while in natural water
- W73 – Other specified cause of accident non-transport drowning and submersion
- W74 – Unspecified cause of accidental drowning and submersion
- X92 – Assault by drowning and submersion
- W22.041 – Striking against wall of swimming pool causing drowning and submersion
- V92 – Drowning and submersion due to accident on board watercraft
- T75.1 – Unspecified effects of drowning and nonfatal submersion
Note. SNOMED – SNOMED codes for drowning and submersion events have not yet been assessed for this query.
Keywords
The subsyndrome currently being used provided an excellent starting point. We looked at the two terms that have a major influence over how data returns for this syndrome: DROWN and SUBMER.
- SUBMER appears to work very well. After a quick review, we noticed some false positives but nearly all true positives.
- DROWN (when searched as a free-text query) already negates some false positives that are artifacts of the way ESSENCE’s fuzzy-matching algorithms work. These are, for example, false positives from Chief Complaints like “molar recently CROWNED” or misspelled words like “patient DROWSING from meds.” Two other negations were selected for common false positives FEEL DROWN and FELT DROWN.
Next, we reviewed CCQV data to identify other drowning-related key terms. We focused on text contained in positive visit data and other Chief Complaint text indicating possible drownings, submersion, and related location or activities.
- BOTTOM OF POOL – A lot of unintended visits are due to patients hitting their heads on the bottom of a pool. Most true positive visits already have a positive ICD-10 code. What seems to capture the rest is the code ^FOUND^BOTTOM^POOL^ or ^NOTE^BOTTOM^POOL^.
- WATER IN LUNGS – The code ^WATER^LUNG^ returns a lot of visits (878), and a quick review revealed that most are not the visit types we intend to capture. Also, the crossover between WATER^LUNGS and the identified ICD-10 is only 35 (4%) ED visits across CCQV data from January through November 2018. For reference, the term ^SUBMER^ returns 737 visits during the same period, and the crossover between these data and the ICD-10 positive visits is 363 (49%). We chose to not include this term because it pulls too many false positives, and the likelihood that a portion of true-positives will be captured by other terms and codes.
- UNRESPONSIVE IN POOL – The code ^UNRESPONSIVE^,and,^POOL^ doesn’t return many visits. After removing ICD-10-positive cases and spot checking the remaining data, about half the returned visits referred to a true “pool” accident whereas the half referred to a pool of bodily fluids. We decided not to use this term.
- UNDERWATER – The code ^Under^Water^ returns a lot of false positives. Most true positives were already picked up by the ICD-10 portion. A lower false positive count can be achieved with the code ^UNDER^WATER^,and,(,^TUB^,or,^POOL^,or,^BATH^,or,^SWIM^,or,^LAKE^,or,^POND^,or,^OCEAN^,or,^WAVE^,).
- INHALED WATER – The code ^INHALE^WATER^ appears to be working alright, but improvements were made similar to the UNDERWATER term to create ^WATER^,and,^INHAL^,and,(,^TUB^,or,^POOL^,or,^BATH^,or,^SWIM^,or,^LAKE^,or,^POND^,or,^OCEAN^,or,^WAVE^,).
- SINK – This term brings up an excessive number of bathroom sinks and is not a good term for the intent of this query.
- FOUND POOL, TUB, BATH, SWIM – A brief review of the returns for these terms showed a lot of false positives. Other than the already discussed ^FOUND^BOTTOM^POOL^ or ^NOTE^BOTTOM^POOL^, these terms were excluded.
- We encourage others to tailor this definition to the types of bodies of water in their regions. Some ideas could be assessing terms like Rocks, Logs, Rip Tides, Currents, Rivers, and Creeks.
Putting This Together…
(,^DROWN^,andnot,(,^FEEL^DROWN^,or,^FELT^DROWN^,),),or,(,(,^NOTE^,or,^FOUND^,),and,^BOTTOM^,and,^POOL^,),or,(,(,(,^UNDER^WATER^,),or,(,^WATER^,and,^INHAL^,),),and,(,^TUB^,or,^POOL^,or,^BATH^,or,^SWIM^,or,^LAKE^,or,^POND^,or,^OCEAN^,or,^WAVE^,),),or,(,^[;/ ]W16.__1^,or,^[;/ ]W22.041^,or,^[;/ ]T75.1^,or,^[;/ ]W16[0-9]_1^,or,^W16.[49]1X^,or,^W16[49]1X^,or,^[;/ ]W22041^,or,[;/ ]^T751^,or,^[;/ ]Y21^,or,^[;/ ]X71^,or,^[;/ ]V90^,or,^W6[579]^,or,^[;/ ]W7[34]^,or,^[;/ ]X92^,or,^[;/ ]V92^,)
Reviewing the Syndrome
The syndrome, with all its subsequent parts, gives an interesting seasonal trend when applied to weekly CCQV data through 2018, showing a sharp incline starting near the end of April and a peak occurring the first week of July. Following the July peak, the trend slowly declines into the winter months with a baseline of around 50 visits per week. Six separate weeks of CCQV data (Jan–Nov 2018) were randomly selected and visits manually reviewed. We selected MMWR weeks 1, 13, 17, 19, 27, and 32, and visits for the 6 weeks totaled 1,205. Of these visits, 1,156 (96%) were deemed true positives, 44 (4%) were likely false positives, and 5 visits were undetermined. There were no trends in false positive returns that lent themselves to easy negation.
From this point forward, we reached the steps in the SDC Guidance Document that advise “further refinement followed by dissemination of this query.” The feedback we receive from the community will help determine our next steps toward improving this syndrome definition. We encourage epidemiologists and data analysts in different public health jurisdictions to experiment with this preliminary work and modify the code above to suit different needs. This syndrome was developed on de-identified national data. We encourage others to tailor this definition to the types of bodies of water in their region.
Drowning and Submersion Query Results by 2018 Week and Facility HHS Region

This article about syndrome definitions was written by Senior Data Analyst Zachary Stein, a specialist in syndromic surveillance and a contributing author to the newly published Developing, Evaluating, and Disseminating Definitions for Syndromic Surveillance in Public Health Practice: A Guidance Document. Stein is an avid outdoorsman who spends a lot of time on the water and has personal experience with drowning-related scares. He believes that drowning injuries are an excellent opportunity for public health education and intervention, especially among younger populations. Injuries related to drowning are highly likely to present at an ED and are opportunities for syndromic surveillance to bolster existing public health prevention activities.
1https://www.cdc.gov/homeandrecreationalsafety/water-safety/waterinjuries-factsheet.html
Spotlight on Syndromic Surveillance Practice
This commentary published in Public Health Reports describes a partnership model between academia and public health experts who practice syndromic surveillance. Competencies in both areas advance syndromic surveillance, but without a consistent and structured collaborative approach, the achievements of each may not be widely shared and integrated into practice. This model links the expertise of researchers in academia with expertise of practitioners in public health, informatics, epidemiology, modeling, environmental health, and other fields instrumental to conducting syndromic surveillance.
Developing a Multidisciplinary Syndromic Surveillance Academic Research Program in the United Kingdom: Benefits for Public Health Surveillance1

Syndromic surveillance is recognized globally as an innovative way to capture health-related data in near real-time. England uses syndromic data to identify potential public health threats, improve situational awareness, and reassure public health officials when potential health threats are absent during mass gatherings such as Olympic and Paralympic Games.
As in the United States, protecting the public’s health is a collaborative effort. Across England, Public Health England (PHE) operates a national syndromic surveillance service from four sources: general practitioner in-hour consults, general practitioner after-hours consults, reportable sentinel emergency department visits, and calls to the National Health Service 111 nonemergency medical helpline. Findings and public health messages are published weekly.
PHE has collaborated with academia, although the authors note that at the time their article was published, PHE’s collaborations were mostly reactive, not proactive, and were relegated to requests for work on individual topics. The authors contend that practice should be linked to academia to ensure syndromic surveillance remains valid and that rigorous scientific methods are always used. To encourage broad, proactive collaborations that tap the best of academic research, syndromic surveillance practice, and interpretation of clinical data, PHE developed a partnership model that integrates expertise from each discipline.
In 2012, universities were invited to join research partnerships with PHE to work on health protection. In 2014 after this invitation, the UK National Institute for Health Research Health, which funds health care research, set up 13 Health Protection Research Units with 5-year research funding. The authors describe how a unit studying emergency preparedness and response might convene various experts to detect and characterize the health problem, identify vulnerable and affected populations, and identify response actions—all activities that can employ syndromic surveillance. The potential benefits, given the diverse expertise of people working on the project, could lead to new forecasting models and ways to use statistical techniques, new data sources, or better understanding of the behavioral reasons for seeking health care. Whatever knowledge PHE gains will improve its response to future public health events.
The authors also describe the relationship-building partnership between PHE and the University of Liverpool that promotes applied research and development. This partnership aims to translate science into practice, bring focus to research efforts, attract research funding, and demonstrate public health impact. At the time this article was published, some benefits had been observed, PhD studentships were in place, and genuine partnerships had been developed. Further, the PHE syndromic surveillance system was benefiting from the Multidisciplinary Syndromic Surveillance Academic Research Program and had plans to develop a PhD and postdoctoral training program. A key takeaway from the article is that a multidisciplinary academic research program for syndromic surveillance will likely produce specialists better qualified to support the complexities that response teams face during public health emergencies.
1Elliot AJ, Morbey R, Edeghere O, Lake IR, Colón-González FJ. Developing a Multidisciplinary Syndromic Surveillance Academic Research Program in the United Kingdom: Benefits for Public Health Surveillance. Public Health Reports [Internet]. 2017 July/August [cited 2019 Mar 14];132(1 Suppl):111S–115S. Available from: https://journals.sagepub.com/doi/pdf/10.1177/0033354917706953
Program
Technical Updates
April Updates to the AMC
- The Access & Management Center (AMC) (Release 1.4.3) will be updated mid-April to meet federal data security requirements. Contractors or foreign nationals (neither a citizen nor permanent U.S. resident) who use the BioSense Platform must be identified as such on their user profiles. Site administrators will be required to update user accounts for these two status indicators.
- AMC passwords will also be affected by the new federal guidelines.For example, Platform users will be required to make sure their passwords are 12 characters long, are not reused for 24 cycles, and are set up so that 75 percent of the characters are different from those in the previous password.
- AMC capabilities for site administrators will be expanded to include a site-specific communications checkbox. If site administrators want other Platform users to receive NSSP communications—for example, the site-specific monthly Data Quality Reports—this can be done easily by checking the communication box on each user’s profile page.
If you bookmark RStudio or Adminer application links, you’ll need to update these links on the AMC home page.
Technical Achievements
- NSSP completed the Feed Name cleanup on March 15, 2019. Feed name records in the Master Facility Table (MFT) now match the names of active feeds that transit data to the BioSense Platform.
- NSSP’s policy to deactivate facilities that fail to send data for 90 or more days went into effect last month. Some facilities were deactivated (moved to “Inactive” status on the MFT), while many data quality and feed concerns were resolved. Many thanks to the site administrators who resolved concerns and worked with the NSSP team to bring the MFT up-to-date!
- NSSP made changes to data processing so that only segments containing facility type information (e.g., observation identifier [OBX-3] = SS003^Facility/visit type) are used to populated Facility_Type_Code and Facility_Type_Description in the Archive XX_Processed tables (effective March 12, 2019).
- NSSP deployed an ESSENCE release that updates race and ethnicity reference table values on Monday, March 4, 2019 and updated the Data Quality Validity Dashboard so that “Refused to answer” is considered valid (effective March 19, 2019).
- NSSP deployed an ESSENCE release that updates race and ethnicity reference table values on Monday, March 4, 2019. The NSSP Production Data Quality Validity report will include the new race code as a valid value, starting with the March reports. Details are provided elsewhere in this issue.
Updates to Quick Start Guides Underway
The NSSP team is working on updates to the Quick Start Guide to Using SAS and Quick Start Guide to Using RStudio. More details to follow.
Current Month and Upcoming Events
| April 3 | Data Validation Conference Call, 3:00–4:00 PM ET |
| April 16 | Scheduled vendor patches in staging environment: 6:00–10:00 AM ET |
| April 18 | Scheduled vendor patches in production environment: 6:00–10:00 AM ET |
| April 23 | NSSP CoP Call; 3:00–4:30 PM ET; Topic: Drownings & Submersion Events; register here |
Last Month’s Technical Assistance
| March 6 | Held Data Validation Conference Call |
| March 19 | Applied vendor patches in staging environment |
| March 21 | Applied vendor patches in production environment |
NSSP Participation
A total of 58 sites from 47 states, including the District of Columbia, participate in NSSP. Currently, there are 4,141 facilities, including 2,766 emergency departments (ED), actively contributing data to the NSSP BioSense Platform. Data from these EDs cover about 65% of all ED visits in the country.
NSSP publishes data for ED visit coverage each quarter. These data and the coverage map shown below were updated January 2019. The calculation method is described in the December 2018 issue of NSSP Update.
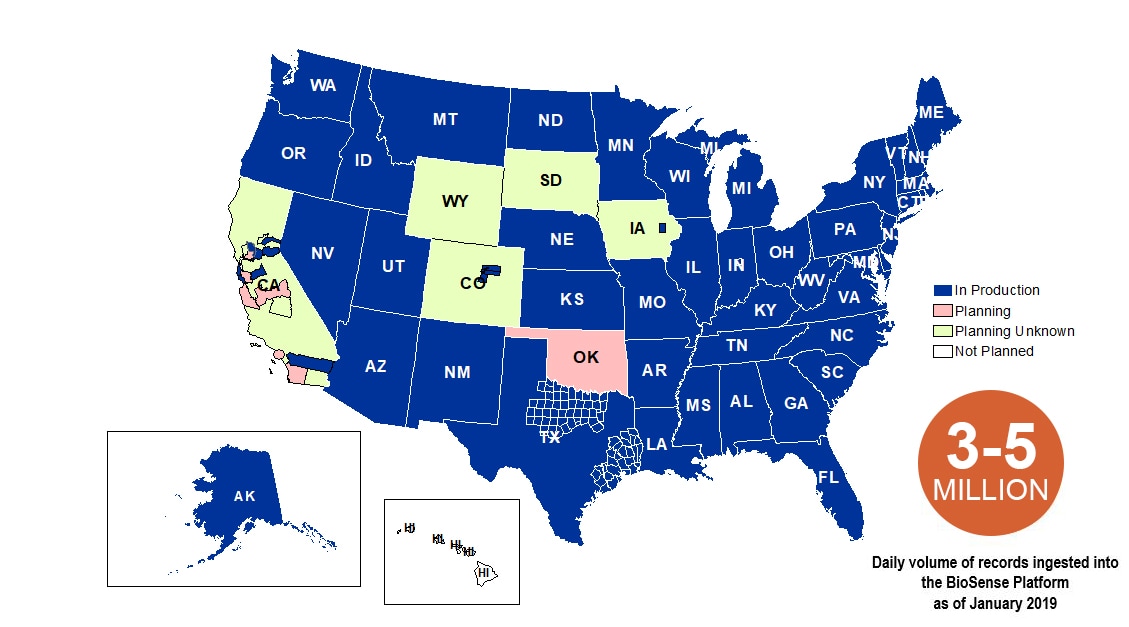
Definitions: NSSP consolidates facilities that provide data under a single data administrative authority called a site administrator. These facilities and single-site administrator constitute a site.
The community and NSSP team have put considerable effort into streamlining new-site onboarding and improving data collection, management, and reporting. NSSP now has timely, high-quality data that can be used to estimate ED visit coverage.
If you missed the article that describes the new calculation method, check out the December 2018 issue of NSSP Update.
