Inpatient Care for Septicemia or Sepsis: A Challenge for Patients and Hospitals
- Key findings
- Hospitalization rates for septicemia or sepsis more than doubled from 2000 through 2008.
- Hospitalization rates for sepsis or septicemia were similar for males and females and increased with age.
- Patients hospitalized for septicemia or sepsis were more severely ill than patients hospitalized for another diagnosis.
- Patients hospitalized for septicemia or sepsis stayed longer than other inpatients.
- Patients hospitalized for septicemia or sepsis were more than eight times as likely to die during their hospitalization.
- Summary
- Definitions
- Data source and methods
- About the authors
- References
- Suggested citation
NCHS Data Brief No. 62, June 2011
PDF Versionpdf icon (610 KB)
Margaret Jean Hall, Ph.D.; Sonja N. Williams, M.P.H.; Carol J. DeFrances, Ph.D.; and Aleksandr Golosinskiy, M.S.
Key findings
Data from the National Hospital Discharge Survey, 2008
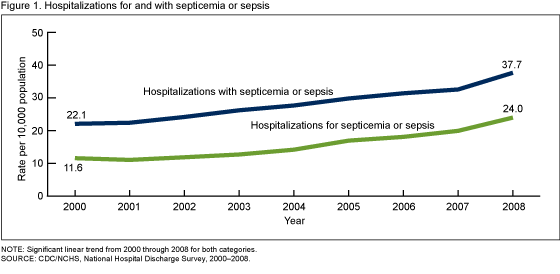
- The number and rate per 10,000 population of hospitalizations for septicemia or sepsis more than doubled from 2000 through 2008.
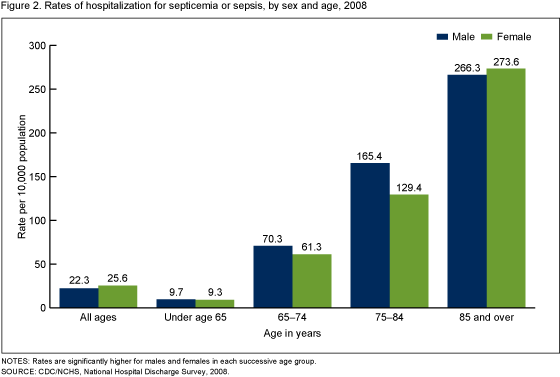
- The hospitalization rates for septicemia or sepsis in 2008 were similar for males and females and increased with age.
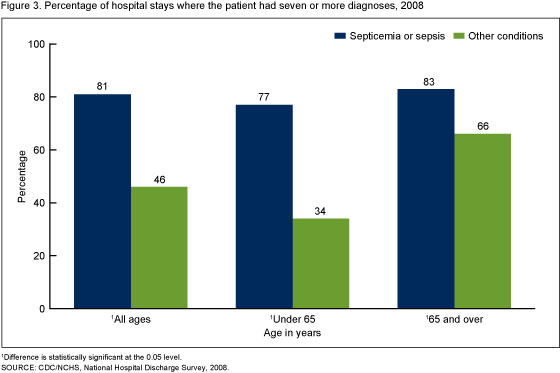
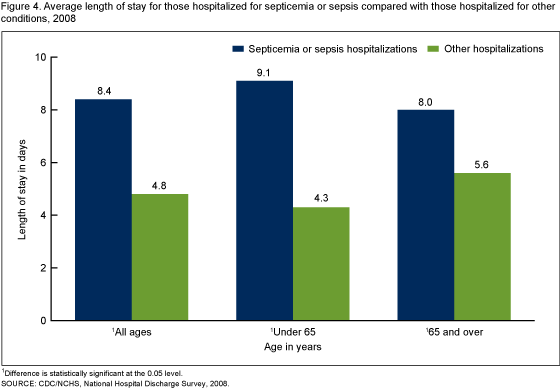
- Patients under age 65 and aged 65 and over who were hospitalized for septicemia or sepsis in 2008 were sicker and stayed longer than those hospitalized for other conditions.
- In 2008, the proportion of hospitalized patients who were discharged to other short-stay hospitals or long-term care institutions was higher for those with septicemia or sepsis (36%) than for those with other conditions (14%). Seventeen percent of septicemia or sepsis hospitalizations ended in death, whereas only 2% of other hospitalizations did.
Septicemia and sepsis are serious bloodstream infections that can rapidly become life-threatening. They arise from various infections, including those of the skin, lungs, abdomen, and urinary tract (1,2). Patients with these conditions are often treated in a hospital’s intensive care unit (3). Early aggressive treatment increases the chance of survival (4). In 2008, an estimated $14.6 billion was spent on hospitalizations for septicemia, and from 1997 through 2008, the inflation-adjusted aggregate costs for treating patients hospitalized for this condition increased on average annually by 11.9% (5).
Despite high treatment expenditures, septicemia and sepsis are often fatal (6). Those who survive severe sepsis are more likely to have permanent organ damage (7), cognitive impairment, and physical disability (8). Septicemia is a leading cause of death (9). The purpose of this report is to describe the most recent trends in care for hospital inpatients with these diagnoses.
Keywords: National Hospital Discharge Survey, hospitalization, health care utilization
Hospitalization rates for septicemia or sepsis more than doubled from 2000 through 2008.
 image icon
- Hospitalizations for septicemia or sepsis (as a first-listed or principal diagnosis) increased from 326,000 in 2000 to 727,000 in 2008, and the rate of these hospitalizations more than doubled from 11.6 per 10,000 population in 2000 to 24.0 per 10,000 population in 2008 (Figure 1). Overall hospitalizations did not increase during this period (10,11).
- Hospitalizations with septicemia or sepsis—as the first-listed, principal, or a secondary diagnosis—increased from 621,000 in 2000 to 1,141,000 in 2008, and the rate of these hospitalizations increased by 70% from 22.1 per 10,000 in 2000 to 37.7 per 10,000 in 2008 (Figure 1). This rate includes patients (a) hospitalized for septicemia or sepsis, (b) hospitalized for another diagnosis but who had septicemia or sepsis at the time they were admitted, and (c) who acquired septicemia or sepsis during their hospital stay.
Hospitalization rates for sepsis or septicemia were similar for males and females and increased with age.
 image icon
- The rate of hospitalizations for septicemia or sepsis was much higher for those aged 65 and over (122.2 per 10,000 population) than for those under age 65 (9.5 per 10,000 population).
- About two-thirds of patients hospitalized for septicemia or sepsis in 2008 were aged 65 and over and had Medicare as their expected source of payment (data not shown). This proportion has been stable over the past decade.
- The septicemia or sepsis hospitalization rate for those aged 85 and over (271.2 per 10,000 population) was about 30 times the rate for those under age 65, and was more than four times higher than the rate of 65.7 per 10,000 for the 65–74 age group (Figure 2).
Patients hospitalized for septicemia or sepsis were more severely ill than patients hospitalized for another diagnosis.
 image icon
- For patients under age 65, those hospitalized for septicemia or sepsis were more than twice as likely to have seven or more diagnoses than those hospitalized for other conditions (Figure 3).
- For those aged 65 and over, those hospitalized for septicemia or sepsis were 26% more likely to have seven or more diagnoses than those hospitalized for other conditions.
Patients hospitalized for septicemia or sepsis stayed longer than other inpatients.
- Those hospitalized for septicemia or sepsis had an average length of stay that was 75% longer than those hospitalized for other conditions (Figure 4).
- Those under age 65 hospitalized for septicemia or sepsis had an average length of stay that was more than double that of other hospitalizations.
- Those aged 65 and over hospitalized for septicemia or sepsis had an average length of stay that was 43% higher than that of other patients.
 image icon
Patients hospitalized for septicemia or sepsis were more than eight times as likely to die during their hospitalization.
Table. Hospitalizations for septicemia or sepsis compared with hospitalizations for other diagnoses, by discharge disposition, 2008
| Characteristic | Septicemia or sepsis | Other diagnoses |
|---|---|---|
| Disposition | Percent | |
| Routine1 | 39 | 79 |
| Transfer to other short-term facility1 | 6 | 3 |
| Transfer to long-term care institution1 | 30 | 10 |
| Died during the hospitalization1 | 17 | 2 |
| Other or not stated | 8 | 6 |
| Total | 100 | 100 |
1Difference is statistically significant at the 0.05 level.
SOURCE: CDC/NCHS, National Hospital Discharge Survey, 2008.
- Only 2% of hospitalizations in 2008 were for septicemia or sepsis, yet they made up 17% of in-hospital deaths (data not shown).
- In-hospital deaths were more than eight times as likely among patients hospitalized for septicemia or sepsis (17%) compared with other diagnoses (2%). In addition, those hospitalized for septicemia or sepsis were one-half as likely to be discharged home, twice as likely to be transferred to another short-term care facility, and three times as likely to be discharged to long-term care institutions, as those with other diagnoses (Table).
- For those under age 65, 13% of those hospitalized for septicemia or sepsis died in the hospital, compared with 1% of those hospitalized for other conditions (data not shown).
- For those aged 65 and over, 20% of septicemia or sepsis hospitalizations ended in death compared with 3% for other hospitalizations (data not shown).
Summary
The hospitalization rate of those with a principal diagnosis of septicemia or sepsis more than doubled from 2000 through 2008, increasing from 11.6 to 24.0 per 10,000 population. During the same period, the hospitalization rate for those with septicemia or sepsis as a principal or as a secondary diagnosis increased by 70% from 22.1 to 37.7 per 10,000 population. Reasons for these increases may include an aging population with more chronic illnesses; greater use of invasive procedures, immunosuppressive drugs, chemotherapy, and transplantation; and increasing microbial resistance to antibiotics (3,6). Increased coding of these conditions due to greater clinical awareness of septicemia or sepsis (12) may also have occurred during the period studied.
Septicemia or sepsis treatment involves caring for sicker patients who have longer inpatient stays than those with other diagnoses. Total nationwide inpatient annual costs of treating those hospitalized for septicemia have been rising and were estimated to be $14.6 billion in 2008 (5). Even with this expenditure, the death rate was high. Patients who do survive severe cases are more likely to have negative long-term effects on health and on cognitive and physical functioning (8).
The “Surviving Sepsis Campaign” was an international effort organized by physicians that developed and promoted widespread adoption of practice improvement programs grounded in evidence-based guidelines (12). The goal was to improve diagnosis and treatment of sepsis. Included among the guidelines were sepsis screening for high-risk patients; taking bacterial cultures soon after the patient arrived at the hospital; starting patients on broad-spectrum intravenous antibiotic therapy before the results of the cultures are obtained; identifying the source of infection and taking steps to control it (e.g., abscess drainage); administering intravenous fluids to correct a loss or decrease in blood volume; and maintaining glycemic (blood sugar) control (13). These and similar guidelines have been tested by a number of hospitals and have shown potential for decreasing hospital mortality due to sepsis (12).
Tracking data included in this report over time will enable policymakers and health care professionals to assess the effects of efforts to decrease disease burden and death from septicemia and sepsis in the United States.
Definitions
Septicemia or sepsis: Are referred to as bloodstream infection or blood poisoning and are so closely related that the terms have been used interchangeably in the past (14). Until October 1, 2002, both conditions were identified by a diagnosis code of 038, based on the International Classification of Diseases, Ninth Revision, Clinical Modification (ICD–9–CM) (15). After that time, new ICD–9–CM codes for sepsis (995.91) and severe sepsis (995.92) were added to this coding system making it possible to distinguish between septicemia and sepsis. To make the definitions comparable over the entire period studied in this report, it was necessary to use code 038 for all years, and codes 995.91 and 995.92 for the years after they were added. For National Hospital Discharge Survey (NHDS) data, this coding change was reflected in the data in the first full calendar year after the codes were added (2003).
Hospitalization for septicemia or sepsis: Includes those admitted with a first-listed or principal septicemia or sepsis diagnosis. In these cases, the main cause or reason for the hospitalization is one of the ICD–9–CM codes listed above in the first-listed diagnostic field.
Hospitalization with septicemia or sepsis: Includes those with one or more of the ICD–9–CM codes listed above in any of the seven diagnostic fields gathered for this survey. This includes cases in which the septicemia or sepsis is one of the following: (a) the reason for the admission (first-listed or principal), (b) present at admission but not the reason for admission, or (c) acquired while in the hospital.
Rate: Refers to the number of hospitalizations per unit of population (i.e., per 10,000 population). Using rates removes the influence of different population sizes (e.g., for males and females in one year, or of different population sizes over multiple years) so that data can be compared across these groups. For 2000–2008, rates were calculated using U.S. Census Bureau 2000-based postcensal civilian population estimates.
Data source and methods
Data for this report are from NHDS, a national probability sample survey of discharges from nonfederal short-stay hospitals or general hospitals in the United States, conducted annually by the Centers for Disease Control and Prevention’s (CDC) National Center for Health Statistics (NCHS), Division of Health Care Statistics (DHCS). NHDS uses a modified three-stage design. Units selected at the first stage consist of either hospitals or geographic areas, such as counties, groups of counties, or metropolitan statistical areas. Within a sampled geographic area, hospitals are selected. At the last stage, systematic random sampling is used to select discharges within sampled hospitals. Survey data on hospital discharges were obtained from the hospitals’ administrative data and are also used for billing purposes. These data are a very rich source of utilization information; however, administrative data do not contain in-depth clinical information and so are limited in their ability to address some medical care issues. Note that if an individual is admitted to the hospital multiple times during the survey year, that individual will be counted more than once in NHDS.
Because of the complex multistage design of NHDS, the survey data must be inflated or weighted to produce national estimates. Estimates of inpatient care presented in this report exclude newborns. More details about the design of NHDS have been published (10).
Trend data from the 2000–2008 NHDS were used for Figure 1. The other figures were based upon the recently released 2008 NHDS data.
A weighted least squares regression method (16) was used to test the significance of the time trends shown in Figure 1. Differences among the subgroups were evaluated with two-tailed t tests using p < 0.05 as the level of significance. Terms that express differences such as higher, lower, largest, smallest, leading, increased, or decreased, were only used when the differences were statistically significant. When a comparison is described as similar it means that no statistically significant difference was found. All comparisons reported in the text were statistically significant unless otherwise indicated. Comparisons presented in figures or the Table but not mentioned in the text may or may not be statistically significant. Data analyses were performed using the statistical packages SAS version 9.2 (SAS Institute, Cary, N.C.) and SUDAAN version 10.0 (Research Triangle Institute, Research Triangle Park, N.C.).
About the authors
Margaret Jean Hall, Sonja N. Williams, Carol J. DeFrances, and Aleksandr Golosinskiy are with CDC’s NCHS, DHCS.
References
- MedlinePlus Medical Encyclopedia. Septicemiaexternal icon. U.S. National Library of Medicine. National Institutes of Health.
- MedlinePlus Medical Encyclopedia. Sepsisexternal icon. U.S. National Library of Medicine. National Institutes of Health.
- National Institute of General Medical Sciences. National Institutes of Health. Sepsis fact sheetexternal icon. 2009. [Accessed 11/16/10].
- Mayo Clinic staff. Sepsis: Definitionexternal icon. Mayo Foundation for Medical Education and Research. [Accessed 11/16/10].
- Agency for Healthcare Research and Quality. HCUP facts and figures: Statistics on hospital-based care in the United States, 2008external icon.
- Angus DC, Linde-Zwirble WT, Lidicker J, Clermont G, Carcillo J, Pinsky MR. Epidemiology of severe sepsis in the United States: Analysis of incidence, outcome, and associated costs of care. Crit Care Med 29(7):1303–10. 2001.
- Chang HJ, Lynm C, Glass RM. Sepsis. JAMA 304(16):1856. 2010.
- Iwashyna TJ, Ely EW, Smith DM, Langa KM. Long-term cognitive impairment and functional disability among survivors of severe sepsis. JAMA 304(16):1787–94. 2010.
- Xu JQ, Kochanek KD, Murphy SL, Tejada-Vera B. Deaths: Final data for 2007 pdf icon[PDF – 3.4 MB]. National vital statistics reports; vol 58 no 19. Hyattsville, MD: National Center for Health Statistics. 2010.
- Hall MJ, DeFrances CJ, Williams SN, et al. National Hospital Discharge Survey: 2007 summary pdf icon[PDF – 403 KB]. National health statistics reports; no 29. Hyattsville, MD: National Center for Health Statistics. 2010.
- Unpublished data from annual National Hospital Discharge Survey data files. 2000–2008.
- Levy MM, Dellinger RP, Townsend SR, Linde-Zwirble WT, Marshall JC, Bion J, et al. The Surviving Sepsis Campaign: Results of an international guideline-based performance improvement program targeting severe sepsis. Intensive Care Med 36(2):222–31. 2010.
- Dellinger RP, Levy MM, Carlet JM, Bion J, Parker MM, Jaeschke R, et al. Surviving Sepsis Campaign: International guidelines for management of severe sepsis and septic shock: 2008. Crit Care Med 36(1):296–327. 2008. Erratum in Crit Care Med 36(4):1394–6. 2008.
- Al-Khafaji AH, Sharma S, Eschun G. Multisystem organ failure of sepsisexternal icon. EMedicine Critical Care. [Accessed 11/23/10].
- U.S. Department of Health and Human Services. Centers for Disease Control and Prevention and Centers for Medicare & Medicaid Services. Official version. International Classification of Diseases, Ninth Revision, Clinical Modification, sixth edition. DHHS Pub No. (PHS)06–1260. 2006.
- Gillum BS, Graves EJ, Kozak LJ. Trends in hospital utilization: United States, 1988–92 pdf icon[PDF – 577 KB]. National Center for Health Statistics. Vital Health Stat 13(124). 1996.
Suggested citation
Hall MJ, Williams SN, DeFrances CJ, Golosinskiy A. Inpatient care for septicemia or sepsis: A challenge for patients and hospitals. NCHS data brief, no 62. Hyattsville, MD: National Center for Health Statistics. 2011.
Copyright information
All material appearing in this report is in the public domain and may be reproduced or copied without permission; citation as to source, however, is appreciated.
National Center for Health Statistics
Edward J. Sondik, Ph.D., Director
Jennifer H. Madans, Ph.D., Associate Director for Science
Division of Health Care Statistics
Jane E. Sisk, Ph.D., Director