Mortality in the United States, 2020
NCHS Data Brief No. 427, December 2021
PDF Versionpdf icon (402 KB)
Sherry L. Murphy, B.S., Kenneth D. Kochanek, M.A., Jiaquan Xu, M.D., and Elizabeth Arias, Ph.D.
- Key findings
- How long can we expect to live?
- What are the age-adjusted death rates for race-ethnicity-sex groups?
- Did age-specific death rates in 2020 change from 2019 for those aged 1 year and over?
- What are the death rates for the 10 leading causes of death?
- What are the mortality rates for the 10 leading causes of infant death?
Data from the National Vital Statistics System
- Life expectancy for the U.S. population in 2020 was 77.0 years, a decrease of 1.8 years from 2019.
- The age-adjusted death rate increased by 16.8% from 715.2 deaths per 100,000 standard population in 2019 to 835.4 in 2020.
- Age-specific death rates increased from 2019 to 2020 for each age group 15 years and over.
- Nine of the 10 leading causes of death in 2020 remained the same as in 2019, although 5 causes switched rank; heart disease and cancer remained the top 2 leading causes, and COVID-19 became the third leading cause of death in 2020.
- The infant mortality rate decreased 2.9% in 2020 from 2019 to a record low of 541.9 infant deaths per 100,000 live births.
This report presents final 2020 U.S. mortality data on deaths and death rates by demographic and medical characteristics. These data provide information on mortality patterns in U.S. residents by variables such as sex, age, race and Hispanic origin, and cause of death. Life expectancy estimates, age-adjusted death rates, age-specific death rates, 10 leading causes of death, and 10 leading causes of infant death were analyzed by comparing 2020 and 2019 final data (1).
Keywords: life expectancy, leading cause, National Vital Statistics System
How long can we expect to live?
In 2020, life expectancy at birth was 77.0 years for the total U.S. population—a decrease of 1.8 years from 78.8 years in 2019 (Figure 1). For males, life expectancy decreased 2.1 years from 76.3 in 2019 to 74.2 in 2020. For females, life expectancy decreased 1.5 years from 81.4 in 2019 to 79.9 in 2020.
In 2020, the difference in life expectancy between females and males was 5.7 years, an increase of 0.6 year from 2019.
In 2020, life expectancy at age 65 for the total population was 18.5 years, a decrease of 1.1 years from 2019. For males, life expectancy at age 65 decreased 1.2 years from 18.2 in 2019 to 17.0 in 2020. For females, life expectancy at age 65 decreased 1.0 year from 20.8 in 2019 to 19.8 in 2020. The difference in life expectancy at age 65 between females and males increased 0.2 year, from 2.6 years in 2019 to 2.8 in 2020.
Figure 1. Life expectancy at birth and age 65, by sex: United States, 2019 and 2020
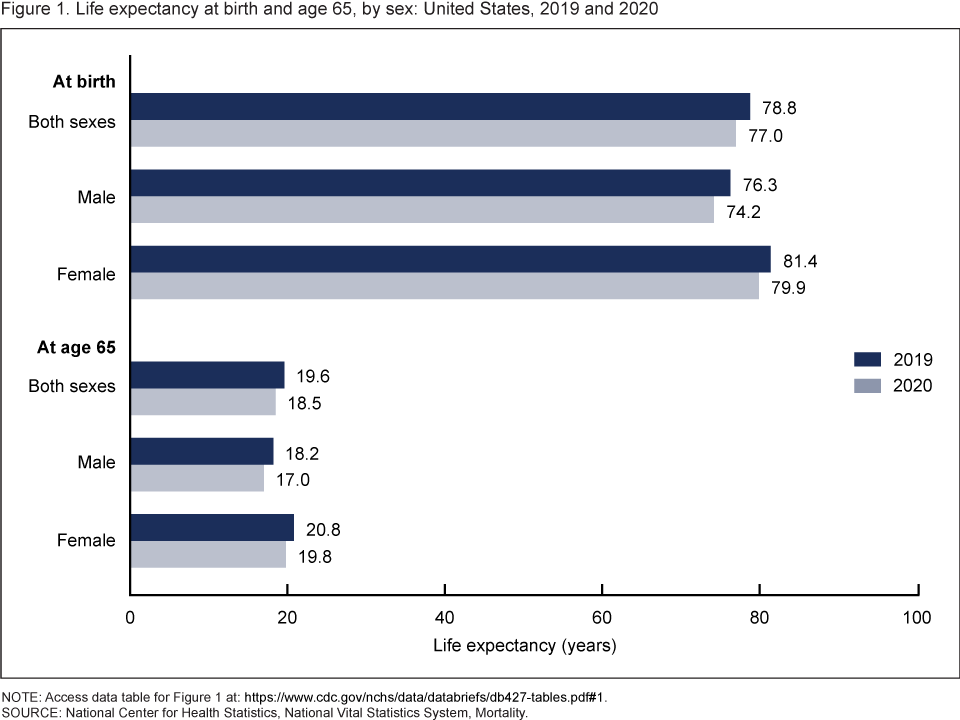 image icon
NOTE: Access data table for Figure 1pdf icon.
SOURCE: National Center for Health Statistics, National Vital Statistics System, Mortality.
What are the age-adjusted death rates for race-ethnicity-sex groups?
The age-adjusted death rate for the total population increased 16.8% from 715.2 per 100,000 standard population in 2019 to 835.4 in 2020 (Figure 2). Age-adjusted death rates increased in 2020 from 2019 for all race-ethnicity-sex groups, increasing 42.7% for Hispanic males, 32.4% for Hispanic females, 28.0% for non-Hispanic Black males, 24.9% for non-Hispanic Black females, 13.4% for non-Hispanic White males, and 12.1% for non-Hispanic White females.
Figure 2. Age-adjusted death rates, by sex and race and ethnicity: United States, 2019 and 2020
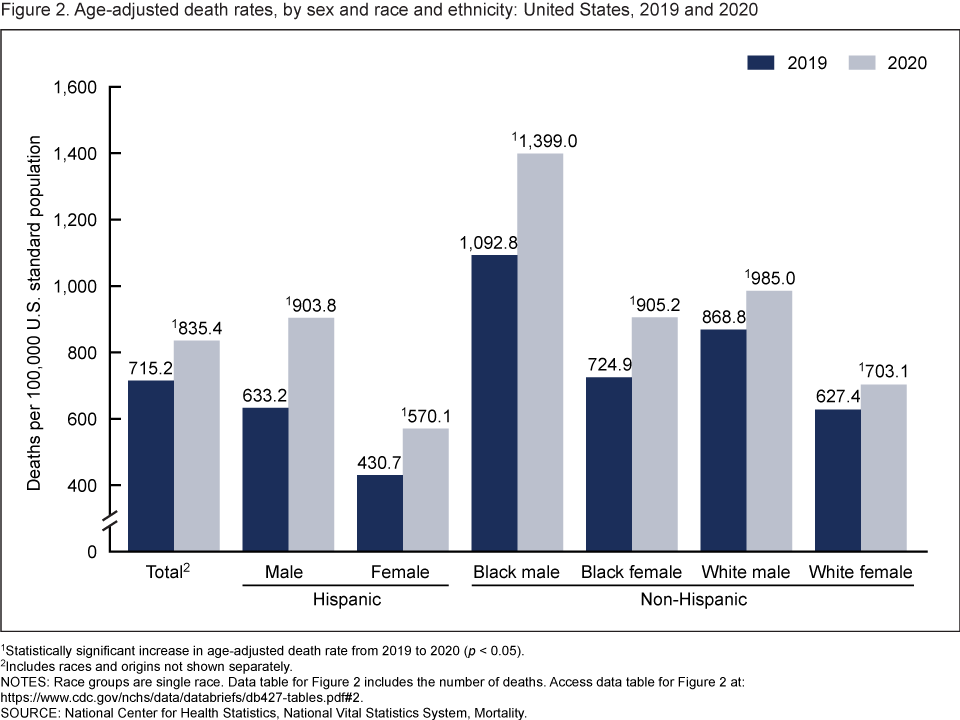 image icon
1Statistically significant increase in age-adjusted death rate from 2019 to 2020 (p < 0.05).
2Includes races and origins not shown separately.
NOTES: Race groups are single race. Data table for Figure 2 includes the number of deaths. Access data table for Figure 2pdf icon.
SOURCE: National Center for Health Statistics, National Vital Statistics System, Mortality.
Did age-specific death rates in 2020 change from 2019 for those aged 1 year and over?
From 2019 to 2020, death rates increased for each age group 15 years and over. Rates increased 20.8% for age group 15–24 (from 69.7 deaths per 100,000 population in 2019 to 84.2 in 2020), 23.8% for 25–34 (128.8 to 159.5), 24.5% for 35–44 (199.2 to 248.0), 20.7% for 45–54 (392.4 to 473.5), 17.6% for 55–64 (883.3 to 1,038.9), 17.4% for 65–74 (1,764.6 to 2,072.3), 16.0% for 75–84 (4,308.3 to 4,997.0), and 15.0% for 85 and over (13,228.6 to 15,210.9) (Figure 3). Rates for age groups 1–4 and 5–14 did not change significantly from 2019 to 2020.
Figure 3. Death rates for ages 1 year and over: United States, 2019 and 2020
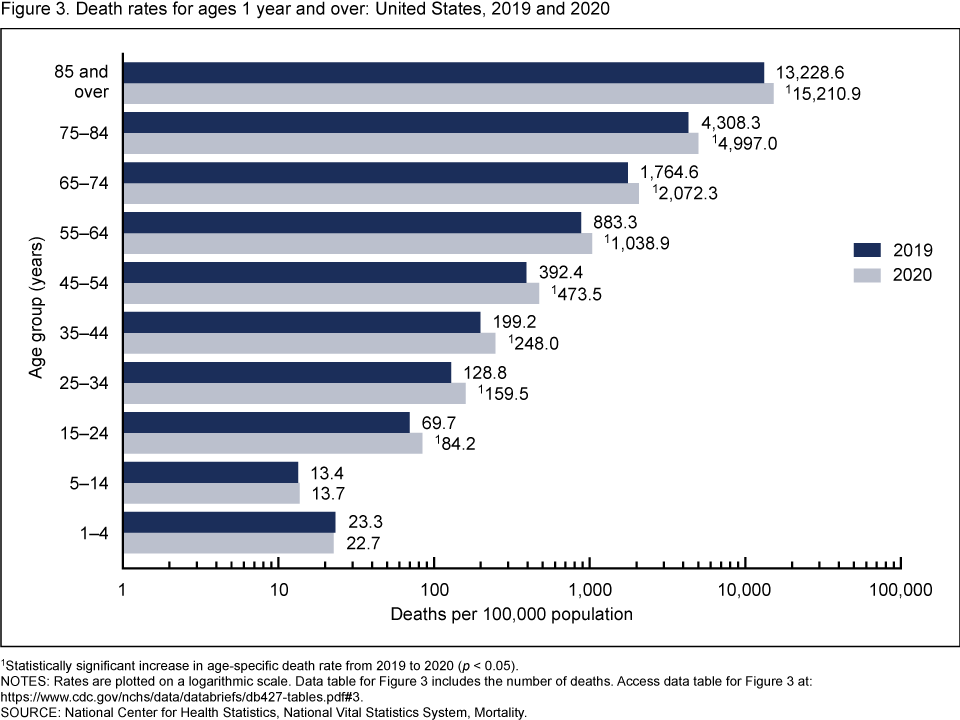 image icon
1Statistically significant increase in age-specific death rate from 2019 to 2020 (p < 0.05).
NOTES: Rates are plotted on a logarithmic scale. Data table for Figure 3 includes the number of deaths. Access data table for Figure 3pdf icon.
SOURCE: National Center for Health Statistics, National Vital Statistics System, Mortality.
What are the death rates for the 10 leading causes of death?
In 2020, 9 of the 10 leading causes of death remained the same as in 2019. The top leading cause was heart disease, followed by cancer (Figure 4). COVID-19, newly added as a cause of death in 2020, became the 3rd leading cause of death. Of the remaining leading causes in 2020 (unintentional injuries, stroke, chronic lower respiratory diseases, Alzheimer disease, diabetes, influenza and pneumonia, and kidney disease), 5 causes changed ranks from 2019. Unintentional injuries, the 3rd leading cause in 2019, became the 4th leading cause in 2020. Chronic lower respiratory diseases, the 4th leading cause in 2019, became the 6th. Alzheimer disease, the 6th leading cause in 2019, became the 7th. Diabetes, the 7th leading cause in 2019, became the 8th. Kidney disease, the 8th leading cause in 2019, became the 10th leading cause in 2020. Stroke, and influenza and pneumonia, remained the 5th and 9th leading causes, respectively (1). Suicide dropped from the list of 10 leading causes in 2020. Causes of death are ranked according to number of deaths (1). The 10 leading causes accounted for 74.1% of all deaths in the United States in 2020.
From 2019 to 2020, age-adjusted death rates increased for 6 of 10 leading causes of death and decreased for 2. The rate increased 4.1% for heart disease (from 161.5 in 2019 to 168.2 in 2020), 16.8% for unintentional injuries (49.3 to 57.6), 4.9% for stroke (37.0 to 38.8), 8.7% for Alzheimer disease (29.8 to 32.4), 14.8% for diabetes (21.6 to 24.8), and 5.7% for influenza and pneumonia (12.3 to 13.0). Rates decreased 1.4% for cancer (146.2 to 144.1) and 4.7% for chronic lower respiratory diseases (38.2 to 36.4). The rate for kidney disease remained unchanged.
Data comparisons from 2019 to 2020 for COVID-19 are not applicable because COVID-19 was a new cause in 2020.
Figure 4. Age-adjusted death rates for the 10 leading causes of death in 2020: United States, 2019 and 2020
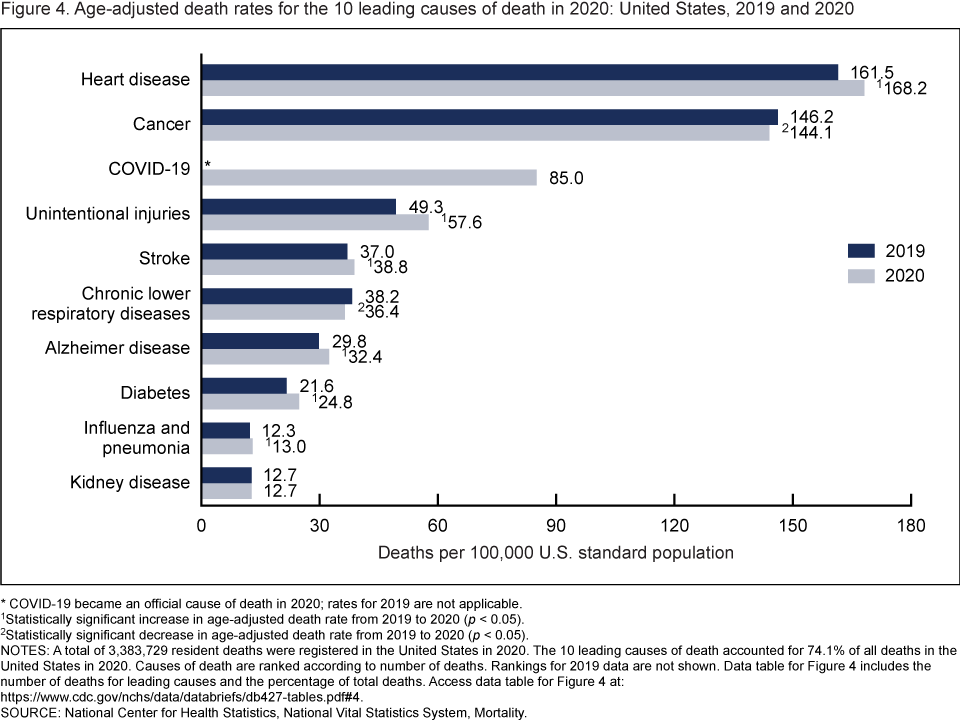 image icon
*COVID-19 became an official cause of death in 2020; rates for 2019 are not applicable.
1Statistically significant increase in age-adjusted death rate from 2019 to 2020 (p < 0.05).
2Statistically significant decrease in age-adjusted death rate from 2019 to 2020 (p < 0.05).
NOTES: A total of 3,383,729 resident deaths were registered in the United States in 2020. The 10 leading causes of death accounted for 74.1% of all deaths in the United States in 2020. Causes of death are ranked according to number of deaths. Rankings for 2019 data are not shown. Data table for Figure 4 includes the number of deaths for leading causes and the percentage of total deaths. Access data table for Figure 4pdf icon.
SOURCE: National Center for Health Statistics, National Vital Statistics System, Mortality.
What are the mortality rates for the 10 leading causes of infant death?
The infant mortality rate (IMR) is the ratio of infant deaths to live births in a given year. The IMR declined 2.9% from 558.3 infant deaths per 100,000 live births in 2019 to 541.9 in 2020.
Causes of infant death are ranked according to number of infant deaths (1). The 10 leading causes of infant death in 2020 (congenital malformations, low birth weight, sudden infant death syndrome, unintentional injuries, maternal complications, cord and placental complications, bacterial sepsis of newborn, respiratory distress of newborn, diseases of the circulatory system, and neonatal hemorrhage) accounted for 67.5% of all infant deaths in the United States. Two of the leading causes of infant death exchanged ranks from 2019 to 2020 (Figure 5). Sudden infant death syndrome, the 4th leading cause in 2019, became the 3rd leading cause in 2020, while unintentional injuries, the 3rd leading cause in 2019, became the 4th leading cause in 2020. Necrotizing enterocolitis of newborn, the 10th leading cause in 2019, dropped from the list and was replaced by neonatal hemorrhage in 2020. The IMR for sudden infant death syndrome increased 15.3% from 33.3 in 2019 to 38.4 in 2020. The IMR for low birth weight decreased 5.4% from 91.9 in 2019 to 86.9 in 2020. Mortality rates for other leading causes of infant death did not change significantly.
Figure 5. Infant mortality rates for the 10 leading causes of infant death in 2020: United States, 2019 and 2020
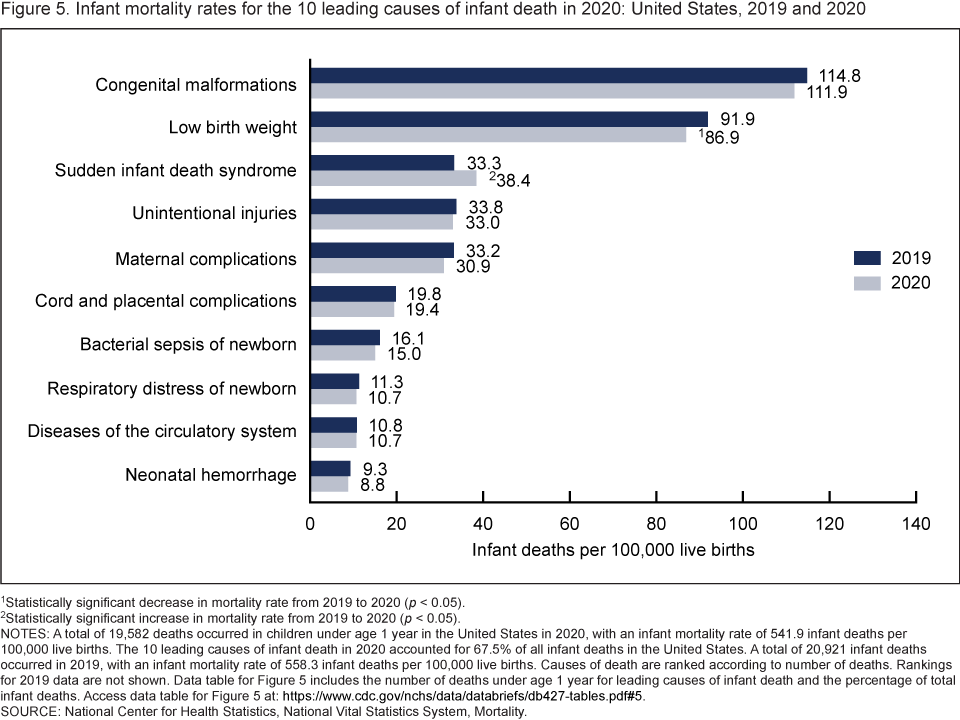 image icon
1Statistically significant decrease in mortality rate from 2019 to 2020 (p < 0.05).
2Statistically significant increase in mortality rate from 2019 to 2020 (p < 0.05).
NOTES: A total of 19,582 deaths occurred in children under age 1 year in the United States in 2020, with an infant mortality rate of 541.9 infant deaths per 100,000 live births. The 10 leading causes of infant death in 2020 accounted for 67.5% of all infant deaths in the United States. A total of 20,921 infant deaths occurred in 2019, with an infant mortality rate of 558.3 infant deaths per 100,000 live births. Causes of death are ranked according to number of deaths. Rankings for 2019 data are not shown. Data table for Figure 5 includes the number of deaths under age 1 year for leading causes of infant death and the percentage of total infant deaths. Access data table for Figure 5pdf icon.
SOURCE: National Center for Health Statistics, National Vital Statistics System, Mortality.
Summary
In 2020, a total of 3,383,729 resident deaths were registered in the United States—528,891 more deaths than in 2019. The number of deaths for which COVID-19 was the underlying cause of death was 350,831 (10.4% of the total number of deaths in 2020). From 2019 to 2020, the age-adjusted death rate for the total population increased 16.8%. This single-year increase is the largest since the first year that annual mortality data for the entire United States became available (2). The decrease in life expectancy for the total population of 1.8 years from 2019 to 2020 is the largest single-year decrease in more than 75 years (3). Age-specific death rates from 2019 to 2020 increased for each age group 15 years and over. Age-adjusted death rates increased in 2020 from 2019 for each race and ethnicity group for both males and females.
Of the 10 leading causes of death in 2020, 9 remained the same as in 2019, although 5 causes exchanged ranks. Heart disease was the leading cause followed by cancer. COVID-19, a new cause of death in 2020, was the third leading cause. Age-adjusted death rates increased for 6 leading causes and decreased for 2. Life expectancy at birth decreased 1.8 years from 78.8 years in 2019 to 77.0 in 2020, largely because of increases in mortality due to COVID-19, unintentional injuries, heart disease, homicide, and diabetes.
In 2020, a total of 19,582 deaths occurred in children under age 1 year, which was 1,339 fewer infant deaths than in 2019. The IMR decreased 2.9% from 558.3 infant deaths per 100,000 live births in 2019 to 541.9 in 2020. Among the 10 leading causes of infant death, the IMR increased for 1 cause (sudden infant death syndrome) and decreased for 1 (low birth weight).
Data and findings in this report are based on final mortality data and may differ from provisional data and findings previously published.
Definitions
Cause of death: Based on medical information—including injury diagnoses and external causes of injury—entered on death certificates filed in the United States. This information is classified and coded in accordance with the International Statistical Classification of Diseases and Related Health Problems, 10th Revision (ICD–10) (4).
Death rates: For 2020, based on population estimates for July 1, 2020, that are consistent with the April 1, 2010, census. These population estimates (as well as population figures for the 2010 census) are available on the CDC WONDER website (5). Age-adjusted death rates are useful when comparing different populations because they remove the potential bias that can occur when the populations being compared have different age structures. The National Center for Health Statistics (NCHS) uses the direct method of standardization; see Technical Notes of “Deaths: Final Data for 2019” (1) for more information.
Infant mortality rate (IMR): Computed by dividing the number of infant deaths in a calendar year by the number of live births registered for that same time period. IMR is the most widely used index for measuring the risk of dying during the first year of life.
Leading causes of death: Ranked according to the number of deaths assigned to rankable causes (6). COVID-19 was added to the list of rankable causes in 2020.
Life expectancy: The expected average number of years of life remaining at a given age. It is denoted by ex, which means the average number of subsequent years of life for someone now aged x. Life expectancy estimates for 2020 are based on a methodology first implemented with 2008 final mortality data (7). Life expectancies for 2019 and 2020 are estimated using final Medicare data.
Data source and methods
The data shown in this report reflect information collected by NCHS for 2019 and 2020 from death certificates filed in all 50 states and the District of Columbia and compiled into national data known as the National Vital Statistics System. Death rates shown in this report are calculated based on postcensal population estimates as of July 1, 2019, and July 1, 2020, which are consistent with the April 1, 2010, census. Differences between death rates were evaluated using a two-tailed z test.
The race and Hispanic-origin groups shown in this report follow the 1997 Office of Management and Budget standards and differ from the bridged-race categories shown in reports for data years prior to 2019 (1).
About the authors
Sherry L. Murphy, Kenneth D. Kochanek, Jiaquan Xu, and Elizabeth Arias are with the National Center for Health Statistics, Division of Vital Statistics.
References
- Xu JQ, Murphy SL, Kochanek KD, Arias E. Deaths: Final data for 2019.pdf icon National Vital Statistics Reports; vol 70 no 8. Hyattsville, MD: National Center for Health Statistics. 2021.
- National Center for Health Statistics, National Vital Statistics System. Deaths for selected causes by 10-year age groups, race, and sex: Death registration states, 1900–32, and United States, 1933–98.
- Arias E, Xu JQ. United States life tables, 2018pdf icon. National Vital Statistics Reports; vol 69 no 12. Hyattsville, MD: National Center for Health Statistics. 2020.
- World Health Organization. International statistical classification of diseases and related health problems, 10th revision (ICD–10). 5th ed. Geneva, Switzerland. 2016.
- Centers for Disease Control and Prevention. CDC WONDER. Single-race population estimates, 2010–2020.
- Heron M. Deaths: Leading causes for 2019pdf icon. National Vital Statistics Reports; vol 70 no 9. Hyattsville, MD: National Center for Health Statistics. 2021.
- Arias E. United States life tables, 2008pdf icon. National Vital Statistics Reports; vol 61 no 3. Hyattsville, MD: National Center for Health Statistics. 2012.
Suggested citation
Murphy SL, Kochanek KD, Xu JQ, Arias E. Mortality in the United States, 2020. NCHS Data Brief, no 427. Hyattsville, MD: National Center for Health Statistics. 2021. DOI: https://dx.doi.org/10.15620/cdc:112079external icon.
Copyright information
All material appearing in this report is in the public domain and may be reproduced or copied without permission; citation as to source, however, is appreciated.
National Center for Health Statistics
Brian C. Moyer, Ph.D., Director
Amy M. Branum, Ph.D., Associate Director for Science
Division of Analysis and Epidemiology
Steven Schwartz, Ph.D., Director
Isabelle Horon, Dr.P.H., Acting Director for Science