Back, Lower Limb, and Upper Limb Pain Among U.S. Adults, 2019
NCHS Data Brief No. 415, July 2021
PDF Versionpdf icon (460KB)
- Key findings
- The percentage of adults aged 18 and over experiencing pain in the past 3 months varied by body region.
- The percentage of adults aged 18 and over with back pain differed by demographic characteristics.
- The percentage of adults aged 18 and over with lower limb pain was highest among adults aged 65 and over.
- The percentage of adults aged 18 and over with upper limb pain decreased as family income as a percentage of FPL increased.
- Summary
Data from the National Health Interview Survey
- In 2019, 39.0% of adults had back pain, 36.5% had lower limb pain, and 30.7% had upper limb pain in the past 3 months.
- Adults aged 65 and over, women, non-Hispanic white adults, and those with income below 100% of the federal poverty level (FPL) were most likely to experience back pain.
- Adults aged 18–29 (21.0%), men (33.5%), non-Hispanic Asian adults (20.6%), and those with income 200% of FPL or above (35.2%) were least likely to experience lower limb pain.
- Adults aged 65 and over, women, non-Hispanic white adults, and those with income below 100% of FPL were most likely to experience upper limb pain.
Location-specific pain, such as back, neck, arm, and hip pain is associated with short- and long-term health effects, ranging from minor discomfort to musculoskeletal impairment (1), diminished quality of life (2), and escalating health care costs (3). Existing studies of location-specific pain are mostly limited to small or special populations with limited generalizability (4–6). This report provides national estimates of any pain regardless of body region as well as estimates of back, lower limb (hips, knees, or feet), and upper limb (hands, arms, or shoulders) pain in the past 3 months among U.S. adults aged 18 and over by selected sociodemographic characteristics.
Keywords: health status disparities, poverty, National Health Interview Survey
The percentage of adults aged 18 and over experiencing pain in the past 3 months varied by body region.
- Overall, 58.9% of adults experienced pain of any kind in the past 3 months (Figure 1).
- Back pain (39.0%) was the most prevalent site for pain, followed by lower limb (36.5%); upper limb (30.7%); headache or migraine (22.4%); abdominal, pelvic, or genital (9.8%); and tooth or jaw (9.2%).
Figure 1. Percentage of adults aged 18 and over with any pain and pain by body region in the past 3 months: United States, 2019
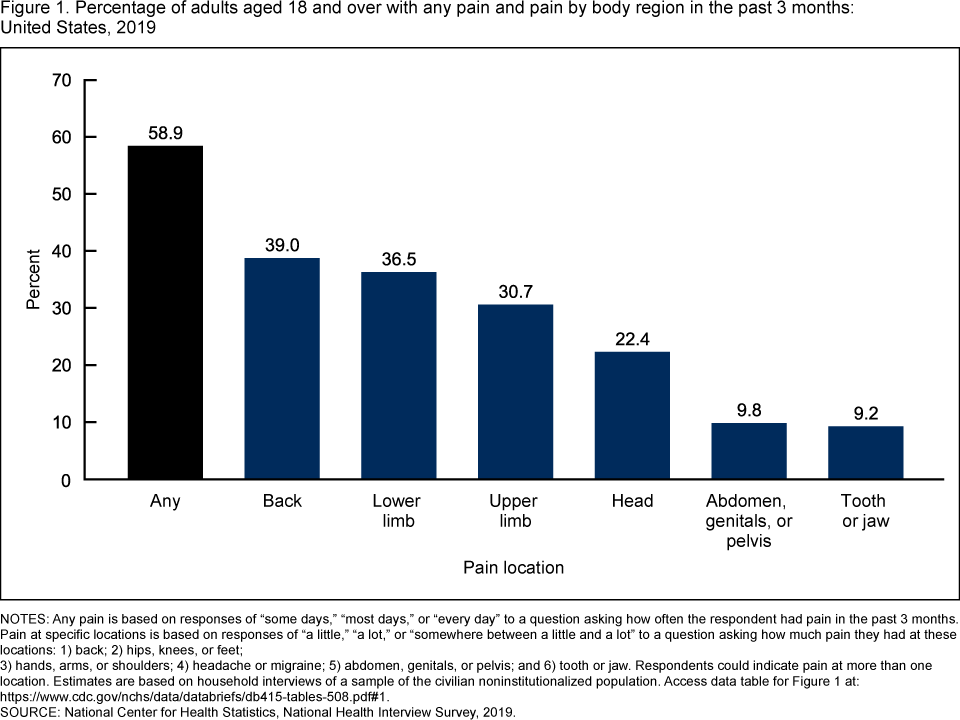 image icon
NOTES: Any pain is based on responses of “some days,” “most days,” or “every day” to a question asking how often the respondent had pain in the past 3 months. Pain at specific locations is based on responses of “a little,” “a lot,” or “somewhere between a little and a lot” to a question asking how much pain they had at these locations: 1) back; 2) hips, knees, or feet; 3) hands, arms, or shoulders; 4) headache or migraine; 5) abdomen, genitals, or pelvis; and 6) tooth or jaw. Respondents could indicate pain at more than one location. Estimates are based on household interviews of a sample of the civilian noninstitutionalized population. Access data table for Figure 1pdf icon.
SOURCE: National Center for Health Statistics, National Health Interview Survey, 2019.
The percentage of adults aged 18 and over with back pain differed by demographic characteristics.
- The percentage of adults with back pain increased with age, from 28.4% for those aged 18–29 and 35.2% for those aged 30–44 to 44.3% for those aged 45–64 and 45.6% for those aged 65 and over (Figure 2).
- Women (40.6%) were more likely to experience back pain than men (37.2%).
- Estimates of back pain differed among non-Hispanic white (42.7%), non-Hispanic black (35.8%), Hispanic (31.2%), and non-Hispanic Asian (24.5%) adults.
- The percentage of adults with back pain decreased as family income increased, from 44.8% in adults with income less than 100% of the federal poverty level (FPL) to 37.6% in adults with income 200% or more of FPL.
Figure 2. Percentage of adults aged 18 and over who had back pain in the past 3 months, by age, sex, race and Hispanic origin, and family income as a percentage of the federal poverty level: United States, 2019
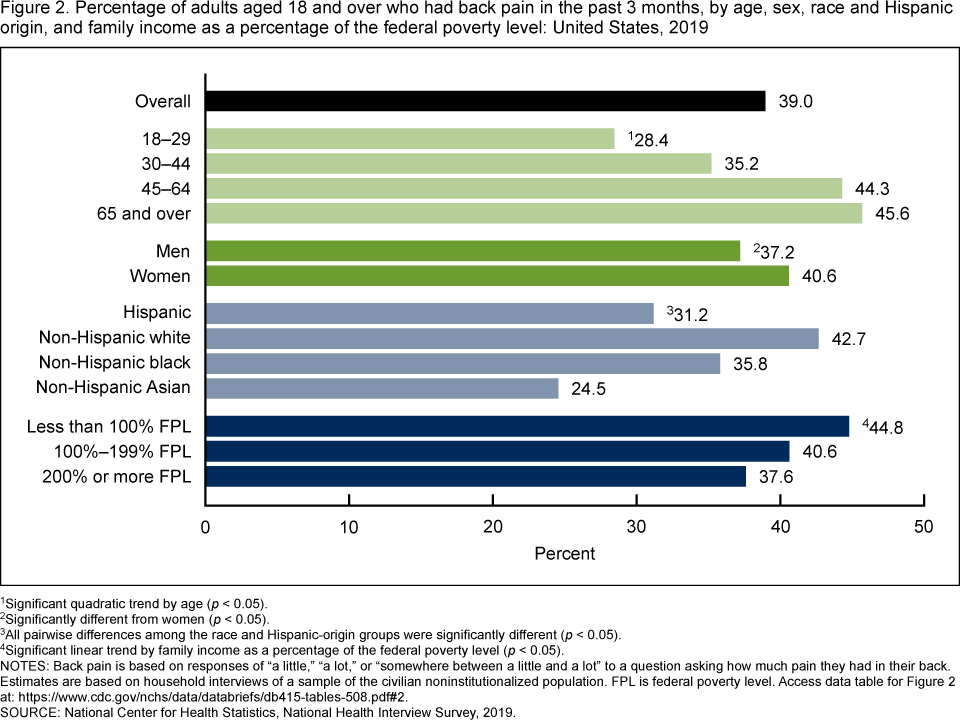 image icon
1Significant quadratic trend by age (p < 0.05).
2Significantly different from women (p < 0.05).
3All pairwise differences among the race and Hispanic-origin groups were significantly different (p < 0.05).
4Significant linear trend by family income as a percentage of the federal poverty level (p < 0.05)
NOTES: Back pain is based on responses of “a little,” “a lot,” or “somewhere between a little and a lot” to a question asking how much pain they had in their back. Estimates are based on household interviews of a sample of the civilian noninstitutionalized population. FPL is federal poverty level. Access data table for Figure 2pdf icon.
SOURCE: National Center for Health Statistics, National Health Interview Survey, 2019.
The percentage of adults aged 18 and over with lower limb pain was highest among adults aged 65 and over.
- The percentage of adults with lower limb pain increased with age, from 21.0% for those aged 18–29 and 28.8% for those aged 30–44 to 43.4% for those aged 45–64 and 50.3% for those aged 65 and over (Figure 3).
- Estimates of lower limb pain differed among non-Hispanic white (40.1%), non-Hispanic black (36.6%), Hispanic (27.4%), and non-Hispanic Asian (20.6%) adults.
- The percentage of adults with lower limb pain decreased as family income increased, from 42.1% in adults with income less than 100% of FPL to 35.2% in adults with income 200% or more of FPL.
Figure 3. Percentage of adults aged 18 and over with pain in the hips, knees, or feet (lower limbs) in the past 3 months, by age, sex, race and Hispanic origin, and family income as a percentage of the federal poverty level: United States, 2019
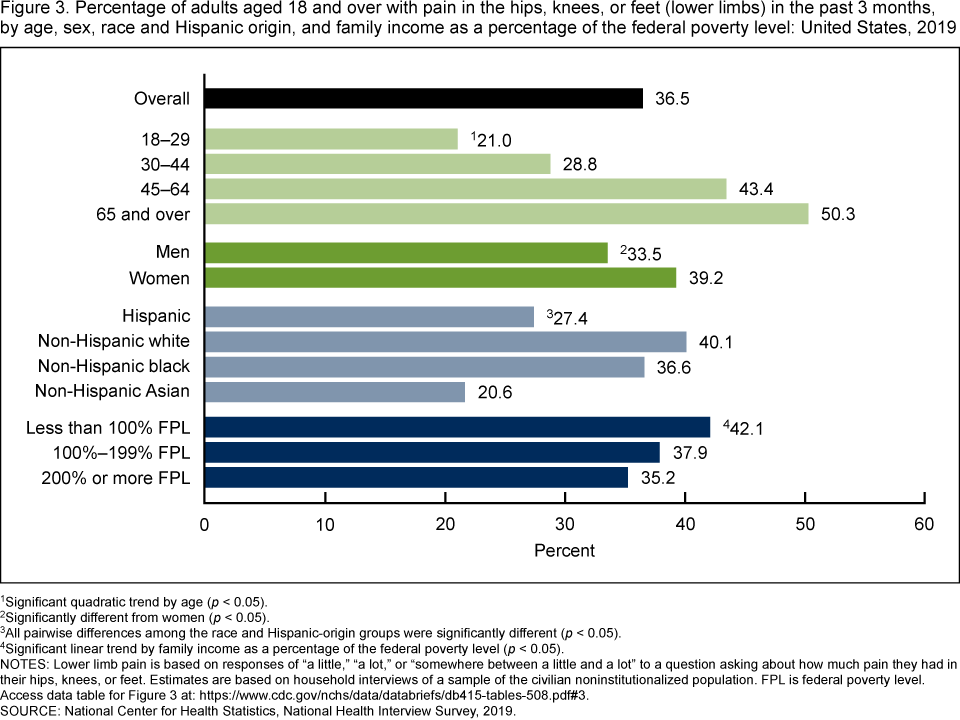 image icon
1Significant quadratic trend by age (p < 0.05).
2Significantly different from women (p < 0.05).
3All pairwise differences among the race and Hispanic-origin groups were significantly different (p < 0.05).
4Significant linear trend by family income as a percentage of the federal poverty level (p < 0.05)
NOTES: Lower limb pain is based on responses of “a little,” “a lot,” or “somewhere between a little and a lot” to a question asking about how much pain they had in their hips, knees, or feet. Estimates are based on household interviews of a sample of the civilian noninstitutionalized population. FPL is federal poverty level. Access data table for Figure 3pdf icon.
SOURCE: National Center for Health Statistics, National Health Interview Survey, 2019.
The percentage of adults aged 18 and over with upper limb pain decreased as family income as a percentage of FPL increased.
- The percentage of adults with upper limb pain increased with age, from 16.2% for those aged 18–29 and 24.1% for those aged 30–44 to 37.9% for those aged 45–64 and 42.0% for those aged 65 and over (Figure 4).
- Estimates of upper limb pain differed among non-Hispanic white (33.4%), non-Hispanic black (28.6%), Hispanic (24.4%), and non-Hispanic Asian (21.0%) adults.
- The percentage of adults with upper limb pain decreased as family income increased, from 37.1% in adults with income less than 100% of FPL to 29.1% in adults with income 200% or more of FPL.
Figure 4. Percentage of adults aged 18 and over with pain in the hands, arms, or shoulders (upper limbs) in the past 3 months, by age, sex, race and Hispanic origin, and family income as a percentage of the federal poverty level: United States, 2019
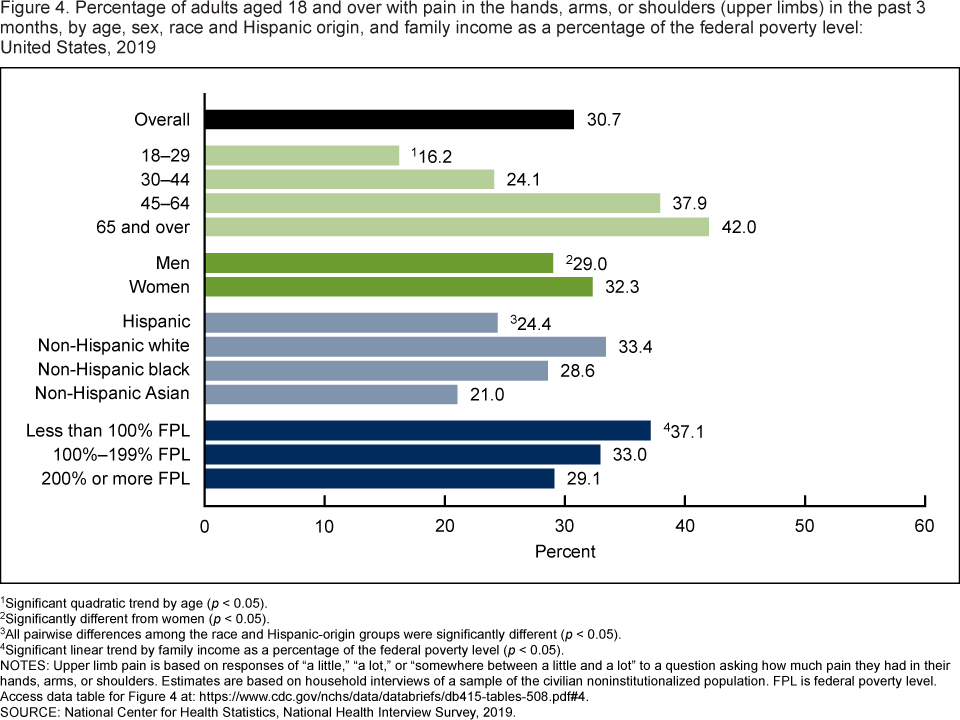 image icon
1Significant quadratic trend by age (p < 0.05).
2Significantly different from women (p < 0.05).
3All pairwise differences among the race and Hispanic-origin groups were significantly different (p < 0.05).
4Significant linear trend by family income as a percentage of the federal poverty level (p < 0.05).
NOTES: Upper limb pain is based on responses of “a little,” “a lot,” or “somewhere between a little and a lot” to a question asking how much pain they had in their hands, arms, or shoulders. Estimates are based on household interviews of a sample of the civilian noninstitutionalized population. FPL is federal poverty level. Access data table for Figure 4pdf icon.
SOURCE: National Center for Health Statistics, National Health Interview Survey, 2019.
Summary
Overall, nearly three in five adults (58.9%) experienced pain of any kind in the past 3 months in 2019. Among adults, 39.0% experienced back pain, 36.5% experienced lower limb pain, and 30.7% experienced upper limb pain. The prevalence of pain experienced at each of these locations increased with age and was highest among adults aged 65 and over. The prevalence of pain at each of these locations was lowest among men and non-Hispanic Asian adults. Finally, the percentage of adults who experienced back, lower limb, and upper limb pain decreased with increasing family income as a percentage of FPL.
Definitions
Abdominal or pelvic pain: Responses of “a little,” “a lot,” and “somewhere in between a little and a lot” to the survey question, “Over the past 3 months, how much have you been bothered by abdominal, pelvic, or genital pain? Would you say not at all, a little, a lot, or somewhere in between?”
Any pain: Responses of “some days,” “most days,” and “every day” to the survey question, “In the past 3 months, how often did you have pain? Would you say never, some days, most days, or every day?”
Back pain: Responses of “a little,” “a lot,” and “somewhere in between a little and a lot” to the survey question, “Over the past 3 months, how much have you been bothered by back pain? Would you say not at all, a little, a lot, or somewhere in between?”
Family income: Based on the ratio of a family’s income in the previous calendar year to the poverty threshold defined by the U.S. Census Bureau. The 2019 National Health Interview Survey (NHIS) imputed income files were used when family income was not provided.
Head pain: Responses of “a little,” “a lot,” and “somewhere in between a little and a lot” to the survey question, “Over the past 3 months, how much have you been bothered by headache or migraine? Would you say not at all, a little, a lot, or somewhere in between?”
Lower limb pain: Responses of “a little,” ” lot,” and “somewhere in between a little and a lot” to the survey question, “Over the past 3 months, how much have you been bothered by pain in your hips, knees, or feet? Would you say not at all, a little, a lot, or somewhere in between?”
Race and Hispanic origin: Based on two separate questions that determine Hispanic or Latino origin and race. Adults of Hispanic or Latino origin may be of any race. Non-Hispanic white, non-Hispanic black, and non-Hispanic Asian refer to adults with the single-race group indicated. Non-Hispanic American Indian or Alaska Native adults and non-Hispanic Native Hawaiian or Other Pacific Islander adults are included in the totals but are not shown separately.
Toothache or jaw pain: Responses of “a little,” “a lot,” and “somewhere in between a little and a lot” to the survey question, “Over the past 3 months, how much have you been bothered by toothache or jaw pain? Would you say not at all, a little, a lot, or somewhere in between?”
Upper limb pain: Responses of “a little,” “a lot,” and “somewhere in between a little and a lot” to the survey question, “Over the past 3 months, how much have you been bothered by pain in your hands, arms, or shoulders? Would you say not at all, a little, a lot, or somewhere in between?”
Data source and methods
Data from the redesigned 2019 NHIS were used for this analysis. NHIS is a nationally representative household survey of the civilian noninstitutionalized U.S. population. It is conducted continuously throughout the year by the National Center for Health Statistics (NCHS). Data were collected via self-report by one randomly selected adult (n = 31,997) in the household (or proxy when the selected adult is unable to respond for themselves). Data for this analysis are from the rotating core pain section of the Sample Adult interview, which is, in general, included on the questionnaire every other year. For more information about NHIS, visit: https://www.cdc.gov/nchs/nhis.htm.
Point estimates and the corresponding variances were calculated using SAS-callable SUDAAN version 11.0 (RTI International, Research Triangle Park, N.C.) to account for the complex sample design of NHIS (7). Linear and quadratic trends by age group and poverty level were evaluated using orthogonal polynomials in logistic regression. Differences between percentages were evaluated using two-sided significance tests at the 0.05 level. All estimates presented meet NCHS data presentation standards for proportions (8).
About the authors
Jacqueline W. Lucas, Eric M. Connor, and Jonaki Bose are with NCHS’ Division of Health Interview Statistics.
References
- Almomani F, Alghwiri AA, Alghadir AH, Al-Momani A, Iqbal A. Prevalence of upper limb pain and disability and its correlates with demographic and personal factors. J Pain Res 12:2691–700. 2019.
- Husky MM, Farin FF, Compagnone P, Fermanian C, Kovess-Masfety V. Chronic back pain and its association with quality of life in a large French population survey. Health Qual Life Outcomes 16(1):195. 2018.
- Manchikanti L, Singh V, Falco FJE, Benyamin RM, Hirsch JA. Epidemiology of low back pain in adults. Neuromodulation 17(Suppl 2):3–10. 2014.
- Koseoglu BF, Akselim S, Kesikburun B, Ortabozkoyun O. The impact of lower extremity pain conditions on clinical variables and health-related quality of life in patients with stroke. Top Stroke Rehabil 24(1):50– 60. 2017.
- Murphy KR, Han JL, Yang S, Hussani SMQ, Elsamadicy AA, Parente B, et al. Prevalence of specific types of pain diagnoses in a sample of United States adults. Pain Physician 20(2):E257– 68. 2017.
- Kentar Y, Zastrow R, Bradley H, Brunner M, Pepke W, Bruckner T, et al. Prevalence of upper extremity pain in a population of people with paraplegia. Spinal Cord 56(7):695–703. 2018.
- RTI International. SUDAAN (Release 11.0.3) [computer software]. 2018.
- Parker JD, Talih M, Malec DJ, Beresovsky V, Carroll M, Gonzalez JF Jr., et al. National Center for Health Statistics data presentation standards for proportions. National Center for Health Statistics. Vital Health Stat 2(175). 2017.
Suggested citation
Lucas JW, Connor EM, Bose J. Back, lower limb, and upper limb pain among U.S. adults, 2019. NCHS Data Brief, no 415. Hyattsville, MD: National Center for Health Statistics. 2021. DOI: https://dx.doi.org/10.15620/cdc:107894external icon.
Copyright information
All material appearing in this report is in the public domain and may be reproduced or copied without permission; citation as to source, however, is appreciated.
National Center for Health Statistics
Brian C. Moyer, Ph.D., Director
Amy M. Branum, Ph.D., Associate Director for Science
Division of Health Interview Statistics
Stephen J. Blumberg, Ph.D., Director
Anjel Vahratian, Ph.D., M.P.H., Associate Director for Science