Urban–Rural Differences in Drug Overdose Death Rates, 1999–2019
NCHS Data Brief No. 403, March 2021
PDF Versionpdf iconpdf icon (516 KB)
- Key findings
- In 2019, rates of overdose deaths were higher in rural counties than in urban counties in five states.
- Urban–rural differences in trends in overdose deaths varied by type of opioid and over time.
- Urban–rural differences in trends in overdose deaths also varied by type of stimulant and over time.
- Summary
Data from the National Vital Statistics System, Mortality
- From 1999 through 2019, the rate of drug overdose deaths increased from 6.4 per 100,000 to 22.0 in urban counties and from 4.0 to 19.6 in rural counties.
- In 2019, rates in rural counties were higher than in urban counties in California, Connecticut, North Carolina, Vermont, and Virginia.
- Rates of drug overdose deaths involving natural and semisynthetic opioids (drugs such as oxycodone, hydrocodone, and codeine) were higher in rural than in urban counties from 2004 through 2017 but were similar in 2018 and 2019.
- In 2019, the rate of drug overdose deaths involving psychostimulants with abuse potential (drugs such as methamphetamine) was 1.4 times higher in rural counties (6.7 per 100,000) than in urban counties (4.8).
Drug overdose death rates continue to rise in the United States (1–3), with significant urban–rural differences in rates by sex, age, and types of drugs involved (4). This report uses the most recent mortality data from the National Vital Statistics System (NVSS) to examine urban–rural differences in drug overdose death rates for all drugs and by selected types of opioids and stimulants.
Keywords: opioids, methamphetamine, National Vital Statistics System, Mortality (NVSS–M)
From 2016 through 2019, age-adjusted drug overdose death rates were higher in urban counties than in rural counties.
- The age-adjusted rate of drug overdose deaths in urban counties increased from 6.4 per 100,000 in 1999 to 22.0 in 2019; the age-adjusted rate in rural counties increased from 4.0 to 19.6 (Figure 1).
- Rates were higher in urban than in rural counties from 1999 through 2003 and from 2016 through 2019. From 2007 through 2015, rates were higher in rural than in urban counties.
Figure 1. Age-adjusted rates of drug overdose deaths, by urban and rural residence: United States, 1999–2019
image iconimage icon image icon
1Significant increasing trend from 1999 to 2017, with different rates of change over time; stable trend from 2017 through 2019, p < 0.05.
2Significant increasing trend from 1999 through 2019, with different rates of change over time, p < 0.05.
NOTES: Drug overdose deaths were identified using International Classification of Diseases, 10th Revision underlying cause-of-death codes X40–X44, X60–X64, X85, and Y10–Y14. Age-adjusted death rates were calculated using the direct method and the 2000 U.S. standard population. Decedent’s county of residence was classified as urban or rural based on the 2013 NCHS Urban–Rural Classification Scheme for Counties. Access data table for Figure 1pdf iconpdf icon.
SOURCE: National Center for Health Statistics, National Vital Statistics System, Mortality.
In 2019, rates of overdose deaths were higher in rural counties than in urban counties in five states.
- Although the national age-adjusted rate of drug overdose deaths in 2019 was higher in urban counties than in rural counties, for five states (California, Connecticut, North Carolina, Vermont, and Virginia), rates were higher in rural counties than in urban counties (Figure 2).
- Rates were higher in urban counties than in rural counties for 19 states: Alabama, Arizona, Arkansas, Florida, Hawaii, Illinois, Iowa, Kentucky, Louisiana, Michigan, Mississippi, Missouri, Nebraska, New Hampshire, Ohio, Pennsylvania, Tennessee, West Virginia, and Wisconsin.
- Urban and rural rates were statistically similar in all remaining states and jurisdictions that have both urban and rural counties.
Figure 2. Urban–rural differences in age-adjusted rates of drug overdose deaths, by jurisdiction of residence: 2019
image iconimage icon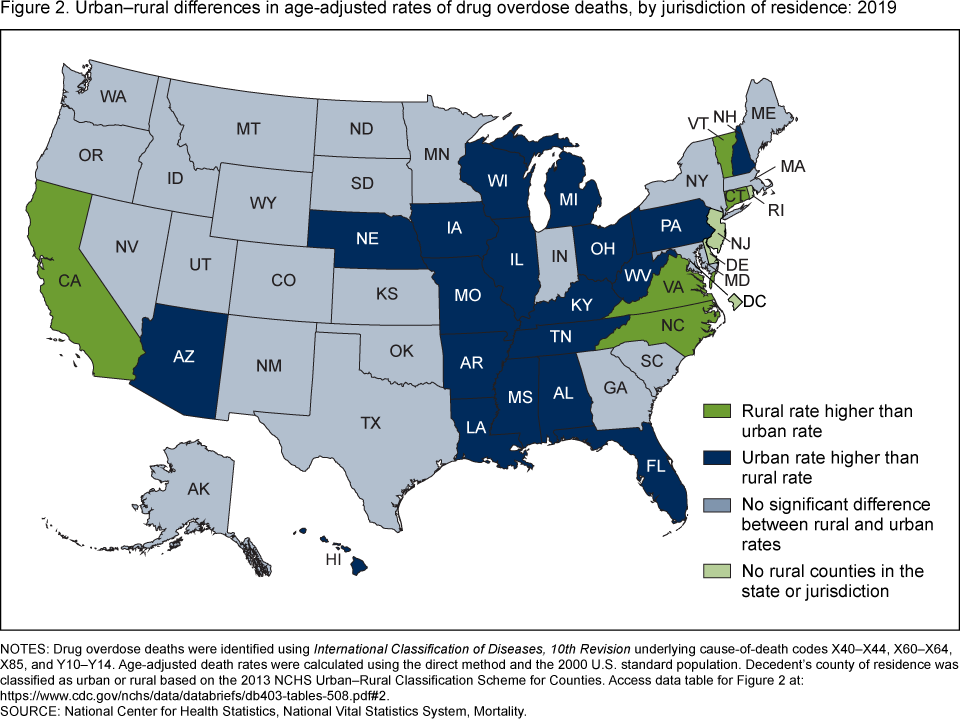 image icon
NOTES: Drug overdose deaths were identified using International Classification of Diseases, 10th Revision underlying cause-of-death codes X40–X44, X60–X64, X85, and Y10–Y14. Age-adjusted death rates were calculated using the direct method and the 2000 U.S. standard population. Decedent’s county of residence was classified as urban or rural based on the 2013 NCHS Urban–Rural Classification Scheme for Counties. Access data table for Figure 2pdf iconpdf icon.
SOURCE: National Center for Health Statistics, National Vital Statistics System, Mortality.
Urban–rural differences in trends in overdose deaths varied by type of opioid and over time.
- Age-adjusted rates of drug overdose deaths involving natural and semisynthetic opioids (drugs such as oxycodone, hydrocodone, and codeine) were higher in rural than in urban counties from 2004 through 2017. In 2018 and 2019, urban and rural rates were similar (Figure 3).
- From 1999 through 2019, age-adjusted rates of drug overdose deaths involving heroin were higher in urban than in rural counties. In 2019, the rate in urban counties (4.6 per 100,000) was 1.5 times the rate in rural counties (3.0).
- From 2001 through 2014, the age-adjusted rates of drug overdose deaths involving synthetic opioids other than methadone (drugs such as fentanyl, fentanyl analogs, and tramadol) were higher in rural than in urban counties. From 2015 through 2019, the pattern changed, with higher rates seen in urban counties. In 2019, the rate in urban counties (11.9) was 1.4 times the rate in rural counties (8.3).
Figure 3. Age-adjusted rates of opioid-involved drug overdose deaths, by type of opioid and urban or rural residence: United States, 1999–2019
image iconimage icon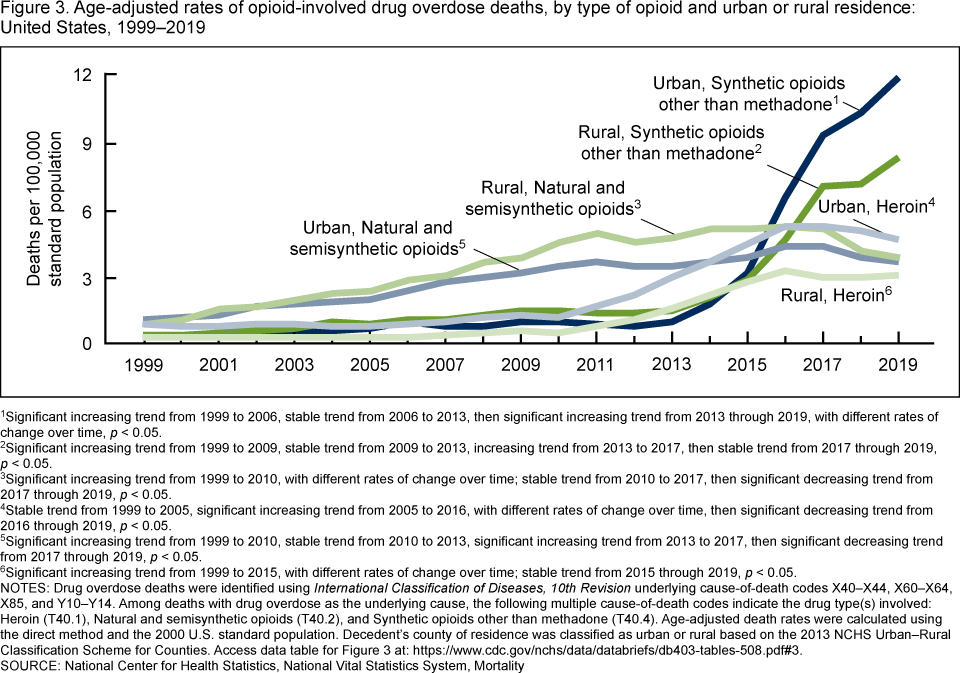 image icon
1Significant increasing trend from 1999 to 2006, stable trend from 2006 to 2013, then significant increasing trend from 2013 through 2019, with different rates of change over time, p < 0.05.
2Significant increasing trend from 1999 to 2009, stable trend from 2009 to 2013, increasing trend from 2013 to 2017, then stable trend from 2017 through 2019, p < 0.05.
3Significant increasing trend from 1999 to 2010, with different rates of change over time; stable trend from 2010 to 2017, then significant decreasing trend from 2017 through 2019, p < 0.05.
4Stable trend from 1999 to 2005, significant increasing trend from 2005 to 2016, with different rates of change over time, then significant decreasing trend from 2016 through 2019, p < 0.05.
5Significant increasing trend from 1999 to 2010, stable trend from 2010 to 2013, significant increasing trend from 2013 to 2017, then significant decreasing trend from 2017 through 2019, p < 0.05.
6Significant increasing trend from 1999 to 2015, with different rates of change over time; stable trend from 2015 through 2019, p < 0.05.
NOTES: Drug overdose deaths were identified using International Classification of Diseases, 10th Revision underlying cause-of-death codes X40–X44, X60–X64, X85, and Y10–Y14. Among deaths with drug overdose as the underlying cause, the following multiple cause-of-death codes indicate the drug type(s) involved: Heroin (T40.1), Natural and semisynthetic opioids (T40.2), and Synthetic opioids other than methadone (T40.4). Age-adjusted death rates were calculated using the direct method and the 2000 U.S. standard population. Decedent’s county of residence was classified as urban or rural based on the 2013 NCHS Urban–Rural Classification Scheme for Counties. Access data table for Figure 3pdf iconpdf icon.
SOURCE: National Center for Health Statistics, National Vital Statistics System, Mortality.
Urban–rural differences in trends in overdose deaths also varied by type of stimulant and over time.
- From 2012 through 2019, age-adjusted rates of drug overdose deaths involving psychostimulants with abuse potential (drugs such as methamphetamine, amphetamine, and methylphenidate) were higher in rural counties than in urban counties. In 2019, the rate in rural counties (6.7 per 100,000) was 1.4 times the rate in urban counties (4.8) (Figure 4).
- From 1999 through 2019, age-adjusted rates of drug overdose deaths involving cocaine were higher in urban counties than in rural counties. In 2019, the rate in urban counties (5.3) was more than twice the rate in rural counties (2.4).
Figure 4. Age-adjusted rates of stimulant-involved drug overdose deaths, by type of stimulant and urban or rural residence: United States, 1999–2019
image iconimage icon image icon
1Significant increasing trend from 1999 to 2004, stable trend from 2004 to 2008, then increasing trend from 2008 through 2019, with different rates of change over time, p < 0.05.
2Significant increasing trend from 1999 to 2005, stable trend from 2005 to 2008, then increasing trend from 2008 through 2019, with different rates of change over time, p < 0.05.
3Significant increasing trend from 1999 to 2006, significant decreasing trend from 2006 to 2012, significant increasing trend from 2012 to 2017, then stable trend from 2017 through 2019, p < 0.05.
4Significant increasing trend from 1999 to 2006, significant decreasing trend from 2006 to 2010, then significant increasing trend from 2010 through 2019, p < 0.05.
NOTES: Drug overdose deaths were identified using International Classification of Diseases, 10th Revision underlying cause-of-death codes X40–X44, X60–X64, X85, and Y10–Y14. Among deaths with drug overdose as the underlying cause, the following multiple cause-of-death codes indicate the drug type(s) involved: Cocaine (T40.5) and Psychostimulants with abuse potential (T43.6). Age-adjusted death rates were calculated using the direct method and the 2000 U.S. standard population. Decedent’s county of residence was classified as urban or rural based on the 2013 NCHS Urban–Rural Classification Scheme for Counties. Access data table for Figure 4pdf iconpdf icon.
SOURCE: National Center for Health Statistics, National Vital Statistics System, Mortality.
Summary
From 1999 through 2019, the age-adjusted rate of drug overdose deaths increased in both urban and rural counties (from 6.4 per 100,000 to 22.0 in urban counties and from 4.0 to 19.6 in rural counties). Rates were higher in urban counties than in rural counties from 1999 through 2003, similar from 2004 through 2006, higher in rural than in urban counties from 2007 through 2015, and higher in urban than in rural counties from 2016 through 2019. Although nationally the age-adjusted rate of drug overdose deaths in 2019 was higher in urban counties than in rural counties, five states (California, Connecticut, North Carolina, Vermont, and Virginia) showed the opposite pattern, with higher rates in rural counties. Urban–rural differences over time were also seen in the rates of drug overdose deaths involving specific types of drugs. For example, drug overdose deaths involving natural and semisynthetic opioids were higher in rural areas from the mid-2000s through 2017 but were similar between urban and rural areas in 2018 and 2019, as deaths in rural areas declined. Rates for drug overdose deaths involving heroin or cocaine were consistently higher in urban than in rural counties over the entire period. Rates of drug overdose deaths involving synthetic opioids other than methadone (drugs such as fentanyl, fentanyl analogs, and tramadol) were similar or slightly higher in rural than in urban counties through 2014. The pattern changed in 2015 through 2019, with higher rates seen in urban counties than in rural counties. Since 2012, rates of drug overdose deaths involving psychostimulants with abuse potential (drugs such as methamphetamine, amphetamine, and methylphenidate) have remained higher in rural than in urban counties.
Definitions
Drug poisoning (overdose) deaths: Includes deaths resulting from unintentional or intentional overdose of a drug, being given the wrong drug, taking a drug in error, or taking a drug inadvertently.
Natural and semisynthetic opioids: Includes drugs such as codeine, hydrocodone, and oxycodone.
Synthetic opioids other than methadone: Includes drugs such as fentanyl, fentanyl analogs, and tramadol.
Psychostimulants with abuse potential: Includes drugs such as methamphetamine, amphetamine, and methylphenidate.
Data source and methods
Estimates are based on the NVSS multiple-cause-of-death mortality files (5). Drug poisoning (overdose) deaths were defined as having an International Classification of Diseases, 10th Revision (ICD–10) underlying-cause-of-death code of X40–X44 (unintentional), X60–X64 (suicide), X85 (homicide), or Y10–Y14 (undetermined intent) (6). Of the drug overdose deaths in 2019, 88% were unintentional, 7% were suicides, 5% were of undetermined intent, and less than 1% were homicides. The type of drug(s) involved are indicated by ICD–10 multiple-cause-of-death codes: heroin (T40.1); natural and semisynthetic opioids (T40.2); synthetic opioids other than methadone (T40.4); cocaine (T40.5), and psychostimulants with abuse potential (T43.6).
The decedent’s county of residence was categorized using the 2013 NCHS Urban–Rural Classification Scheme for Counties (7). Counties were classified into six urbanization levels based on metropolitan–nonmetropolitan status, population distribution, and other factors. The four metropolitan categories (i.e., large central metro, large fringe metro, medium metro, and small metro) were grouped as urban counties. The two nonmetropolitan categories (i.e., micropolitan and noncore) were grouped as rural counties.
Age-adjusted death rates were calculated using the direct method and adjusted to the 2000 U.S. standard population (8). Trends in age-adjusted death rates were evaluated using the Joinpoint Regression Program (Version 4.8.1.0) (9). Joinpoint software fitted weighted least-squares regression models to the rates on the log transform scale. Analyses were set to allow a maximum of three joinpoints across the period, a minimum of three observed time points from any given joinpoint to either end of the data, and a minimum of four observed time points between any two joinpoints. The permutation tests for model (number of joinpoints) significance were set at an overall alpha level of 0.05 (10). Pairwise comparisons of rates were conducted using the z test statistic with an alpha level of 0.05 (two-sided) (8).
Several factors related to death investigation and reporting may affect measurement of death rates involving specific drugs. At autopsy, the substances tested for and the circumstances under which the toxicology tests are performed vary by jurisdiction. This variability is more likely to affect substance-specific death rates than the overall drug overdose death rate. In 2019, nationally, 94% of drug overdose deaths identified at least one specific drug or drug class (94% in urban counties and 91% in rural counties).
Additionally, drug overdose deaths may involve multiple drugs; therefore, a single death might be included in more than one category when describing the rate of drug overdose deaths involving specific drugs. For example, a death that involved both heroin and fentanyl would be included in both the rate of drug overdose deaths involving heroin and the rate of drug overdose deaths involving synthetic opioids other than methadone.
About the authors
Holly Hedegaard and Merianne Rose Spencer are with the National Center for Health Statistics, Division of Analysis and Epidemiology.
References
- Hedegaard H, Miniño AM, Warner M. Drug overdose deaths in the United States, 1999–2019pdf iconpdf icon. NCHS Data Brief, no 394. Hyattsville, MD: National Center for Health Statistics. 2020.
- Ahmad FB, Rossen LM, Sutton P. Provisional drug overdose death counts. National Center for Health Statistics. 2021.
- Wilson N, Kariisa M, Seth P, Smith H IV, Davis NL. Drug and opioid-involved overdose deaths—United States, 2017–2018pdf iconpdf icon. MMWR Morb Mortal Wkly Rep 69(11):290–7. 2020.
- Hedegaard H, Miniño AM, Warner M. Urban–rural differences in drug overdose death rates, by sex, age, and type of drugs involved, 2017pdf iconpdf icon. NCHS Data Brief, no 345. Hyattsville, MD: National Center for Health Statistics. 2019.
- National Center for Health Statistics. Public-use data files: Mortality multiple cause files. 2019.
- World Health Organization. International statistical classification of diseases and related health problems, 10th revision (ICD–10). 2008 ed. Geneva, Switzerland. 2009.
- Ingram DD, Franco SJ. 2013 NCHS urban–rural classification scheme for countiespdf iconpdf icon. National Center for Health Statistics. Vital Health Stat 2(166). 2014.
- Murphy SL, Xu JQ, Kochanek KD, Arias E, Tejada-Vera B. Deaths: Final data for 2018pdf iconpdf icon. National Vital Statistics Reports; vol 69 no 13. Hyattsville, MD: National Center for Health Statistics. 2021.
- National Cancer Institute. Joinpoint Regression Program (Version 4.8.1.0) [computer software]. 2019.
- Ingram DD, Malec DJ, Makuc DM, Kruszon-Moran D, Gindi RM, Albert M, et al. National Center for Health Statistics guidelines for analysis of trendspdf iconpdf icon. National Center for Health Statistics. Vital Health Stat 2(179). 2018.
Suggested citation
Hedegaard H, Spencer MR. Urban–rural differences in drug overdose death rates, 1999–2019. NCHS Data Brief, no 403. Hyattsville, MD: National Center for Health Statistics. 2021. DOI: https://dx.doi.org/10.15620/cdc:102891external iconexternal icon.
Copyright information
All material appearing in this report is in the public domain and may be reproduced or copied without permission; citation as to source, however, is appreciated.
National Center for Health Statistics
Brian C. Moyer, Ph.D., Director
Amy M. Branum, Ph.D., Acting Associate Director for Science
Division of Analysis and Epidemiology
Irma E. Arispe, Ph.D., Director
Kevin C. Heslin, Ph.D., Associate Director for Science