Motor Vehicle Traffic Death Rates, by Sex, Age Group, and Road User Type: United States, 1999–2019
NCHS Data Brief No. 400, March 2021
PDF Versionpdf icon (568 KB) | Visual Abstract
- Key findings
- Although an overall decline was seen from 1999 through 2019, motor vehicle traffic death rates have increased in recent years.
- Rates for males decreased from 1999 through 2019 for all age groups, with the greatest declines seen in rates for males aged 0–14 and 15–24 years.
- Rates for females also decreased from 1999 through 2019 for all age groups, with the greatest declines seen in rates for females aged 0–14 and 15–24 years.
- Death rates for motor vehicle occupants decreased 37% from 1999 through 2019.
Data from the National Vital Statistics System, Mortality
- Motor vehicle traffic death rates were stable from 1999 to 2006, declined on average by 8% each year from 2006 (14.5 per 100,000) to 2010 (10.7), and then increased from 2010 through 2019 (11.1).
- Among males, differences in the rates by age group diminished over time; by 2019, the rate for males aged 15–24, the group with the highest rate in 1999, was lower than the rate for males aged 25–64 and 65 and over.
- Among females, rates for all age groups decreased from 1999 through 2019.
- Rates for motor vehicle occupants decreased by 37% from 12.0 in 1999 to 7.6 in 2019.
Motor vehicle traffic deaths are one of the leading contributors to unintentional injury deaths in the United States (1). Recent studies have described changes in the rates of motor vehicle traffic deaths for different demographic groups (2–5). This report provides national trends in motor vehicle traffic deaths by sex, age group, and type of road user (i.e., motor vehicle occupant, motorcyclist, pedestrian, or pedal cyclist) from 1999 through 2019 using the latest mortality data from the National Vital Statistics System (NVSS).
Keywords: national trends, traffic fatalities, pedestrian fatalities, National Vital Statistics System
Although an overall decline was seen from 1999 through 2019, motor vehicle traffic death rates have increased in recent years.
- In 2019, 37,595 motor vehicle traffic deaths occurred, for an age-adjusted death rate of 11.1 per 100,000 (Figure 1).
- Motor vehicle traffic death rates were stable from 1999 to 2006, declined on average by 8% each year from 2006 (14.5) to 2010 (10.7), and then increased from 2010 through 2019 (11.1).
- Rates for males decreased from 20.4 in 1999 to 16.0 in 2019. Rates for females decreased from 9.4 in 1999 to 6.3 in 2019.
- Rates for males were more than double the rates for females throughout the study period.
Figure 1. Age-adjusted rates for motor vehicle traffic deaths, by sex: United States, 1999–2019
 image icon
1Rates for males were significantly higher than rates for females over the study period, p < 0.05.
2Stable trend from 1999 to 2006; significant decreasing trend from 2006 to 2010; significant increasing trend from 2010 through 2019, p < 0.05.
3Significant decreasing trend from 1999 to 2010, with different rates of change over time; stable trend from 2010 through 2019, p < 0.05.
NOTES: In 2019, 37,595 motor vehicle traffic deaths occurred. Motor vehicle traffic deaths were identified using International Classification of Diseases, 10th Revision (ICD–10) codes V02–V04 (.1, .9), V09.2, V12–V14 (.3–.9), V19 (.4–.6), V20–V28 (.3–.9), V29–V79 (.4–.9), V80 (.3–.5), V81.1, V82.1, V83–V86 (.0–.3), V87 (.0–.8), and V89.2. Age-adjusted death rates were calculated using the direct method and the 2000 U.S. standard population. Access data table for Figure 1pdf icon.
SOURCE: National Center for Health Statistics, National Vital Statistics System, Mortality (NVSS–M).
Rates for males decreased from 1999 through 2019 for all age groups, with the greatest declines seen in rates for males aged 0–14 and 15–24 years.
- Rates for males decreased over the period for all age groups (Figure 2).
- In 1999, rates among males were highest for those aged 15–24 (35.0 per 100,000). By 2019, the rate for males aged 15–24 (19.0) was lower than that for males aged 25–64 (19.7) and 65 and over (21.8). In 2019, males aged 65 and over had the highest rate.
- Throughout the period, rates among males were lowest for those aged 0–14; rates decreased 56% from 4.5 in 1999 to 2.0 in 2019.
Figure 2. Motor vehicle traffic death rates among males, by age group: United States, 1999–2019
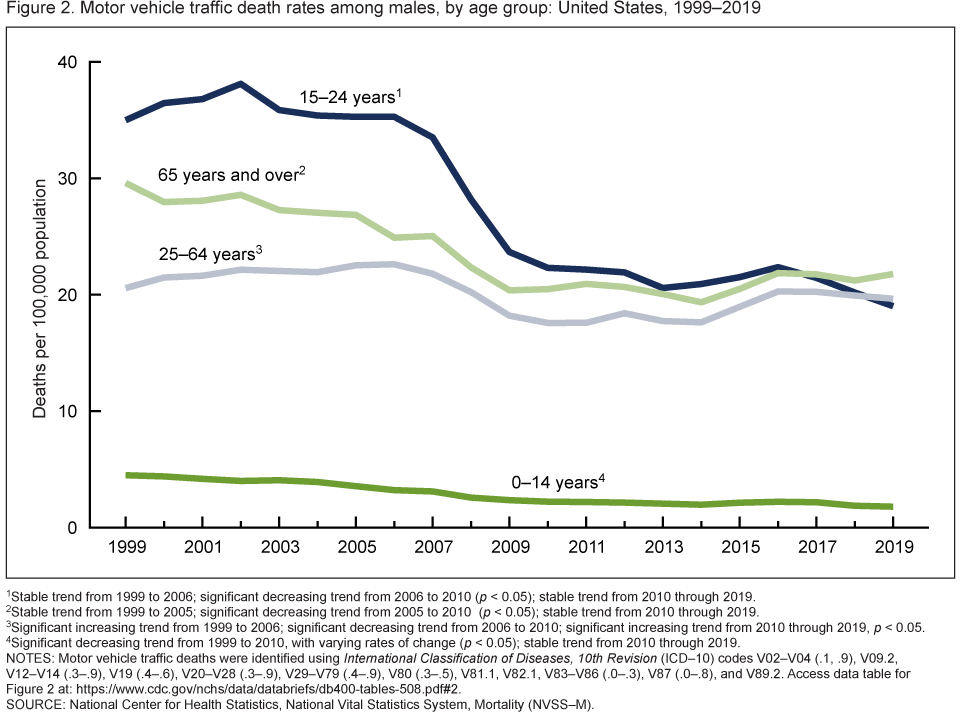 image icon
1Stable trend from 1999 to 2006; significant decreasing trend from 2006 to 2010 (p < 0.05); stable trend from 2010 through 2019.
2Stable trend from 1999 to 2005; significant decreasing trend from 2005 to 2010 (p < 0.05); stable trend from 2010 through 2019.
3Significant increasing trend from 1999 to 2006; significant decreasing trend from 2006 to 2010; significant increasing trend from 2010 through 2019, p < 0.05.
4Significant decreasing trend from 1999 to 2010, with varying rates of change (p < 0.05); stable trend from 2010 through 2019.
NOTES: Motor vehicle traffic deaths were identified using International Classification of Diseases, 10th Revision (ICD–10) codes V02–V04 (.1, .9), V09.2, V12–V14 (.3–.9), V19 (.4–.6), V20–V28 (.3–.9), V29–V79 (.4–.9), V80 (.3–.5), V81.1, V82.1, V83–V86 (.0–.3), V87 (.0–.8), and V89.2. Access data table for Figure 2pdf icon.
SOURCE: National Center for Health Statistics, National Vital Statistics System, Mortality (NVSS–M).
Rates for females also decreased from 1999 through 2019 for all age groups, with the greatest declines seen in rates for females aged 0–14 and 15–24 years.
- Rates for females decreased over the period for all age groups (Figure 3).
- In 1999, rates among females were highest for those aged 15–24 and 65 and over at 15.7 and 15.8 per 100,000, respectively. In 2019, women aged 65 and over had the highest rate (9.3).
- Throughout the period, rates among females were lowest for those aged 0–14; rates decreased 54% from 3.5 in 1999 to 1.7 in 2019.
Figure 3. Motor vehicle traffic death rates among females, by age group: United States, 1999–2019
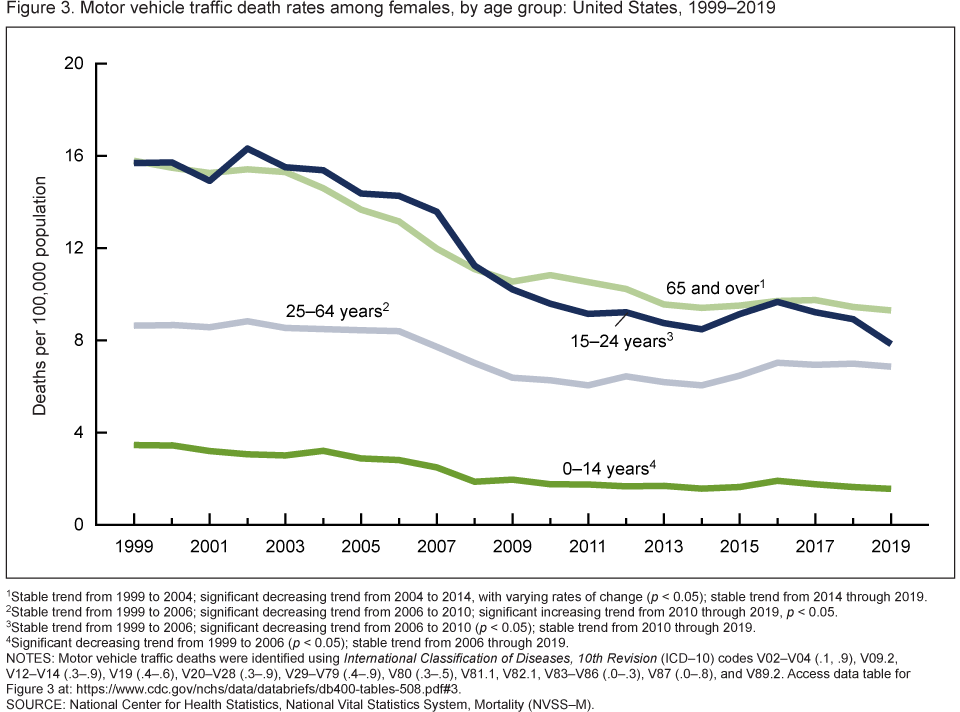 image icon
1Stable trend from 1999 to 2004; significant decreasing trend from 2004 to 2014, with varying rates of change (p < 0.05); stable trend from 2014 through 2019.
2Stable trend from 1999 to 2006; significant decreasing trend from 2006 to 2010; significant increasing trend from 2010 through 2019, p < 0.05.
3Stable trend from 1999 to 2006; significant decreasing trend from 2006 to 2010 (p < 0.05); stable trend from 2010 through 2019.
4Significant decreasing trend from 1999 to 2006 (p < 0.05); stable trend from 2006 through 2019.
NOTES: Motor vehicle traffic deaths were identified using International Classification of Diseases, 10th Revision (ICD–10) codes V02–V04 (.1, .9), V09.2, V12–V14 (.3–.9), V19 (.4–.6), V20–V28 (.3–.9), V29–V79 (.4–.9), V80 (.3–.5), V81.1, V82.1, V83–V86 (.0–.3), V87 (.0–.8), and V89.2. Access data table for Figure 3pdf icon.
SOURCE: National Center for Health Statistics, National Vital Statistics System, Mortality (NVSS–M).
Death rates for motor vehicle occupants decreased 37% from 1999 through 2019.
- Age-adjusted motor vehicle traffic death rates were highest for motor vehicle occupants and lowest for pedal cyclists for the entire period (Figure 4).
- Rates for motor vehicle occupants decreased from 12.0 per 100,000 in 1999 to 7.6 in 2019.
- Rates for pedestrians were stable at about 1.7 between 1999 and 2006 and then increased to 2.0 in 2019.
- Rates for motorcyclists increased on average 9% per year, from 0.8 in 1999 to 1.6 in 2007, then remained stable through 2019 (1.4).
- Rates for pedal cyclists were stable over the period at roughly 0.2 per 100,000.
Figure 4. Age-adjusted motor vehicle traffic death rates, by road-user type: United States, 1999–2019
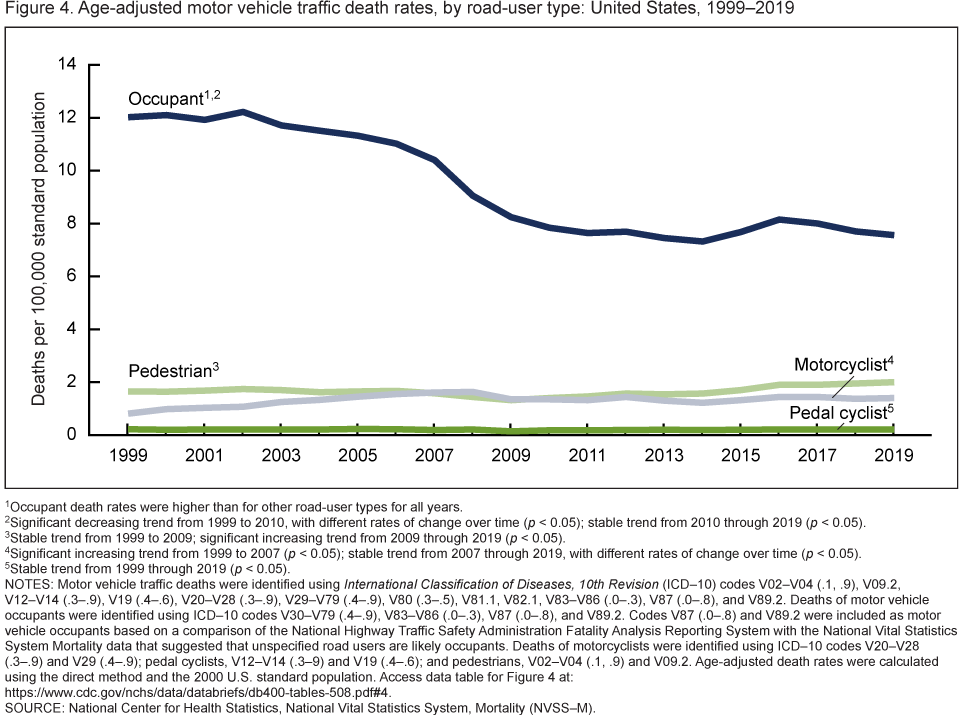 image icon
1Occupant death rates were higher than for other road-user types for all years.
2Significant decreasing trend from 1999 to 2010, with different rates of change over time (p < 0.05); stable trend from 2010 through 2019 (p < 0.05).
3Stable trend from 1999 to 2009; significant increasing trend from 2009 through 2019 (p < 0.05).
4Significant increasing trend from 1999 to 2007 (p < 0.05); stable trend from 2007 through 2019, with different rates of change over time (p < 0.05).
5Stable trend from 1999 through 2019 (p < 0.05).
NOTES: Motor vehicle traffic deaths were identified using International Classification of Diseases, 10th Revision (ICD–10) codes V02–V04 (.1, .9), V09.2, V12–V14 (.3–.9), V19 (.4–.6), V20–V28 (.3–.9), V29–V79 (.4–.9), V80 (.3–.5), V81.1, V82.1, V83–V86 (.0–.3), V87 (.0–.8), and V89.2. Deaths of motor vehicle occupants were identified using ICD–10 codes V30–V79 (.4–.9), V83–V86 (.0–.3), V87 (.0–.8), and V89.2. Codes V87 (.0–.8) and V89.2 were included as motor vehicle occupants based on a comparison of the National Highway Traffic Safety Administration Fatality Analysis Reporting System with the National Vital Statistics System Mortality data that suggested that unspecified road users are likely occupants. Deaths of motorcyclists were identified using ICD–10 codes V20–V28 (.3–.9) and V29 (.4–.9); pedal cyclists, V12–V14 (.3–.9) and V19 (.4–.6); and pedestrians, V02–V04 (.1, .9) and V09.2. Age-adjusted death rates were calculated using the direct method and the 2000 U.S. standard population. Access data table for Figure 4pdf icon.
SOURCE: National Center for Health Statistics, National Vital Statistics System, Mortality (NVSS–M).
Summary
This report highlights differences in motor vehicle traffic death rates by sex, age group, and the type of road user. Overall, rates of motor vehicle traffic deaths decreased from 14.7 per 100,000 in 1999, stabilized (with a low point of 10.3 in 2014), and then increased in recent years to 11.1 in 2019. Rates were higher for males than for females throughout the period. In 2019, the rate for males (16.0) was roughly 2.5 times that for females (6.3). Although rates declined for all age groups from 1999 through 2019, the pace of change differed for each group. For example, the rate for males aged 15–24 in 1999 (35.0) was 1.7 times that for males aged 25–64 (20.6). By 2019, the rate for males aged 15–24 (19.0) was lower than that for males aged 25–64 (19.7) and 65 and over (21.8). For females, the rates for those aged 15–24 (15.7) and 65 and over (15.8) were similar in 1999 and then decreased to 8.2 and 9.3, respectively, in 2019. In 2019, persons aged 65 and over had the highest rates for both males and females.
Throughout the study period, rates were highest for motor vehicle occupants compared with other types of road users (i.e., motorcyclists, pedal cyclists, and pedestrians). The rates for motor vehicle occupants decreased 37% from 12.0 in 1999 to 7.6 in 2019. Rates for motorcyclists doubled from 0.8 in 1999 to 1.6 in 2007, then remained stable in recent years. Rates for pedal cyclists were stable over the study period, while rates for pedestrians increased from 1.7 in 1999 to 2.0 in 2019.
Data source and methods
NVSS multiple cause-of-death mortality data from 1999–2019 (6) were used to examine motor vehicle traffic deaths by sex, age group, and type of road user. Numbers and rates from analysis of NVSS mortality data might differ from those obtained from analysis of data from the National Highway Traffic Administration’s Fatality Analysis Reporting System (FARS) due to differences in case inclusion criteria, reporting sources, and other factors (7).
Motor vehicle traffic deaths were identified using International Classification of Diseases, 10th Revision (ICD–10) underlying cause-of-death codes (8) V02–V04 (.1, .9), V09.2, V12–V14 (.3–.9), V19 (.4–.6), V20–V28 (.3–.9), V29–V79 (.4–.9), V80 (.3–.5), V81.1, V82.1, V83–V86 (.0–.3), V87 (.0–.8), and V89.2. These codes include deaths to motor vehicle occupants, pedestrians, pedal cyclists (bicyclists), motorcyclists, and other road users from injuries sustained in an unintentional motor vehicle-related event that occurred on a public roadway (traffic). Deaths of motor vehicle occupants were identified using ICD–10 codes V30–V79 (.4–.9), V83–V86 (.0–.3), V87 (.0–.8), and V89.2. Codes V87 (.0–.8) and V89.2 were included as motor vehicle occupants based on a comparison of FARS and NVSS data that suggested that unspecified road users are likely occupants (7). Deaths of motorcyclists were identified using ICD–10 codes V20–V28 (.3–.9) and V29 (.4–.9); pedal cyclists, V12–V14 (.3–.9) and V19 (.4–.6); and pedestrians, V02–V04 (.1, .9) and V09.2.
Age-adjusted death rates were calculated using the direct method and adjusted to the 2000
standard population (9). Trends in age-adjusted death rates were evaluated using the Joinpoint Regression Program (Version 4.8.0.1) (10). Joinpoint software fitted weighted least-squares regression models to the rates on the log transform scale (11) . The permutation tests for model (number of joinpoints) significance were set at an overall alpha level of 0.05 (11). Pairwise comparisons of rates (e.g., age-adjusted rates for males compared with females) were conducted using the z test with an alpha level of 0.05 (9).
About the authors
Merianne Rose Spencer, Holly Hedegaard, and Matthew Garnett are with the National Center for Health Statistics (NCHS), Division of Analysis and Epidemiology.
References
- Olaisen RH, Rossen LM, Warner M, Anderson RN. Unintentional injury death rates in rural and urban areas: United States, 1999–2017pdf icon. NCHS Data Brief, no 343. Hyattsville, MD: National Center for Health Statistics. 2019.
- National Center for Statistics and Analysis. 2018 fatal motor vehicle crashes: Overviewexternal icon. Traffic Safety Facts Research Note. Report No. DOT HS 812 826. Washington, DC: National Highway Traffic Safety Administration. 2019.
- Xu JQ. QuickStats: Death rates for motor vehicle traffic injury, by age group—National Vital Statistics System, United States, 2015 and 2017. MMWR Morb Mortal Wkly Rep 68(6):167. 2019. DOI: https://dx.doi.org/10.15585/mmwr.mm6806a8external icon.
- Curtin SC, Tejada-Vera B. Motor vehicle traffic death rates among adolescents and young adults aged 15–24, by urbanicity: United States, 2000–2018pdf icon. NCHS Data Brief, no 385. Hyattsville, MD: National Center for Health Statistics. 2020.
- Joyner SN, Kandi D. QuickStats: Age-adjusted motor vehicle traffic death rates, by urban-rural status and sex—National Vital Statistics System, United States, 2017. MMWR Morb Mortal Wkly Rep 68(25):573. 2019. DOI: https://dx.doi.org/10.15585/mmwr.mm6825a4external icon.
- National Center for Health Statistics. Public-use data files: Mortality multiple cause files. 2018.
- Mack KA, Hedegaard H, Ballesteros MF, et al. The need to improve information on road user type in National Vital Statistics System mortality data. Traffic Injury Prevention. 2019. DOI: https://doi.org/10.1080/15389588.2019.1576036external icon.
- World Health Organization. International statistical classification of diseases and related health problems, 10th revision (ICD–10). 2008 ed. Geneva, Switzerland. 2009.
- Murphy SL, Xu JQ, Kochanek KD, Arias E, Tejada-Vera B. Deaths: Final data for 2018pdf icon. National Vital Statistics Reports; vol 69 no 13. Hyattsville, MD: National Center for Health Statistics. 2020.
- National Cancer Institute. Joinpoint Regression Program (Version 4.8.0.1) [computer software]. 2020.
- Ingram DD, Malec DJ, Makuc DM, Kruszon-Moran D, Gindi RM, Albert M, et al. National Center for Health Statistics guidelines for analysis of trendspdf icon. National Center for Health Statistics. Vital Health Stat 2(179). 2018.
Suggested citation
Spencer MR, Hedegaard H, Garnett M. Motor vehicle traffic death rates, by sex, age group, and road user type: United States, 1999–2019. NCHS Data Brief, no 400. Hyattsville, MD: National Center for Health Statistics. 2021. DOI: https://dx.doi.org/10.15620/cdc:101759external icon.
Copyright information
All material appearing in this report is in the public domain and may be reproduced or copied without permission; citation as to source, however, is appreciated.
National Center for Health Statistics
Brian C. Moyer, Ph.D., Director
Amy M. Branum, Ph.D., Acting Associate Director for Science
Division of Analysis and Epidemiology
Irma E. Arispe, Ph.D., Director
Kevin C. Heslin, Ph.D., Associate Director for Science