Rates of Alcohol-induced Deaths Among Adults Aged 25 and Over in Urban and Rural Areas: United States, 2000–2018
- Key findings
- Rates for alcohol-induced deaths among persons aged 25 and over increased from 2000 through 2018.
- The difference in alcohol-induced death rates between urban and rural areas was greater in 2018 than in 2000 for both males and females aged 25 and over.
- In 2000, the highest rates of alcohol-induced deaths among males aged 25 and over occurred in the most urban areas, while in 2018, the highest rates occurred in medium metro, small metro, and rural areas.
- In 2000, the highest rates of alcohol-induced deaths among females aged 25 and over occurred in the most urban areas, while in 2018, the highest rates occurred in medium metro, small metro, and rural areas.
- Summary
- Definitions
- Data source and methods
- About the authors
- References
- Suggested citation
NCHS Data Brief No. 383, October 2020
PDF Versionpdf icon (703 KB)
Key findings
Data from the National Vital Statistics System, Mortality
- Age-adjusted rates of alcohol-induced deaths among adults aged 25 and over were stable from 2000 to 2006, then increased 43% from 10.7 per 100,000 in 2006 to 15.3 in 2018.
- For both males and females, alcohol-induced death rates increased at a greater rate between 2000 and 2018 in rural compared with urban areas.
- Among males, the rate of alcohol-induced deaths was highest in large central metro areas in 2000 (21.3); by 2018, rates in medium (25.1) and small metro (25.9), micropolitan (26.7), and noncore (25.3) areas were highest.
- Among females, the rate of alcohol-induced deaths in noncore areas (4.4) was among the lowest in 2000; by 2018, rates in noncore areas had more than doubled (9.9).
Excessive alcohol consumption is a well-known risk factor for mortality and has been causally linked to many diseases, conditions and injuries, including alcohol-attributable cancer, liver cirrhosis, and alcohol poisonings (1). Alcohol-induced deaths, or deaths from dependent and nondependent use of alcohol, as well as accidental poisoning by alcohol (2), have been increasing in the United States since 1999 with differences by sex, age, urban–rural classification, and other demographic characteristics (3,4). This Data Brief focuses on alcohol-induced deaths among adults aged 25 and over, which account for more than 99% of the alcohol-induced deaths in the United States. The report presents trends from 2000 through 2018 by sex and urbanization level of county of residence.
Keywords: : urban–rural, trends, health disparities, National Vital Statistics System-Mortality (NVSS-M)
Rates for alcohol-induced deaths among persons aged 25 and over increased from 2000 through 2018.
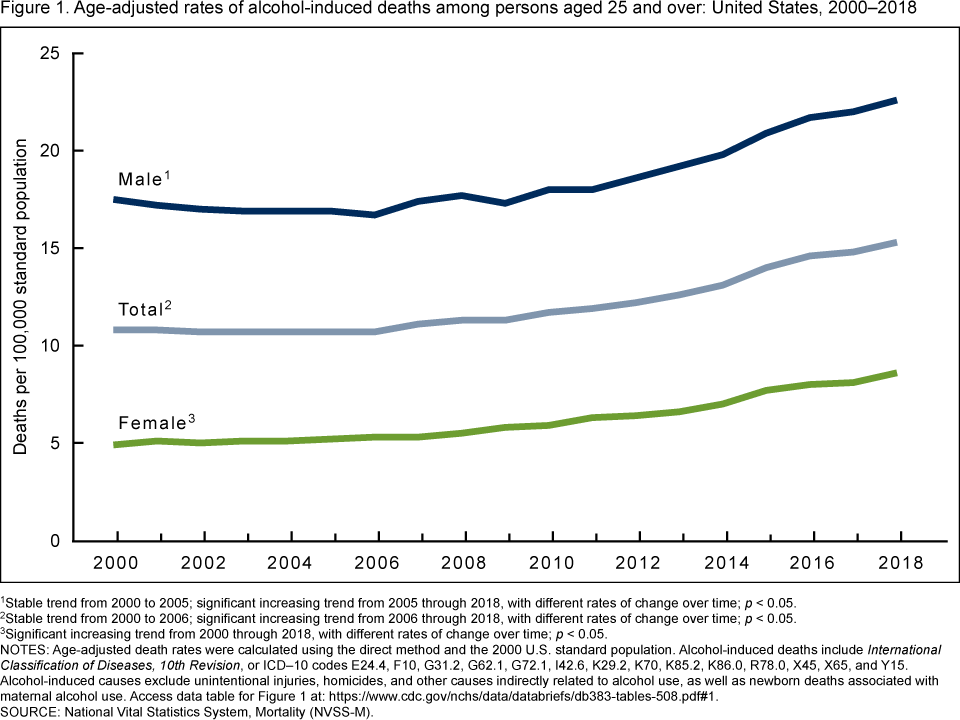
- Age-adjusted rates of alcohol-induced deaths among all persons aged 25 and over were stable from 2000 to 2006 at about 10.7 per 100,000, then increased 43% to 15.3 in 2018 (Figure 1).
- For males aged 25 and over, rates were stable from 2000 to 2005, then increased 34% from 2005 through 2018, from 16.9 to 22.6.
- For females aged 25 and over, rates increased 76% from 2000 through 2018, from 4.9 to 8.6.
- For each year, rates of alcohol-induced deaths for males aged 25 and over were higher than for females.
Figure 1. Age-adjusted rates of alcohol-induced deaths among persons aged 25 and over: United States, 2000–2018
1Stable trend from 2000 to 2005; significant increasing trend from 2005 through 2018, with different rates of change over time; p < 0.05.
2Stable trend from 2000 to 2006; significant increasing trend from 2006 through 2018, with different rates of change over time; p < 0.05.
3Significant increasing trend from 2000 through 2018, with different rates of change over time; p < 0.05.
NOTES: Age-adjusted death rates were calculated using the direct method and the 2000 U.S. standard population. Alcohol-induced deaths include International Classification of Diseases, 10th Revision, or ICD–10 codes E24.4, F10, G31.2, G62.1, G72.1, I42.6, K29.2, K70, K85.2, K86.0, R78.0, X45, X65, and Y15. Alcohol-induced causes exclude unintentional injuries, homicides, and other causes indirectly related to alcohol use, as well as newborn deaths associated with maternal alcohol use. Access data table for Figure 1pdf icon.
SOURCE: National Vital Statistics System, Mortality (NVSS-M).
The difference in alcohol-induced death rates between urban and rural areas was greater in 2018 than in 2000 for both males and females aged 25 and over.
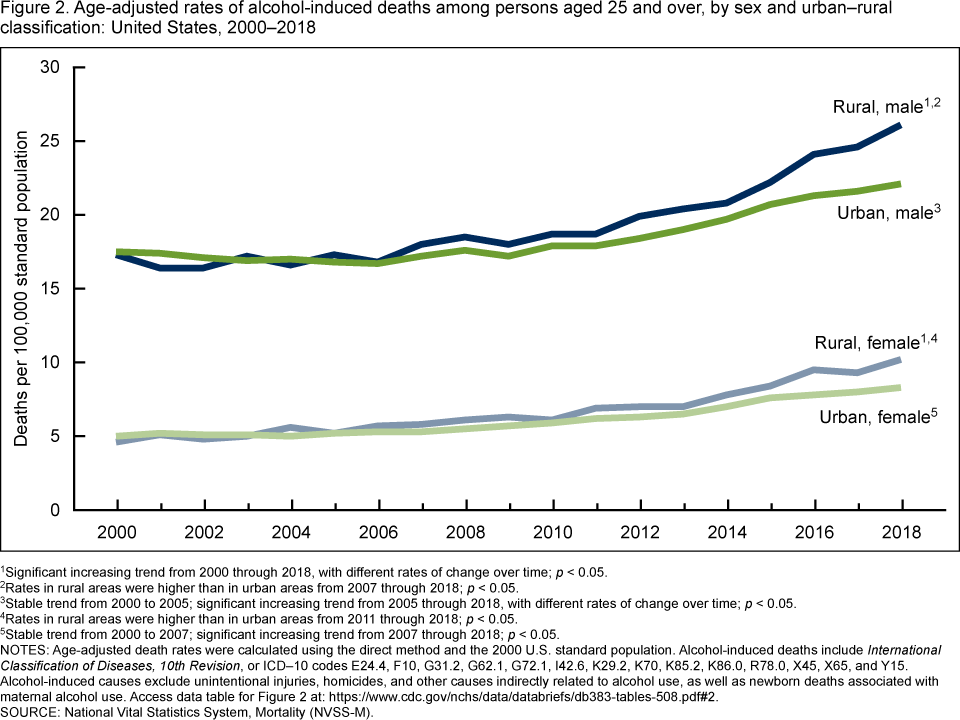
- Among males aged 25 and over, rates in urban areas were stable from 2000 to 2005, then increased 32% from 16.8 in 2005 to 22.1 in 2018. Rates in rural areas increased 51% throughout the period from 17.3 in 2000 to 26.1 in 2018 (Figure 2).
- From 2007 through 2018, rates for males in rural areas were significantly higher than rates in urban areas.
- Among females aged 25 and over, rates in urban areas were stable from 2000 to 2007, then increased 57% from 5.3 in 2007 to 8.3 in 2018. Rates in rural areas more than doubled throughout the period from 4.6 in 2000 to 10.2 in 2018.
- From 2011 through 2018, rates for females in rural areas were significantly higher than in urban areas.
Figure 2. Age-adjusted rates of alcohol-induced deaths among persons aged 25 and over, by sex and urban–rural classification: United States, 2000–2018
1Significant increasing trend from 2000 through 2018, with different rates of change over time; p < 0.05.
2Rates in rural areas were higher than in urban areas from 2007 through 2018; p < 0.05.
3Stable trend from 2000 to 2005; significant increasing trend from 2005 through 2018, with different rates of change over time; p < 0.05.
4Rates in rural areas were higher than in urban areas from 2011 through 2018; p < 0.05.
5Stable trend from 2000 to 2007; significant increasing trend from 2007 through 2018; p < 0.05.
NOTES: Age-adjusted death rates were calculated using the direct method and the 2000 U.S. standard population. Alcohol-induced deaths include International Classification of Diseases, 10th Revision, or ICD–10 codes E24.4, F10, G31.2, G62.1, G72.1, I42.6, K29.2, K70, K85.2, K86.0, R78.0, X45, X65, and Y15. Alcohol-induced causes exclude unintentional injuries, homicides, and other causes indirectly related to alcohol use, as well as newborn deaths associated with maternal alcohol use. Access data table for Figure 2pdf icon.
SOURCE: National Vital Statistics System, Mortality (NVSS-M).
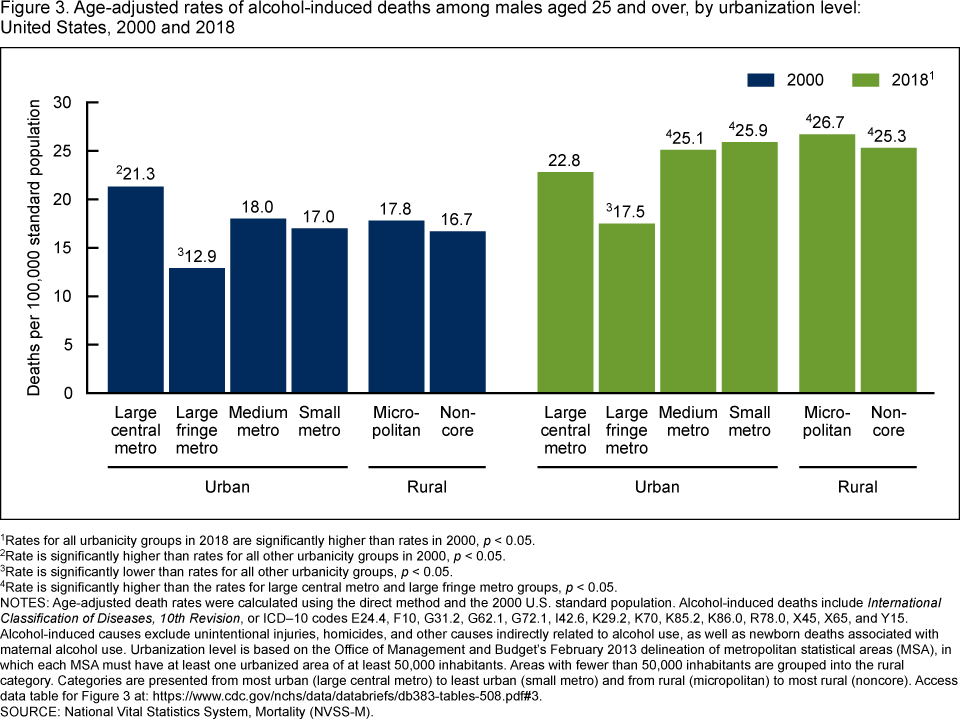
In 2000, the highest rates of alcohol-induced deaths among males aged 25 and over occurred in the most urban areas, while in 2018, the highest rates occurred in medium metro, small metro, and rural areas.
- In 2000, the highest rate for males was in large central metro counties (21.3) and lowest in large fringe metro areas (12.9); rates in medium metro (18.0), small metro (17.0), and rural areas (17.8 in micropolitan and 16.7 in noncore areas) were similar (Figure 3).
- In 2018, the pattern of rates by urbanicity changed from 2000, with the highest rates in medium metro (25.1), small metro (25.9), micropolitan (26.7), and noncore (25.3) areas.
- Rates of alcohol-induced deaths for males aged 25 and over were higher in 2018 than in 2000 for every urbanization level.
Figure 3. Age-adjusted rates of alcohol-induced deaths among males aged 25 and over, by urbanization level: United States, 2000 and 2018
1Rates for all urbanicity groups in 2018 are significantly higher than rates in 2000, p < 0.05.
2Rate is significantly higher than rates for all other urbanicity groups in 2000, p < 0.05.
3Rate is significantly lower than rates for all other urbanicity groups, p < 0.05.
4Rate is significantly higher than the rates for large central metro and large fringe metro groups, p < 0.05.
NOTES: Age-adjusted death rates were calculated using the direct method and the 2000 U.S. standard population. Alcohol-induced deaths include International Classification of Diseases, 10th Revision, or ICD–10 codes E24.4, F10, G31.2, G62.1, G72.1, I42.6, K29.2, K70, K85.2, K86.0, R78.0, X45, X65, and Y15. Alcohol-induced causes exclude unintentional injuries, homicides, and other causes indirectly related to alcohol use, as well as newborn deaths associated with maternal alcohol use. Urbanization level is based on the Office of Management and Budget’s February 2013 delineation of metropolitan statistical areas (MSA), in which each MSA must have at least one urbanized area of at least 50,000 inhabitants. Areas with fewer than 50,000 inhabitants are grouped into the rural category. Categories are presented from most urban (large central metro) to least urban (small metro) and from rural (micropolitan) to most rural (noncore). Access data table for Figure 3pdf icon.
SOURCE: National Vital Statistics System, Mortality (NVSS-M).
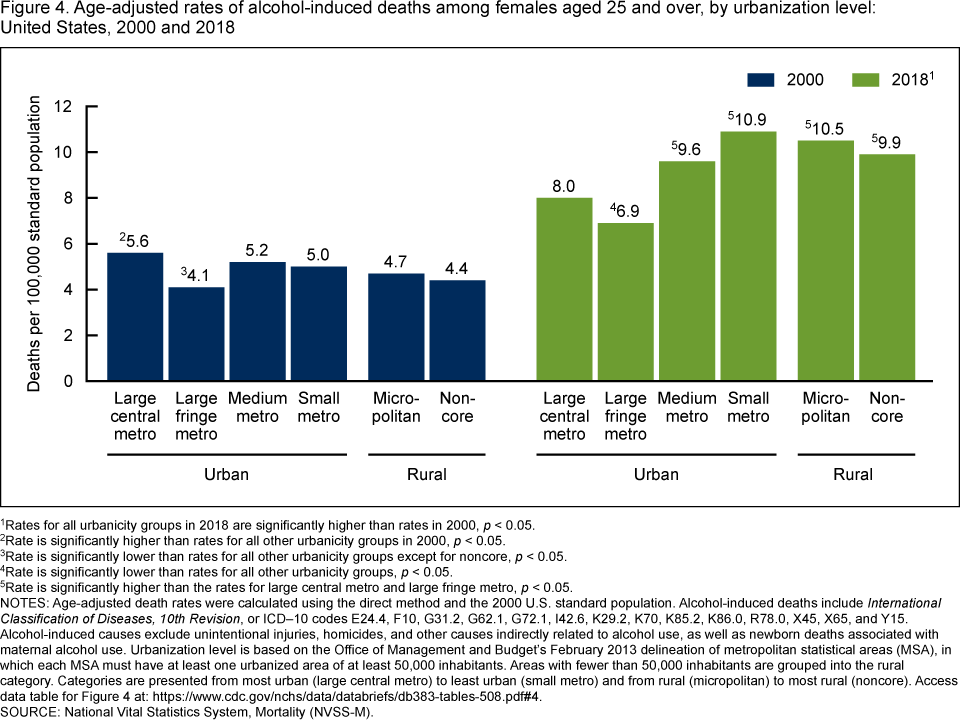
In 2000, the highest rates of alcohol-induced deaths among females aged 25 and over occurred in the most urban areas, while in 2018, the highest rates occurred in medium metro, small metro, and rural areas.
- In 2000, the rate of alcohol-induced mortality among females was highest in large central metro counties (5.6). Rates were lowest in large fringe metro (4.1) and noncore (4.4) counties; the rates for noncore, small metro (5.0), and micropolitan (4.7) counties were statistically similar (Figure 4).
- Rates of alcohol-induced deaths for females aged 25 and over were higher in 2018 than in 2000 for every urbanization level.
In 2018, rates for females were higher in medium metro (9.6), small metro (10.9), micropolitan (10.5), and noncore (9.9) areas than in large central metro (8.0) and large fringe metro areas. The lowest rates for females occurred in large fringe metro areas (6.9).
Figure 4. Age-adjusted rates of alcohol-induced deaths among females aged 25 and over, by urbanization level: United States, 2000 and 2018
1Rates for all urbanicity groups in 2018 are significantly higher than rates in 2000, p < 0.05.
2Rate is significantly higher than rates for all other urbanicity groups in 2000, p < 0.05.
3Rate is significantly lower than rates for all other urbanicity groups except for noncore, p < 0.05.
4Rate is significantly lower than rates for all other urbanicity groups, p < 0.05.
5Rate is significantly higher than the rates for large central metro and large fringe metro, p < 0.05.
NOTES: Age-adjusted death rates were calculated using the direct method and the 2000 U.S. standard population. Alcohol-induced deaths include International Classification of Diseases, 10th Revision, or ICD–10 codes E24.4, F10, G31.2, G62.1, G72.1, I42.6, K29.2, K70, K85.2, K86.0, R78.0, X45, X65, and Y15. Alcohol-induced causes exclude unintentional injuries, homicides, and other causes indirectly related to alcohol use, as well as newborn deaths associated with maternal alcohol use. Urbanization level is based on the Office of Management and Budget’s February 2013 delineation of metropolitan statistical areas (MSA), in which each MSA must have at least one urbanized area of at least 50,000 inhabitants. Areas with fewer than 50,000 inhabitants are grouped into the rural category. Categories are presented from most urban (large central metro) to least urban (small metro) and from rural (micropolitan) to most rural (noncore). Access data table for Figure 4pdf icon.
SOURCE: National Vital Statistics System, Mortality (NVSS-M).
Summary
This report describes trends in rates of alcohol-induced deaths among adults aged 25 and over from 2000 through 2018, with a focus on differences by sex and urbanization level of the decedent’s county of residence. Rates overall and rates for males and females increased over the period. While rates were higher for males than females for each year, the rate of change was greater for females, resulting in a narrowing of the differences between male and female rates. In 2000, the rate for males was 3.6 times the rate for females (17.5 and 4.9, respectively); in 2018, the rate for males was 2.6 times the rate for females (22.6 and 8.6, respectively).
From 2000 through 2018, greater percentage increases in the rates occurred in rural areas compared with urban areas overall, for both males and females. In more recent years, rates of alcohol-induced deaths were higher in rural areas than urban areas; by 2018, rates were 18% higher for males and 23% higher for females in rural compared with urban areas. Rates increased between 2000 and 2018 for all urbanization level groups among males and females. Among males, the rate in large central metro areas was highest in 2000 whereas the rate in large fringe metro areas (suburban) was lowest. Similar to men, rates were highest in large central metro areas among females in 2000; however, rates in noncore areas were lowest, along with large fringe metro areas. By 2018, rates for small metro, medium metro, and rural areas were higher than for large central metro and fringe metro areas among both males and females, with greater magnitudes of change among women (i.e., rates more than doubled in small metro, micropolitan, and noncore areas).
Definitions
Alcohol-induced deaths: Deaths from dependent and nondependent use of alcohol, as well as accidental poisoning by alcohol (2). These deaths include underlying International Classification of Diseases, 10th Revision, or ICD–10 cause-of-death codes E24.4, F10, G31.2, G62.1, G72.1, I42.6, K29.2, K70, K85.2, K86.0, R78.0, X45, X65, and Y15 (2,5). The definition of alcohol-induced deaths differs from the definition of 100% alcohol-attributable causes of death listed in the Alcohol-Related Diseases Impact (ARDI) application (6). The rates of alcohol-attributable deaths based on ARDI may be higher because it draws from a broader list of underlying and multiple-cause-of-death codes than deaths with an alcohol-induced cause of death.
Urbanization level: Urbanization level of the decedent’s county of residence was categorized using the 2013 NCHS Urban–Rural Classification Scheme for Counties (7). In this scheme, counties are classified into six urbanization levels based primarily on metropolitan–nonmetropolitan status and population distribution. Metropolitan (urban) counties include large central counties, the fringes of large counties (suburbs), medium counties, and small counties. Nonmetropolitan (rural) counties include micropolitan statistical areas and noncore areas, including open countryside, rural towns (populations of less than 2,500), and areas with populations of 2,500–49,999 that are not part of larger labor market areas.
Data source and methods
The National Vital Statistics System multiple-cause-of-death mortality data from 2000–2018 (7) were used to examine alcohol-induced deaths among adults. In each year of the study period (2000–2018), 99% of alcohol-induced deaths occurred among those aged 25 and over; therefore, this report focuses on that population.
Alcohol-induced deaths are classified using the International Classification of Diseases, 10th Revision, or ICD–10 underlying cause-of-death codes (5): E24.4, alcohol-induced pseudo-Cushing’s syndrome; F10, mental and behavioral disorders due to alcohol use; G31.2, degeneration of nervous system due to alcohol; G62.1, alcoholic polyneuropathy; G72.1, alcoholic myopathy; I42.6, alcoholic cardiomyopathy; K29.2, alcoholic gastritis; K70, alcoholic liver disease; K85.2, alcohol-induced acute pancreatitis; K86.0, alcohol-induced chronic pancreatitis; R78.0, finding of alcohol in blood; X45, accidental poisoning by and exposure to alcohol; X65, intentional self-poisoning by and exposure to alcohol; Y15, poisoning by and exposure to alcohol, undetermined intent. Alcohol-induced causes exclude unintentional injuries, homicides, and other causes indirectly related to alcohol use, as well as newborn deaths associated with maternal alcohol use. This case definition for alcohol-induced deaths is consistent with reports of annual alcohol-induced mortality rates by NCHS as well as other publications describing alcohol-induced trends in mortality data (2–4).
Age-adjusted death rates were calculated using the direct method and adjusted to the 2000 standard population (2). Trends in age-adjusted death rates were evaluated using the Joinpoint Regression Program (Version 4.7.0.0) (9). Joinpoint software fitted weighted least-squares regression models to the rates on the log transform scale. The permutation tests for model (number of joinpoints) significance were set at an overall alpha level of 0.05 (9). Pairwise comparisons of rates (e.g., age-adjusted rates for males compared with females) were conducted using the z test with an alpha level of 0.05 (9).
About the authors
Merianne Rose Spencer is with the National Center for Health Statistics (NCHS), Division of Analysis and Epidemiology. Sally C. Curtin is with NCHS, Division of Vital Statistics. Holly Hedegaard is with NCHS, Division of Analysis and Epidemiology.
References
- Rehm J, Shield KD. Global alcohol-attributable deaths from cancer, liver cirrhosis, and injury in 2010. Alcohol Res 35(2):174–83. 2013.
- Kochanek KD, Murphy SL, Xu JQ, Arias E. Deaths: Final data for 2017pdf icon. National Vital Statistics Reports; vol 68 no 9. Hyattsville, MD: National Center for Health Statistics. 2019.
- Spillane S, Shiels MS, Best AF, Haozous EA, Withrow DR, Chen Y, et al. Trends in alcohol-induced deaths in the United States, 2000–2016external icon. JAMA Netw Open 3(2):e1921451. 2020.
- Curtin SC, Spencer MR. QuickStats: Rate of alcohol-induced deaths among persons aged ≥ 25 years, by age group—National Vital Statistics System, 1999–2017. MMWR Morb Mortal Wkly Rep 68(33):734. 2019
- World Health Organization. International statistical classification of diseases and related health problems, 10th revision (ICD–10). 2008 ed. Geneva, Switzerland. 2009.
- Centers for Disease Control and Prevention. Alcohol and public health: Alcohol-related disease impact (ARDI) home. 2020.
- Ingram DD, Franco SJ. 2013 NCHS urban–rural classification scheme for countiespdf icon. National Center for Health Statistics. Vital Health Stat 2(166). 2014.
- National Center for Health Statistics. CDC WONDER: About underlying cause of death, 1999–2018. 2020.
- National Cancer Institute. Joinpoint Regression Program (Version 4.7.0.0) [computer software]. 2019.
Suggested citation
Spencer MR, Curtin SC, Hedegaard H. Rates of alcohol-induced deaths among adults aged 25 and over in rural and urban areas: United States, 2000–2018. NCHS Data Brief, no 383. Hyattsville, MD: National Center for Health Statistics. 2020.
Copyright information
All material appearing in this report is in the public domain and may be reproduced or copied without permission; citation as to source, however, is appreciated.
National Center for Health Statistics
Brian C. Moyer, Ph.D., Director
Amy M. Branum, Ph.D., Acting Associate Director for Science
Division of Analysis and Epidemiology
Irma E. Arispe, Ph.D., Director
Kevin C. Heslin, Ph.D., Associate Director for Science
Division of Vital Statistics
Steven Schwartz, Ph.D., Director
Isabelle Horon, Dr.P.H., Acting Associate Director for Science