Reasons for Being Uninsured Among Adults Aged 18–64 in the United States, 2019
- Key findings
- The percentage of adults aged 18–64 who were uninsured varied by selected characteristics.
- Among adults aged 18–64, the reasons for being uninsured included not affordable, not eligible, do not need or want, signing up was too difficult or confusing, cannot find plan that meets needs, and applied but has not started.
- The percentage of adults aged 18–64 who were uninsured because coverage was not affordable varied by selected characteristics.
- The percentage of adults aged 18–64 who were uninsured because they were not eligible for coverage varied by selected characteristics.
- The percentage of adults aged 18–64 who were uninsured because coverage was not needed or wanted varied by selected characteristics.
- Summary
- Definitions
- Data source and methods
- About the authors
- References
- Suggested citation
NCHS Data Brief No. 382, September 2020
PDF Version (432 KB)
Key findings
Data from the National Health Interview Survey
- In 2019, 14.5% of adults aged 18–64 were uninsured in the United States.
- Among uninsured adults aged 18–64, the most common reason for being currently uninsured was that coverage was not affordable.
- The percentage of uninsured adults who were uninsured because coverage was not affordable increased with age, from 66.8% among those aged 18–29 to 80.9% among those aged 50–64.
- Hispanic adults (30.4%) were more likely than non-Hispanic white adults (22.3%) to indicate that they were uninsured due to ineligibility.
- Men (26.8%) were more likely than women (14.6%) to indicate that they were uninsured because coverage was not needed or wanted.
Previously published data from the National Health Interview Survey (NHIS) reported that the percentage of uninsured adults aged 18–64 significantly decreased from 20.4% in 2013 to 13.3% in 2018 (1). Lack of health insurance has been associated with not receiving preventive services or screenings and may, in turn, lead to delays in disease diagnosis and poorer health outcomes (2). The 2019 NHIS included six questions for uninsured adults to better understand their reasons for currently being uninsured. This report describes the characteristics of uninsured adults aged 18–64 in 2019 and the percentage who identified with each of the six reasons for being uninsured. For the three most prevalent reasons, the percentage who identified with each reason is presented by selected demographic characteristics, and health status.
Keywords: health insurance, lack of coverage, National Health Interview Survey
The percentage of adults aged 18–64 who were uninsured varied by selected characteristics.
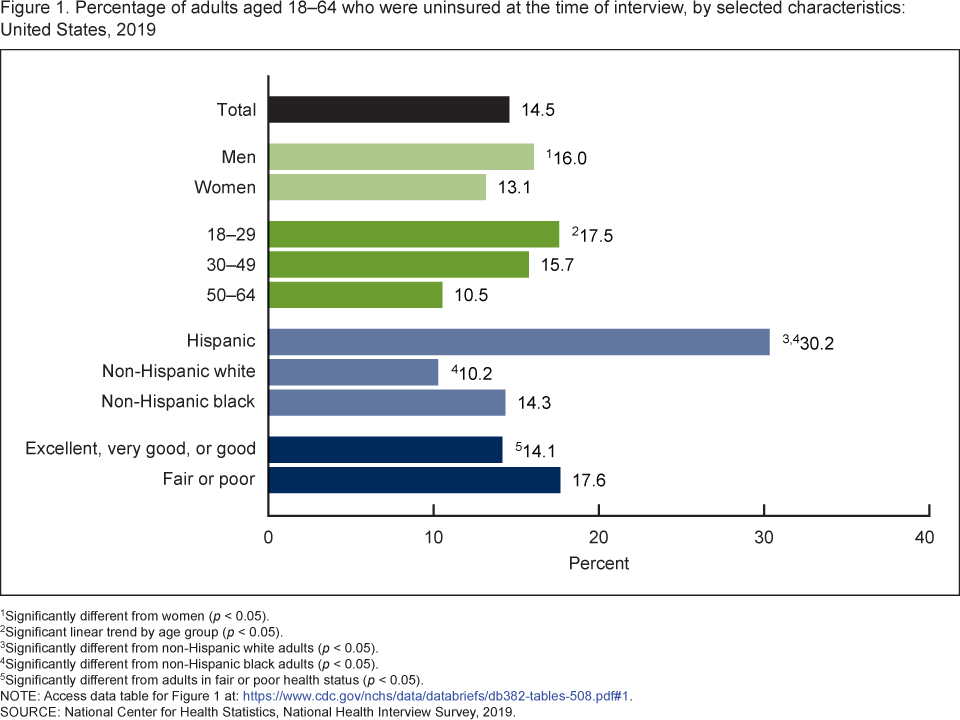
- Among adults aged 18–64, 14.5% were uninsured at the time of interview, and men (16.0%) were more likely than women (13.1%) to be uninsured (Figure 1).
- The percentage of adults who were uninsured decreased with age, from 17.5% among those aged 18–29 to 10.5% among those aged 50–64.
- Hispanic adults (30.2%) were more likely than non-Hispanic black (14.3%) and non-Hispanic white (10.2%) adults to be uninsured. Non-Hispanic black adults were more likely than non-Hispanic white adults to be uninsured.
- Adults in fair or poor health (17.6%) were more likely than adults in excellent, very good, or good health (14.1%) to be uninsured.
Figure 1. Percentage of adults aged 18–64 who were uninsured at the time of interview, by selected characteristics: United States, 2019
1Significantly different from women (p < 0.05).
2Significant linear trend by age group (p < 0.05).
3Significantly different from non-Hispanic white adults (p < 0.05).
4Significantly different from non-Hispanic black adults (p < 0.05).
5Significantly different from adults in fair or poor health status (p < 0.05).
NOTE: Access data table for Figure 1.
SOURCE: National Center for Health Statistics, National Health Interview Survey, 2019.
Among adults aged 18–64, the reasons for being uninsured included not affordable, not eligible, do not need or want, signing up was too difficult or confusing, cannot find plan that meets needs, and applied but has not started.
- Among uninsured adults aged 18–64, the most common reason for being uninsured, affecting approximately 7 in 10 (73.7%), was because they perceived that coverage was not affordable (Figure 2).
- Among uninsured adults aged 18–64, 25.3% indicated that they were not eligible for coverage, followed by not needing or wanting coverage (21.3%), signing up was too difficult or confusing (18.4%), could not find a plan that meets their needs (18.0%), and applied for coverage, but it has not started yet (8.5%).
Figure 2. Percentage of adults aged 18–64 who identified with selected reasons for being currently uninsured: United States, 2019
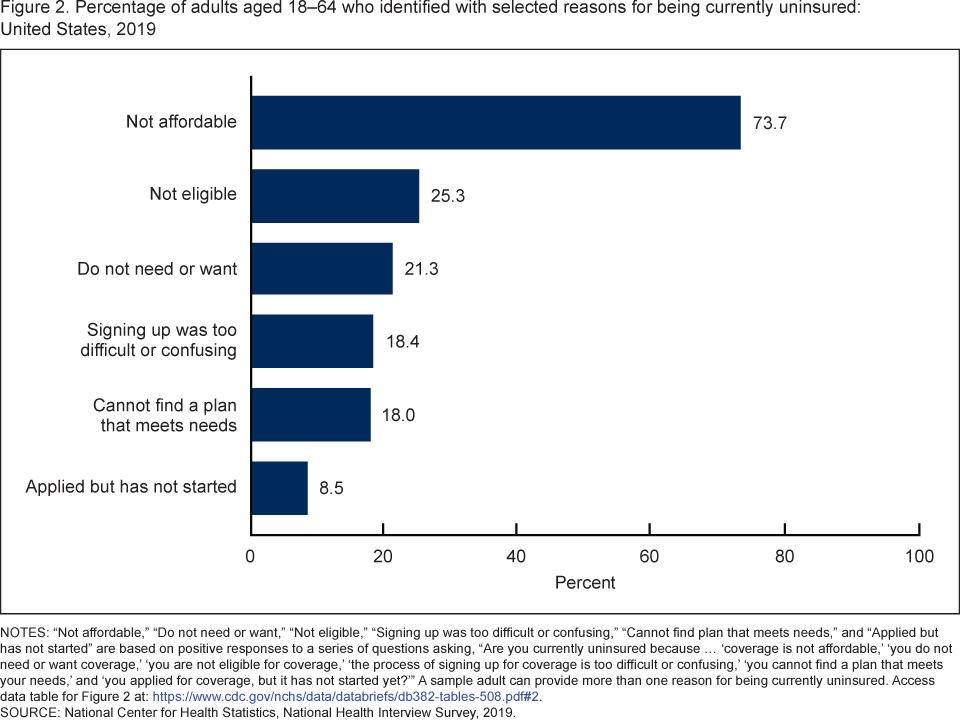
NOTES: “Not affordable,” “Do not need or want,” “Not eligible,” “Signing up was too difficult or confusing,” “Cannot find plan that meets needs,” and “Applied but has not started” are based on positive responses to a series of questions asking, “Are you currently uninsured because … ‘coverage is not affordable,’ ‘you do not need or want coverage,’ ‘you are not eligible for coverage,’ ‘the process of signing up for coverage is too difficult or confusing,’ ‘you cannot find a plan that meets your needs,’ and ‘you applied for coverage, but it has not started yet?’” A sample adult can provide more than one reason for being currently uninsured. Access data table for Figure 2.
SOURCE: National Center for Health Statistics, National Health Interview Survey, 2019.
The percentage of adults aged 18–64 who were uninsured because coverage was not affordable varied by selected characteristics.
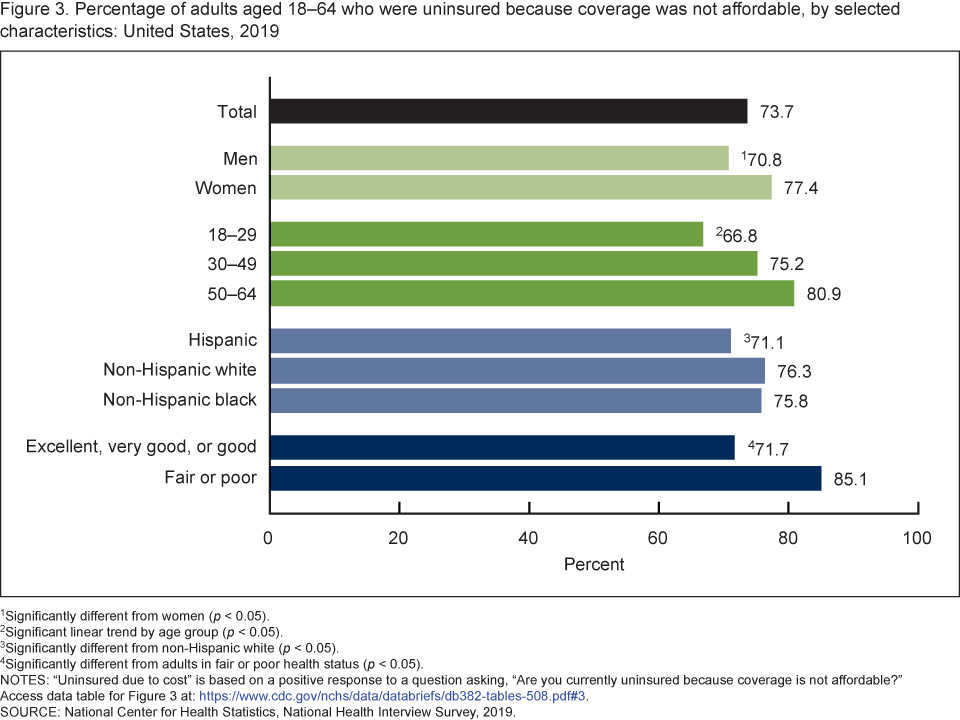
- Women (77.4%) were more likely than men (70.8%) to be currently uninsured due to coverage affordability (Figure 3).
- The percentage of adults who were currently uninsured because coverage was not affordable increased with age, from 66.8% among those aged 18–29 to 80.9% among those aged 50–64.
- Non-Hispanic white adults (76.3%) were more likely than Hispanic adults (71.1%) to be currently uninsured because coverage was not affordable. However, the observed difference between Hispanic (71.1%) and non-Hispanic black (75.8%) adults, was not statistically significant.
- Adults in fair or poor health (85.1%) were more likely to be uninsured due to affordability than those in excellent, very good, or good health (71.7%).
Figure 3. Percentage of adults aged 18–64 who were uninsured because coverage was not affordable, by selected characteristics: United States, 2019
1Significantly different from women (p < 0.05).
2Significant linear trend by age group (p < 0.05).
3Significantly different from non-Hispanic white (p < 0.05).
4Significantly different from adults in fair or poor health status (p < 0.05).
NOTES: “Uninsured due to cost” is based on a positive response to a question asking, “Are you currently uninsured because coverage is not affordable?” Access data table for Figure 3.
SOURCE: National Health Interview Survey, 2019.
The percentage of adults aged 18–64 who were uninsured because they were not eligible for coverage varied by selected characteristics.
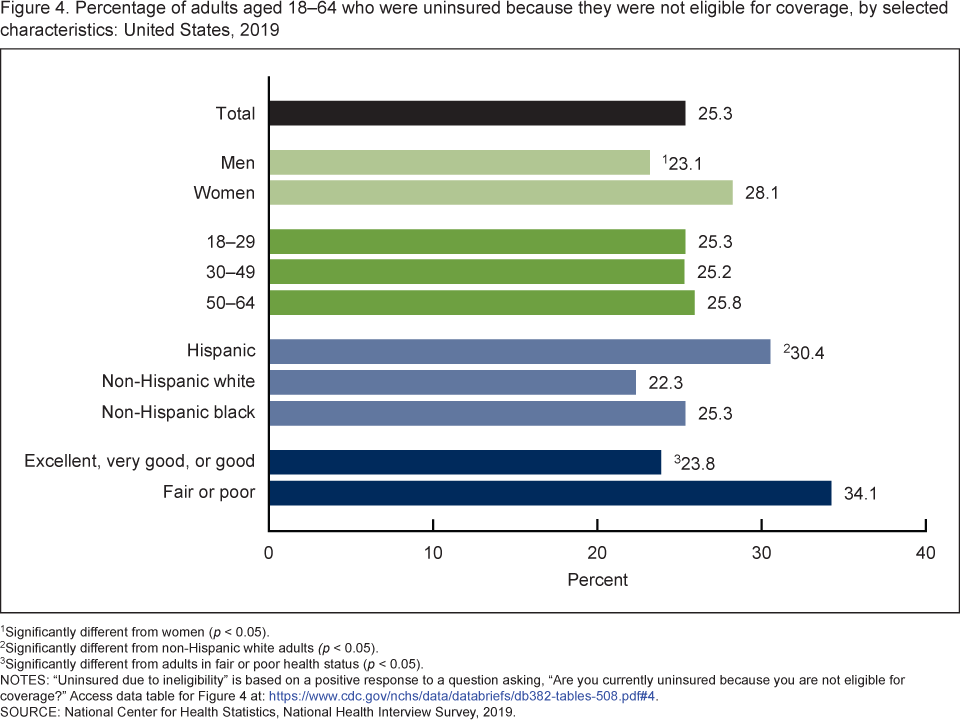
- Women (28.1%) were more likely than men (23.1%) to be currently uninsured because they were not eligible for coverage (Figure 4).
- The percentage of adults who were currently uninsured because they were not eligible for coverage was higher among Hispanic (30.4%) than non-Hispanic white (22.3%) adults. However, the observed difference between Hispanic (30.4%) and non-Hispanic black (25.3%) adults was not statistically significant.
- Adults in fair or poor health (34.1%) were more likely than those in excellent, very good, or good health (23.8%) to be uninsured because they were not eligible for coverage.
Figure 4. Percentage of adults aged 18–64 who were uninsured because they were not eligible for coverage, by selected characteristics: United States, 2019
1Significantly different from women (p < 0.05).
2Significantly different from non-Hispanic white adults (p < 0.05).
3Significantly different from adults in fair or poor health status (p < 0.05).
NOTES: “Uninsured due to ineligibility” is based on a positive response to a question asking, “Are you currently uninsured because you are not eligible for coverage?” Access data table for Figure 4.
SOURCE: National Center for Health Statistics, National Health Interview Survey, 2019.
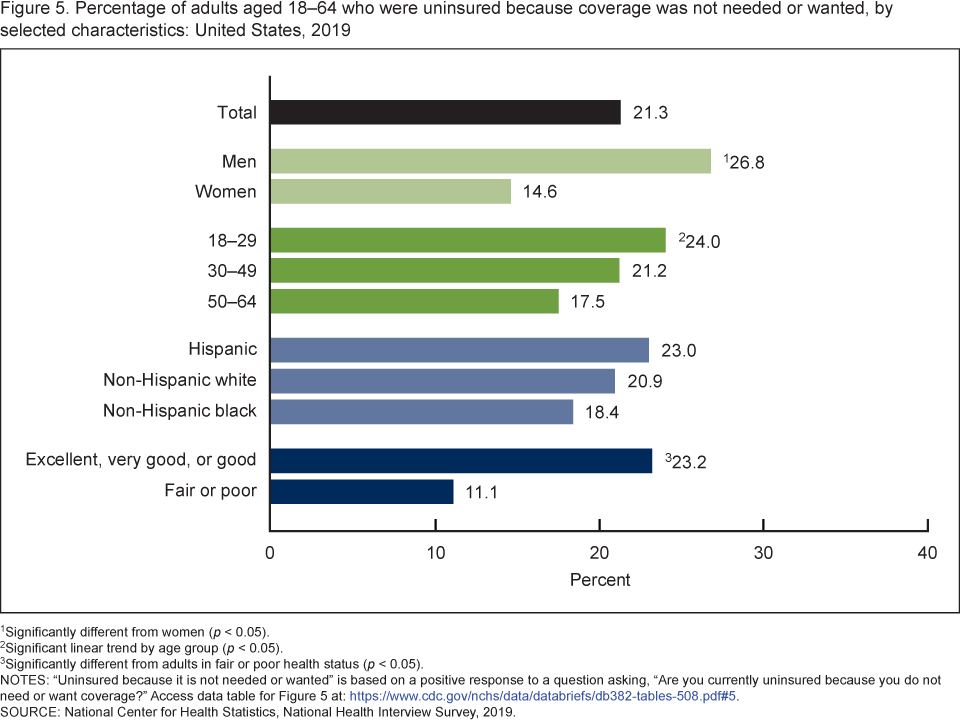
The percentage of adults aged 18–64 who were uninsured because coverage was not needed or wanted varied by selected characteristics.
- Among uninsured adults aged 18–64, men (26.8%) were more likely than women (14.6%) to be currently uninsured because coverage was not needed or wanted (Figure 5).
- The percentage of adults who were currently uninsured because coverage was not needed or wanted decreased with age, from 24.0% among those aged 18–29 to 17.5% among those aged 50–64.
- Among uninsured adults aged 18–64, those in excellent, very good, or good health (23.2%) were twice as likely as those in fair or poor health (11.1%) to indicate that they were uninsured because coverage was not needed or wanted.
- The percentage of adults who were currently uninsured because coverage was not needed or wanted did not differ significantly by race and ethnicity.
Figure 5. Percentage of adults aged 18–64 who were uninsured because coverage was not needed or wanted, by selected characteristics: United States, 2019
1Significantly different from women (p < 0.05).
2Significant linear trend by age group (p < 0.05).
3Significantly different from adults in fair or poor health status (p < 0.05).
NOTES: “Uninsured because it is not needed or wanted” is based on a positive response to a question asking, “Are you currently uninsured because you do not need or want coverage?” Access data table for Figure 5.
SOURCE: National Center for Health Statistics, National Health Interview Survey, 2019.
Summary
In 2019, 14.5% of adults aged 18–64 were uninsured at the time of interview. Among uninsured adults aged 18–64, the most common reason for being currently uninsured was because they perceived that they could not afford the cost of coverage, followed by not being eligible, not wanting coverage, the process of signing up was too difficult or confusing, could not find a plan that meets their needs, and they signed up for coverage, but the plan has not started yet. In 2019, the percentage of adults who were uninsured due to cost was higher among women, adults aged 50–64, and adults in fair or poor health. The percentage of adults who were uninsured due to ineligibility did not vary by age but was higher among women and adults in fair or poor health. In contrast, the percentage of adults who were uninsured because coverage was not needed or wanted was higher among men, adults aged 18–29, and adults with excellent, very good, or good health. Individuals without health insurance experience barriers to health care such as not having a usual source of care and postponing or forgoing care due to cost, which may lead to negative health outcomes (2,3).
Definitions
Health status: Adult respondents were asked to assess their health status, specifically, whether their “health in general is excellent, very good, good, fair, or poor?”
Race and ethnicity: Categories shown for non-Hispanic respondents are only for those who selected one racial group; respondents had the option to select more than one racial group. Hispanic respondents might be of any race or combination of races. Only selected groups are shown in the individual race and ethnicity bars, but total bars show results for all adults aged 18–64.
Reasons for being currently uninsured: “Not affordable,” “Do not need or want,” “Not eligible,” “Signing up was too difficult or confusing,” “Cannot find plan that meets needs,” and “Applied but has not started” are based on positive responses to a series of questions asking, “Are you currently uninsured because … ‘coverage is not affordable,’ ‘you do not need or want coverage,’ ‘you are not eligible for coverage,’ ‘the process of signing up for coverage is too difficult or confusing,’ ‘you cannot find a plan that meets your needs,’ and ‘you applied for coverage but it has not started yet?’”
Uninsured: Adults were considered uninsured if they did not have private health insurance, Medicare, Medicaid, State Children’s Health Insurance Program (CHIP), a state-sponsored health plan, other government programs, or military health plans (includes TRICARE, VA, and Civilian Health and Medical Program of VA [CHAMP-VA]) at the time of interview.
Data source and methods
This analysis used data from the Sample Adult component of 2019 National Health Interview Survey (NHIS). NHIS is a nationally representative, household survey of the civilian noninstitutionalized U.S. population. In 2019, the NHIS questionnaire was redesigned to better meet the needs of data users. Additional questions on reasons for being uninsured were added to learn more about those who are uninsured. The survey is conducted continuously throughout the year by the National Center for Health Statistics (NCHS). Interviews are conducted in the respondent’s home, but follow-ups to complete interviews may be conducted by telephone when necessary. For more information about NHIS, visit the survey website.
Point estimates and the corresponding variances were calculated using SAS-callable SUDAAN version 11.0 (RTI International, Research Triangle Park, N.C.) to account for the complex sample design of NHIS. All estimates in this report met NCHS standards of reliability as specified in the “National Center for Health Statistics Data Presentation Standards for Proportions” (4). Tests for trend were evaluated using orthogonal polynomials in logistic regression. Differences between percentages were evaluated using two-sided significance tests at the 0.05 level.
About the authors
Amy E. Cha and Robin A. Cohen are with the National Center for Health Statistics, Division of Health Interview Statistics.
References
- Cohen RA, Terlizzi EP, Martinez ME. Health insurance coverage: Early release of estimates from the National Health Interview Survey, 2018. National Center for Health Statistics. 2019.
- Freeman JD, Kadiyala S, Bell JF, Martin DP. The causal effect of health insurance on utilization and outcomes in adults: A systematic review of U.S. studies. Med Care 46(10):1023–32. 2008.
- Tolbert J, Orgera K, Singer N, Damico A. Key facts about the uninsured population. Kaiser Family Foundation. 2019.
- Parker JD, Talih M, Malec DJ, Beresovsky B, Carroll M, Gonzalez Jr. JF, et al. National Center for Health Statistics data presentation standards for proportions. National Center for Health Statistics. Vital Health Stat 2(175). 2017.
Suggested citation
Cha AE, Cohen RA. Reasons for being uninsured among adults aged 18–64 in the United States, 2019. NCHS Data Brief, no 382. Hyattsville, MD: National Center for Health Statistics. 2020.
Copyright information
All material appearing in this report is in the public domain and may be reproduced or copied without permission; citation as to source, however, is appreciated.
National Center for Health Statistics
Brian C. Moyer, Ph.D., Director
Amy M. Branum, Ph.D., Acting Associate Director for Science
Division of Health Interview Statistics
Stephen J. Blumberg, Ph.D., Director
Anjel Vahratian, Ph.D., M.P.H., Associate Director for Science