Prevalence of Obesity and Severe Obesity Among Adults: United States, 2017–2018
- Key findings
- What was the prevalence of obesity among adults in 2017–2018?
- Were there differences in the prevalence of obesity among adults by race and Hispanic origin in 2017–2018?
- What was the prevalence of severe obesity among adults in 2017–2018?
- What are the trends in obesity and severe obesity among adults?
- Summary
- Definition
- Data source and methods
- About the authors
- References
- Suggested citation
NCHS Data Brief No. 360, February 2020
PDF Versionpdf icon (402 KB) | Visual Abstract
Key findings
Data from the National Health and Nutrition Examination Survey
- In 2017–2018, the age-adjusted prevalence of obesity in adults was 42.4%, and there were no significant differences between men and women among all adults or by age group.
- The age-adjusted prevalence of severe obesity in adults was 9.2% and was higher in women than in men.
- Among adults, the prevalence of both obesity and severe obesity was highest in non-Hispanic black adults compared with other race and Hispanic-origin groups.
- The prevalence of severe obesity was highest among adults aged 40–59 compared with other age groups.
- From 1999–2000 through 2017–2018, the prevalence of both obesity and severe obesity increased among adults.
Obesity is associated with serious health risks (1). Severe obesity further increases the risk of obesity-related complications, such as coronary heart disease and end-stage renal disease (2,3). From 1999–2000 through 2015–2016, a significantly increasing trend in obesity was observed (4). This report provides the most recent national data for 2017–2018 on obesity and severe obesity prevalence among adults by sex, age, and race and Hispanic origin. Trends from 1999–2000 through 2017–2018 for adults aged 20 and over are also presented.
Keywords: body mass index (BMI), trends, National Health and Nutrition Examination Survey (NHANES)
What was the prevalence of obesity among adults in 2017–2018?
The age-adjusted prevalence of obesity among U.S. adults was 42.4% in 2017–2018. The prevalence was 40.0% among younger adults aged 20–39, 44.8% among middle-aged adults aged 40–59, and 42.8% among older adults aged 60 and over. There were no significant differences in prevalence by age group (Figure 1).
Among men, the prevalence of obesity was 40.3% among those aged 20–39, 46.4% among those aged 40–59, and 42.2% among those aged 60 and over. Among women, the prevalence of obesity was 39.7% among those aged 20–39, 43.3% among those aged 40–59, and 43.3% among those aged 60 and over. None of the differences by age were significant.
There was no significant difference in the prevalence of obesity between men and women overall or by age group.
Figure 1. Prevalence of obesity among adults aged 20 and over, by sex and age: United States, 2017–2018
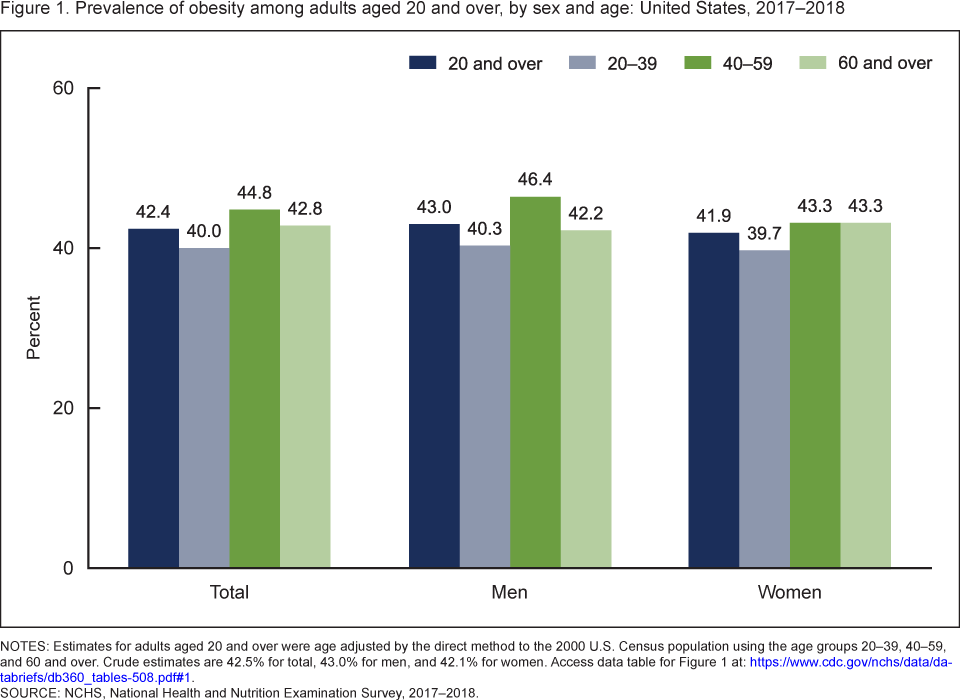
NOTES: Estimates for adults aged 20 and over were age adjusted by the direct method to the 2000 U.S. Census population using the age groups 20–39, 40–59, and 60 and over. Crude estimates are 42.5% for total, 43.0% for men, and 42.1% for women. Access data table for Figure 1pdf icon.
SOURCE: NCHS, National Health and Nutrition Examination Survey, 2017–2018.
Were there differences in the prevalence of obesity among adults by race and Hispanic origin in 2017–2018?
The prevalence of obesity was lowest among non-Hispanic Asian adults (17.4%) compared with non-Hispanic white (42.2%), non-Hispanic black (49.6%), and Hispanic (44.8%) adults. Non-Hispanic black adults had the highest prevalence of obesity compared with all other race and Hispanic-origin groups.
Among men, the prevalence of obesity was lowest in non-Hispanic Asian (17.5%) compared with non-Hispanic white (44.7%), non-Hispanic black (41.1%), and Hispanic (45.7%) men, but there were no significant differences among non-Hispanic white, non-Hispanic black, and Hispanic men (Figure 2). The prevalence of obesity was lowest among non-Hispanic Asian women (17.2%) compared with non-Hispanic white (39.8%), Hispanic (43.7%), and non-Hispanic black (56.9%) women, and prevalence among non-Hispanic black women was higher than all other groups.
Non-Hispanic black women had a higher prevalence of obesity than non-Hispanic black men. There were no significant differences in prevalence between men and women among non-Hispanic white, non-Hispanic Asian, or Hispanic adults.
Figure 2. Age-adjusted prevalence of obesity among adults aged 20 and over, by sex and race and Hispanic origin: United States, 2017–2018
image icon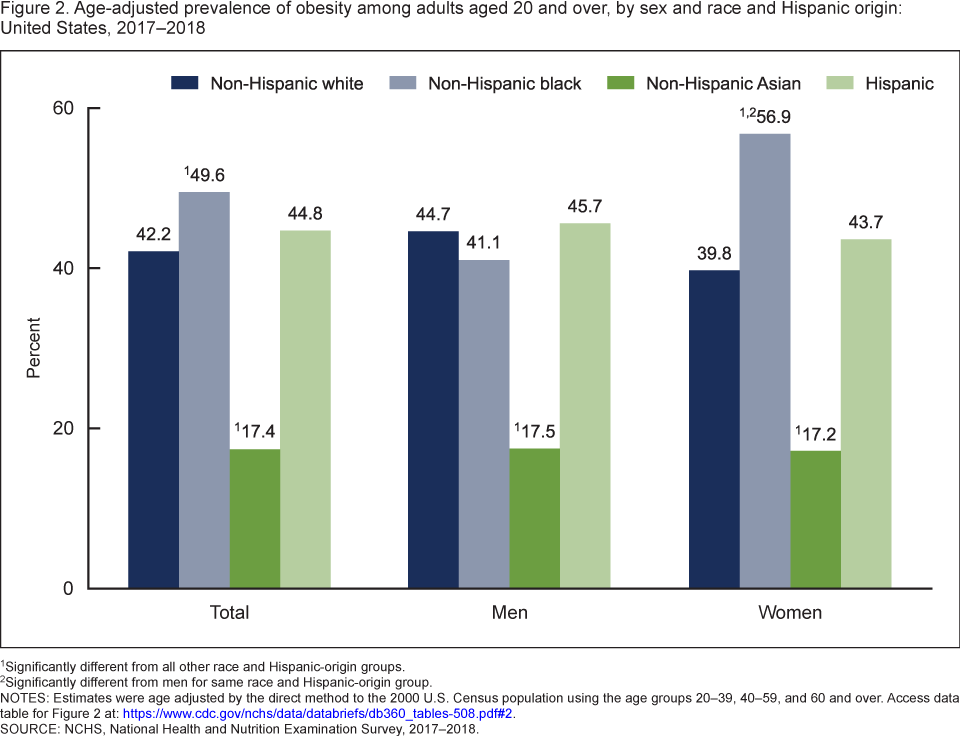 image icon
1Significantly different from all other race and Hispanic-origin groups.
2Significantly different from men for same race and Hispanic-origin group.
NOTES: Estimates were age adjusted by the direct method to the 2000 U.S. Census population using the age groups 20–39, 40–59, and 60 and over. Access data table for Figure 2pdf icon.
SOURCE: NCHS, National Health and Nutrition Examination Survey, 2017–2018.
What was the prevalence of severe obesity among adults in 2017–2018?
The age-adjusted prevalence of severe obesity among U.S. adults was 9.2% in 2017–2018. Women had a higher prevalence of severe obesity (11.5%) than men (6.9%). The prevalence was highest among adults aged 40–59 (11.5%), followed by adults aged 20–39 (9.1%) and adults aged 60 and over (5.8%). Non-Hispanic black adults had the highest prevalence of severe obesity (13.8%), and non-Hispanic Asian adults had the lowest (2.0%) (Figure 3).
Figure 3. Age-adjusted prevalence of severe obesity among adults aged 20 and over, by sex, age, and race and Hispanic origin: United States, 2017–2018
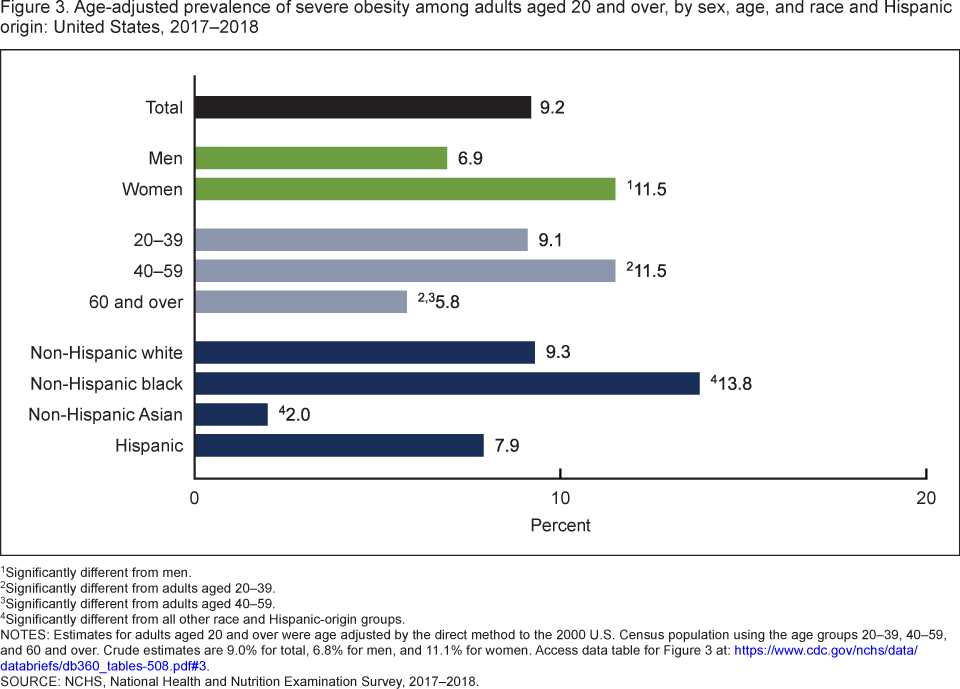
1Significantly different from men.
2Significantly different from adults aged 20–39.
3Significantly different from adults aged 40–59.
4Significantly different from all other race and Hispanic-origin groups.
NOTES: Estimates for adults aged 20 and over were age adjusted by the direct method to the 2000 U.S. Census population using the age groups 20–39, 40–59, and 60 and over. Crude estimates are 9.0% for total, 6.8% for men, and 11.1% for women. Access data table for Figure 3pdf icon.
SOURCE: NCHS, National Health and Nutrition Examination Survey, 2017–2018.
What are the trends in obesity and severe obesity among adults?
From 1999–2000 through 2017–2018, the age-adjusted prevalence of obesity increased from 30.5% to 42.4%, and the prevalence of severe obesity increased from 4.7% to 9.2%. The observed changes in prevalence of obesity and severe obesity between 2015–2016 and 2017–2018 were not significant (Figure 4).
Figure 4. Trends in age-adjusted obesity and severe obesity prevalence among adults aged 20 and over: United States, 1999–2000 through 2017–2018
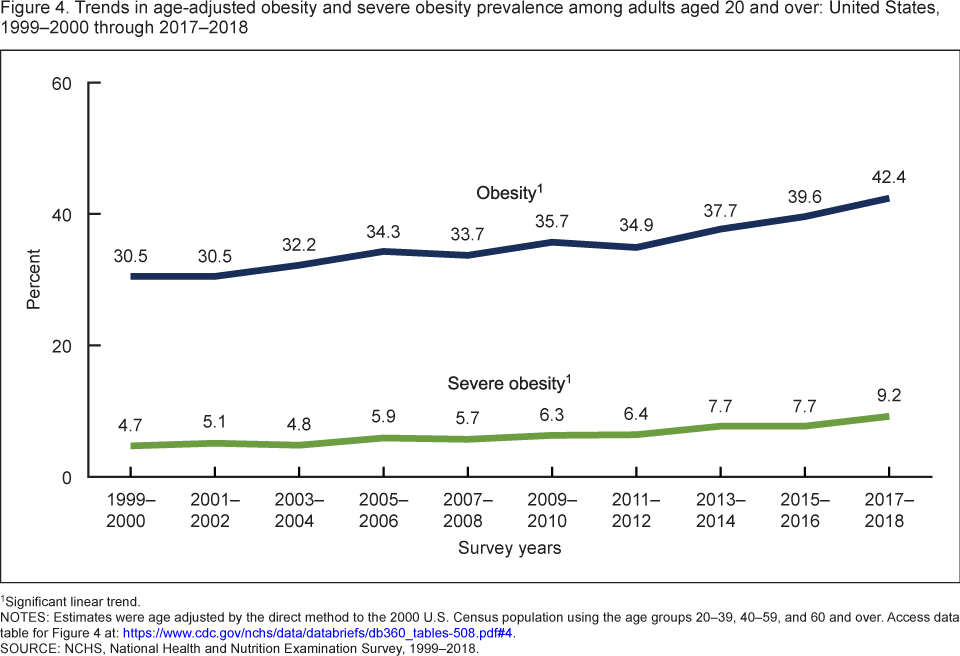
1Significant linear trend.
NOTES: Estimates were age adjusted by the direct method to the 2000 U.S. Census population using the age groups 20–39, 40–59, and 60 and over. Access data table for Figure 4pdf icon.
SOURCE: NCHS, National Health and Nutrition Examination Survey, 1999–2018.
Summary
The age-adjusted prevalence of obesity was 42.4%, and the age-adjusted prevalence of severe obesity was 9.2% among adults aged 20 and over in the United States in 2017–2018. The overall prevalence of obesity was similar among men and women, but the prevalence of severe obesity was higher among women. Adults aged 40–59 had the highest prevalence of severe obesity.
The prevalence of obesity was highest among non-Hispanic black adults compared with other race and Hispanic-origin groups, overall and among women. However, among men, the prevalence of obesity was not significantly different between non-Hispanic white, non-Hispanic black, and Hispanic men. Overall, and among men and women, obesity was lowest among non-Hispanic Asian adults. Non-Hispanic black adults had the highest prevalence of severe obesity, and non-Hispanic Asian adults had the lowest.
From 1999–2000 through 2017–2018, the prevalence of obesity and severe obesity increased, but the observed increase in the prevalence of obesity and severe obesity between 2015–2016 and 2017–2018 was not significant.
Monitoring the prevalence of obesity and severe obesity is relevant for public health programs that focus on reducing or preventing obesity and its consequences. In the United States, the prevalence of obesity among adults has moved further away from the Healthy People 2020 goal of 30.5% (5).
Definition
Obesity and severe obesity: Body mass index (BMI) was calculated as weight in kilograms divided by height in meters squared, rounded to one decimal place. Obesity in adults was defined as a BMI of greater than or equal to 30 and severe obesity as a BMI of greater than or equal to 40.
Data source and methods
Data from the National Health and Nutrition Examination Surveys (NHANES) for the years 1999–2000, 2001–2002, 2003–2004, 2005–2006, 2007–2008, 2009–2010, 2011–2012, 2013–2014, 2015–2016, and 2017–2018 were used for these analyses. Data from NHANES 2017–2018 were used to test differences between subgroups. This 2-year NHANES survey cycle provides the most recent estimates of obesity. However, the precision of the estimated prevalence of obesity and severe obesity and the ability to detect differences in the prevalence when a difference does exist are lower than when these estimates are based on 4 years of data because of the smaller sample sizes. For these reasons, the sex-specific, 2-year estimates for severe obesity prevalence by age and race and Hispanic origin were not reported. In testing for trends in obesity, orthogonal contrasts were used with 10, 2-year cycles: 1999–2000, 2001–2002, 2003–2004, 2005–2006, 2007–2008, 2009–2010, 2011–2012, 2013–2014, 2015–2016, and 2017–2018.
NHANES is a cross-sectional survey designed to monitor the health and nutritional status of the civilian noninstitutionalized U.S. population (6). The survey consists of interviews conducted in participants’ homes and standardized physical examinations conducted in mobile examination centers.
The NHANES sample is selected through a complex, multistage probability design. In 2011–2018, non-Hispanic black, non-Hispanic Asian, and Hispanic persons, among other groups, were oversampled to obtain reliable estimates for these population subgroups. Race- and Hispanic-origin-specific estimates reflect individuals reporting only one race; those reporting more than one race are included in the total but are not reported separately.
Although obesity was defined using BMI, this index does not measure body fat directly. The relationship between BMI and body fat depends on body composition and varies by sex, age, and race and Hispanic origin (7,8). Health risks may vary among different race and Hispanic-origin groups at the same BMI.
Examination sample weights, which account for the differential probabilities of selection, nonresponse, and noncoverage, were incorporated into the estimation process. All variance estimates accounted for the complex survey design by using Taylor series linearization. Pregnant women were excluded from analyses.
Age-adjusted prevalence estimates were adjusted using the direct method to the 2000 projected U.S. Census population using the age groups 20–39, 40–59, and 60 and over to compare prevalence estimates between subgroups that differ with respect to their age distributions. Differences between groups were tested using a univariate t statistic at the p < 0.05. significance level. All differences reported are statistically significant unless otherwise indicated. Adjustments were not made for multiple comparisons. Data management and statistical analyses were conducted using SAS System for Windows version 9.4 (SAS Institute, Inc., Cary, N.C.), SUDAAN version 11.0 (RTI International, Research Triangle Park, N.C.), and R version 3.5.2, including the R “survey” package (9), to account for the complex sample design.
About the authors
Craig M. Hales, Margaret D. Carroll, Cheryl D. Fryar, and Cynthia L. Ogden are with the National Center for Health Statistics, Division of Health and Nutrition Examination Surveys.
References
- National Heart, Lung, and Blood Institute. Managing overweight and obesity in adults: Systematic evidence review from the Obesity Expert Panel.pdf iconexternal icon 2013.
- Li TY, Rana JS, Manson JE, Willett WC, Stampfer MJ, Colditz GA, et al. Obesity as compared with physical activity in predicting risk of coronary heart disease in women. Circulation 113(4):499–506. 2006.
- Hsu CY, McCulloch CE, Iribarren C, Darbinian J, Go AS. Body mass index and risk for end-stage renal disease. Ann Intern Med 144(1):21–8. 2006.
- Hales CM, Fryar CD, Carroll MD, Ogden CL. Prevalence of obesity among adults and youth: United States, 2015–2016. NCHS Data Brief no 288. Hyattsville, MD: National Center for Health Statistics. 2017.
- U.S. Department of Health and Human Services. Office of Disease Prevention and Health Promotion. Healthy People 2020 topics and objectives: Nutrition and weight statusexternal icon. 2020.
- Johnson CL, Dohrmann SM, Burt VL, Mohadjer LK. National Health and Nutrition Examination Survey: Sample design, 2011–2014pdf icon. National Center for Health Statistics. Vital Health Stat 2 (162). 2014.
- Deurenberg P, Deurenberg-Yap M, Guricci S. Asians are different from caucasians and from each other in their body mass index/body fat per cent relationship. Obes Rev 3(3):141–6. 2002.
- Flegal KM, Ogden CL, Yanovski JA, Freedman DS, Shepherd JA, Graubard BI, Borrud LG. High adiposity and high body mass index-for-age in U.S. children and adolescents overall and by race-ethnic group. Am J Clin Nutr 91(4):1020–26. 2010.
- RTI International. SUDAAN version 11.0 and R version 3.5.2 [computer program]. 2019.
Suggested citation
Hales CM, Carroll MD, Fryar CD, Ogden CL. Prevalence of obesity and severe obesity among adults: United States, 2017–2018. NCHS Data Brief, no 360. Hyattsville, MD: National Center for Health Statistics. 2020
Copyright information
All material appearing in this report is in the public domain and may be reproduced or copied without permission; citation as to source, however, is appreciated.
National Center for Health Statistics
Jennifer H. Madans, Ph.D., Acting Director
Amy M. Branum, Ph.D., Acting Associate Director for Science
Division of Health and Nutrition Examination Surveys
Ryne Paulose-Ram, M.A., Ph.D., Acting Director
Lara Akinbami, M.D., Acting Associate Director for Science