Problems Paying Medical Bills, 2018
- Key findings
- The percentage of persons who were in families having problems paying medical bills in the past 12 months decreased from 2011 through 2018.
- In 2018, the percentages of persons who were in families having problems paying medical bills in the past 12 months varied by demographic characteristics.
- Among persons under age 65, those who were uninsured were more likely than those who had Medicaid or private coverage to be in families having problems paying medical bills in the past 12 months.
- Among adults aged 65 and over, the percentages of those who were in families having problems paying medical bills varied by health insurance type.
- Summary
- Definitions
- Data source and methods
- About the authors
- References
- Suggested citation
NCHS Data Brief No. 357, February 2020
PDF Versionpdf icon (423 KB)
Key findings
Data from the National Health Interview Survey
- Overall, the percentage of persons who were in families having problems paying medical bills in the past 12 months decreased from 19.7% in 2011 to 14.2% in 2018.
- In 2018, the percentage of persons who were in families having problems paying medical bills was higher among females (14.7%), children (16.2%), and non-Hispanic black persons (20.6%) compared with males, adults, and other racial and ethnic groups, respectively.
- Among persons under age 65, those who were uninsured were more likely than those with Medicaid or private coverage to have problems paying medical bills.
- Among adults aged 65 and over, those with Medicare and Medicaid, and Medicare only were more likely than those with Medicare Advantage or private coverage to have problems paying medical bills.
Previously published data from the National Health Interview Survey (NHIS) found that in 2017 one in seven persons under age 65 was in a family having problems paying medical bills (1). Significant expenses for one family member may adversely affect the whole family (2). People who are in families with problems paying medical bills may experience serious financial consequences, such as having problems with paying for food, clothing, or housing, and filing for bankruptcy (3). Health insurance coverage status (i.e., uninsured, public coverage, or private coverage) may also impact the ability to afford health care costs (4). This report examines characteristics of persons who live in families that have problems paying medical bills.
Keywords: private coverage, Medicare, Medicaid, National Health Interview Survey
The percentage of persons who were in families having problems paying medical bills in the past 12 months decreased from 2011 through 2018.
- The percentage of all persons who were in families having problems paying medical bills in the past 12 months decreased 4.5 percentage points from 19.7% in 2011 to 15.2% in 2015 and then decreased 1.0 percentage point from 2015 through 2018 (14.2%) (Figure 1).
- The percentage of all persons who were in families having problems paying medical bills did not change significantly between 2017 (14.6%) and 2018 (14.2%).
Figure 1. Percentage of persons who were in families having problems paying medical bills in the past 12 months, by year: United States, 2011–2018
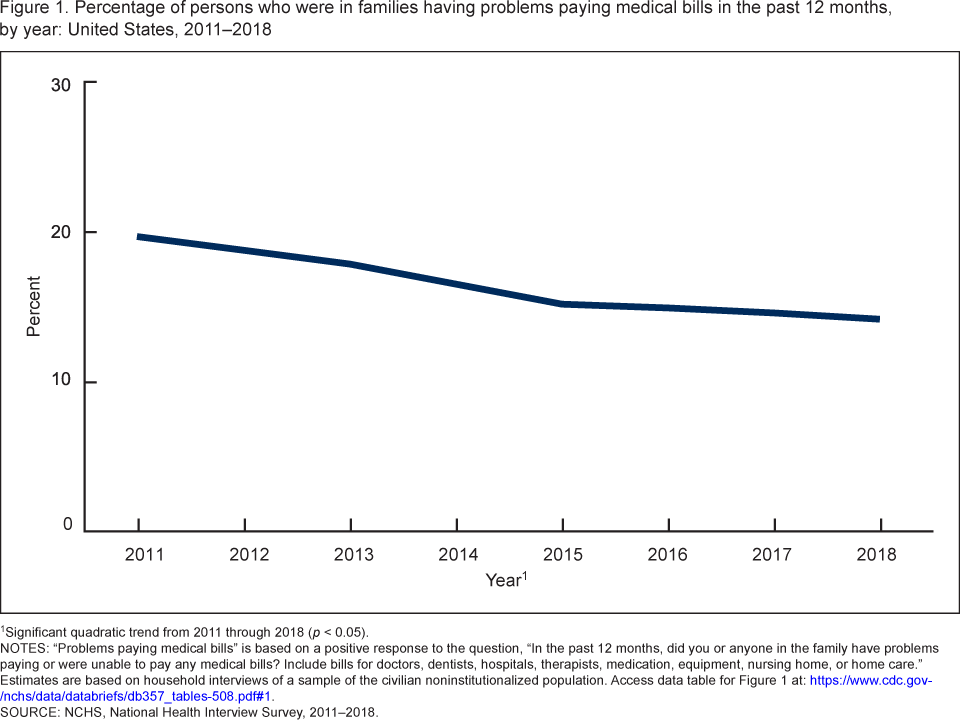
1Significant quadratic trend from 2011 through 2018 (p < 0.05).
NOTES: “Problems paying medical bills” is based on a positive response to the question, “In the past 12 months, did you or anyone in the family have problems paying or were unable to pay any medical bills? Include bills for doctors, dentists, hospitals, therapists, medication, equipment, nursing home, or home care.” Estimates are based on household interviews of a sample of the civilian noninstitutionalized population. Access data table for Figure 1pdf icon.
SOURCE: NCHS, National Health Interview Survey, 2011–2018.
In 2018, the percentages of persons who were in families having problems paying medical bills in the past 12 months varied by demographic characteristics.
- Females (14.7%) were more likely than males (13.8%) to be in a family having problems paying medical bills in the past 12 months (Figure 2).
- The percentage of persons who were in families having problems paying medical bills was highest among children aged 0–17 years (16.2%) and decreased as age increased.
- The percentage of persons who were in families having problems paying medical bills was highest among non-Hispanic black persons (20.6%), followed by Hispanic (15.6%), non-Hispanic white (13.0%), and non-Hispanic Asian (7.1%) persons.
Figure 2. Percentage of persons who were in families having problems paying medical bills in the past 12 months, by sex, age group, and race and ethnicity: United States, 2018
image icon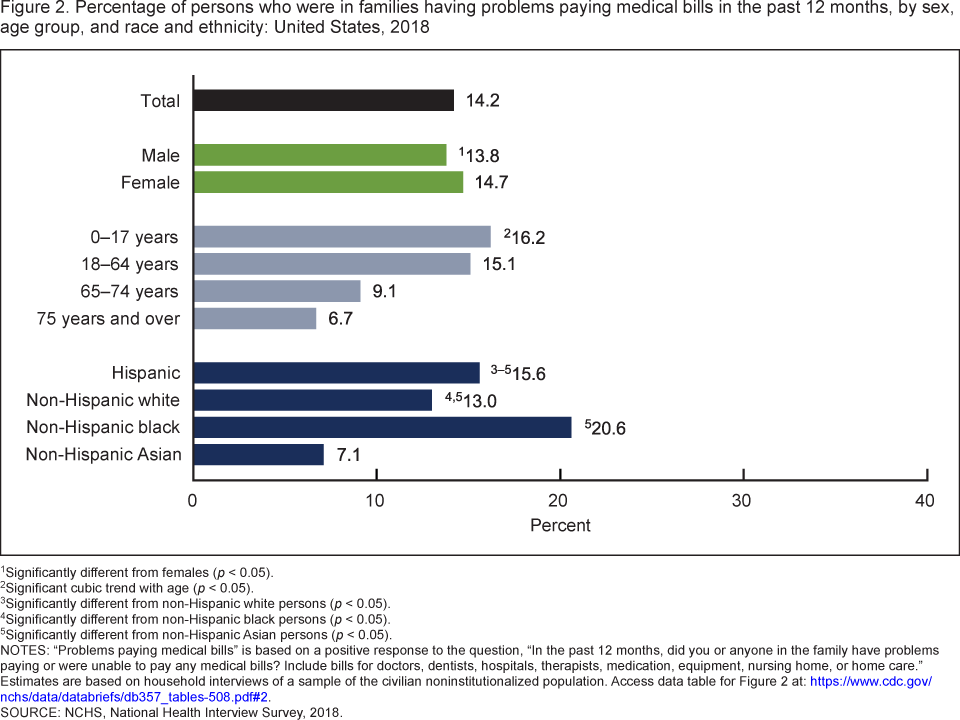 image icon
1Significantly different from females (p < 0.05).
2Significant cubic trend with age (p < 0.05).
3Significantly different from non-Hispanic white persons (p < 0.05).
4Significantly different from non-Hispanic black persons (p < 0.05).
5Significantly different from non-Hispanic Asian persons (p < 0.05).
NOTES: “Problems paying medical bills” is based on a positive response to the question, “In the past 12 months, did you or anyone in the family have problems paying or were unable to pay any medical bills? Include bills for doctors, dentists, hospitals, therapists, medication, equipment, nursing home, or home care.” Estimates are based on household interviews of a sample of the civilian noninstitutionalized population. Access data table for Figure 2pdf icon.
SOURCE: NCHS, National Health Interview Survey, 2018.
Among persons under age 65, those who were uninsured were more likely than those who had Medicaid or private coverage to be in families having problems paying medical bills in the past 12 months.
- Among persons under age 65, 27.7% of those who were uninsured, 20.1% of those with Medicaid, and 11.9% of those with private coverage were in families having problems paying medical bills in the past 12 months (Figure 3).
- Among children aged 0–17 years and adults aged 18–64, the patterns were similar to persons under age 65 years overall. Those who were uninsured were more likely to be in families having problems paying medical bills than those with Medicaid and private coverage.
Figure 3. Percentage of persons under age 65 who were in families having problems paying medical bills in the past 12 months, by age group and health insurance status: United States, 2018
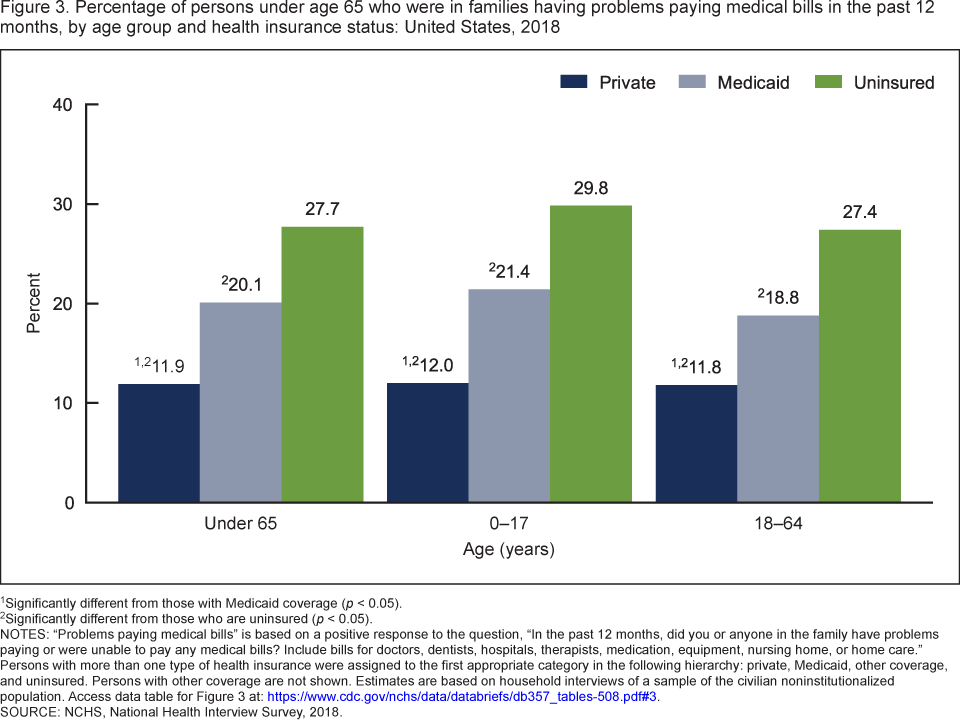
1Significantly different from those with Medicaid coverage (p < 0.05).
2Significantly different from those who are uninsured (p < 0.05).
NOTES: “Problems paying medical bills” is based on a positive response to the question, “In the past 12 months, did you or anyone in the family have problems paying or were unable to pay any medical bills? Include bills for doctors, dentists, hospitals, therapists, medication, equipment, nursing home, or home care.” Persons with more than one type of health insurance were assigned to the first appropriate category in the following hierarchy: private, Medicaid, other coverage, and uninsured. Persons with other coverage are not shown. Estimates are based on household interviews of a sample of the civilian noninstitutionalized population. Access data table for Figure 3pdf icon.
SOURCE: NCHS, National Health Interview Survey, 2018.
Among adults aged 65 and over, the percentages of those who were in families having problems paying medical bills varied by health insurance type.
- Among adults aged 65 and over, the percentages of those who were in families having problems paying medical bills in the past 12 months were higher among those with
Medicare and Medicaid (12.3%) and Medicare only (12.4%) than among those with Medicare Advantage (8.3%) or private coverage (5.6%); those with Medicare Advantage
were more likely than those with private coverage to have problems paying medical bills (Figure 4). - Among adults aged 65–74, the percentages of those who were in families having problems paying medical bills were higher among adults with Medicare and Medicaid
(14.3%) and Medicare only (13.6%) than among those with Medicare Advantage (9.1%) or private coverage (6.4%); those with Medicare Advantage were more likely than those
with private coverage to have problems paying medical bills. - Among adults aged 75 and over, the percentages of those who were in families having problems paying medical bills were higher among adults with Medicare only
(10.6%), Medicare and Medicaid (9.6%), and Medicare Advantage (7.2%) than among those with private coverage (4.2%); those with Medicare only were more likely than
those with Medicare Advantage to have problems paying medical bills.
Figure 4. Percentage of adults aged 65 and over who were in families having problems paying medical bills in the past 12 months, by age group and health insurance status: United States, 2018
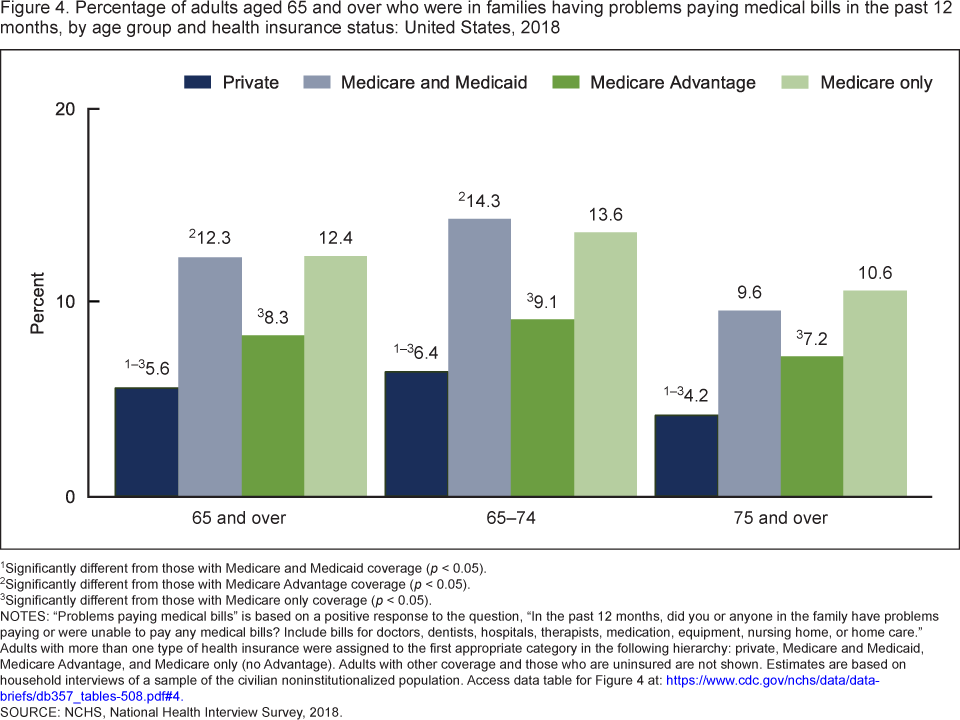
1Significantly different from those with Medicare and Medicaid coverage (p < 0.05).
2Significantly different from those with Medicare Advantage coverage (p < 0.05).
3Significantly different from those with Medicare only coverage (p < 0.05).
NOTES: “Problems paying medical bills” is based on a positive response to the question, “In the past 12 months, did you or anyone in the family have problems paying or were unable to pay any medical bills? Include bills for doctors, dentists, hospitals, therapists, medication, equipment, nursing home, or home care.” Adults with more than one type of health insurance were assigned to the first appropriate category in the following hierarchy: private, Medicare and Medicaid, Medicare Advantage, and Medicare only (no Advantage). Adults with other coverage and those who are uninsured are not shown. Estimates are based on household interviews of a sample of the civilian noninstitutionalized population. Access data table for Figure 4pdf icon.
SOURCE: NCHS, National Health Interview Survey, 2018.
Summary
In the United States, the percentage of all persons who were in families having problems paying medical bills decreased 5.5 percentage points from 19.7% in 2011 to 14.2% in 2018. In this same year, the percentage of persons who were in families having problems paying medical bills varied by sex, age, race and ethnicity, and health insurance status. Among persons of all ages, the percentage who were in families having problems paying medical bills was higher among females, children aged 0–17 years, and non-Hispanic black persons than among males, adults, and other racial and ethnic groups, respectively. Among persons under age 65, the percentage having problems paying medical bills was highest among those who were uninsured, followed by those who were covered with Medicaid and private health insurance. Among adults aged 65 and over, those with Medicare and Medicaid, and Medicare only had similar percentages of having problems paying medical bills; both were higher than those with Medicare Advantage and private coverage.
Definitions
Family: Defined in NHIS as an individual or a group of two or more related persons living together in the same housing unit. Thus, a family can consist of only one person. In some instances, unrelated persons sharing the same household, such as an unmarried couple living together, may also be considered a family.
Problems paying medical bills: Based on a positive response to the survey question, “In the past 12 months, did you or anyone in the family have problems paying or were unable to pay any medical bills? Include bills for doctors, dentists, hospitals, therapists, medication, equipment, nursing home, or home care.”
Health insurance coverage: At the time of interview, respondents reported their type(s) of coverage. This information was used to form two health insurance hierarchies: one for persons under age 65 and another for adults aged 65 and over. For persons under age 65, a hierarchy consisting of four mutually exclusive categories was developed (5). Persons with more than one type of health insurance were assigned to the first appropriate category in the following hierarchy: private coverage, Medicaid (includes state-sponsored health plans including the Children’s Health Insurance Program [CHIP]), other coverage (includes Medicare, other government, and military coverage), and uninsured. Persons with “other coverage” are included in the totals but are not shown separately.
For adults aged 65 and over, a health insurance hierarchy of six mutually exclusive categories was used (6,7). Adults with more than one type of health insurance were assigned to the first appropriate category in the following hierarchy: private coverage, Medicare and Medicaid, Medicare Advantage, Medicare only (no Advantage), other coverage, and uninsured. Due to small sample sizes, those with “other coverage” and those who are uninsured are included in the totals but are not shown separately.
Data source and methods
This analysis used data from the 2011–2018 NHIS, a nationally representative, household survey of the civilian noninstitutionalized U.S. population. It is conducted continuously throughout the year by the National Center for Health Statistics (NCHS). Interviews are conducted in the respondent’s home, but follow-ups to complete interviews may be conducted by telephone when necessary. For more information about NHIS, visit the survey website: https://www.cdc.gov/nchs/nhis.htm.
Point estimates and the corresponding variances were calculated using SAS-callable SUDAAN version 11.0 (RTI International, Research Triangle Park, N.C.) to account for the complex sample design of NHIS. All estimates in this report meet NCHS standards of reliability as specified in “National Center for Health Statistics Data Presentation Standards for Proportions” (8). Linear, quadratic, and cubic trends by year were evaluated using orthogonal polynomials in logistic regression. Differences between percentages were evaluated using two-sided significance tests at the 0.05 level.
About the authors
Amy E. Cha and Robin A. Cohen are with the National Center for Health Statistics, Division of Health Interview Statistics.
References
- Terlizzi EP, Cha AE, Cohen RA. QuickStats: Percentage of persons in families having problems paying medical bills in the past 12 months, by age group—National Health Interview Survey, 2011–2017. MMWR Morb Mortal Wkly Rep 68(14):334. 2019.
- Cohen RA, Kirzinger WK. Financial burden of medical care: A family perspective. NCHS Data Brief, no 142. Hyattsville, MD: National Center for Health Statistics. 2014.
- Sommers A, Cunningham PJ. Medical bill problems steady for U.S. families, 2007–2010. Track Rep (28):1–5. 2011.
- Cohen RA, Zammitti EP. Problems paying medical bills among persons under age 65: Early release of estimates from the National Health Interview Survey, 2011–June 2017pdf icon. National Center for Health Statistics. 2017.
- Bloom B, Simpson G, Cohen RA, Parsons PE. Access to health care part 2: Working-age adultspdf icon. National Center for Health Statistics. Vital Health Stat 10(197). 1997.
- National Center for Health Statistics. 2015 National Health Interview Survey (NHIS) public use data release: Survey descriptionpdf icon. 2016.
- National Center for Health Statistics. Technical notes for summary health statistics tables: National Health Interview Surveypdf icon.
- Parker JD, Talih M, Malec DJ, Beresovsky V, Carroll M, Gonzalez Jr. JF, et al. National Center for Health Statistics data presentation standards for proportionspdf icon. National Center for Health Statistics. Vital Health Stat 2(175). 2017.
Suggested citation
Cha AE, Cohen RA. Problems paying medical bills, 2018. NCHS Data Brief, no 357. Hyattsville, MD: National Center for Health Statistics. 2020.
Copyright information
All material appearing in this report is in the public domain and may be reproduced or copied without permission; citation as to source, however, is appreciated.
National Center for Health Statistics
Jennifer H. Madans, Ph.D., Acting Director
Amy M. Branum, Ph.D., Acting Associate Director for Science
Division of Health Interview Statistics
Stephen J. Blumberg, Ph.D., Director
Anjel Vahratian, Ph.D., M.P.H., Associate Director for Science