Drug Overdose Deaths in the United States, 1999–2018
- Key findings
- In 2018, the age-adjusted rate of drug overdose deaths in the United States was 4.6% lower than the rate in 2017.
- For 14 states and the District of Columbia, the age-adjusted rate of drug overdose deaths in 2018 was lower than in 2017.
- The age-adjusted rate of drug overdose deaths involving synthetic opioids other than methadone increased by 10% from 2017 to 2018.
- From 2012 through 2018, the age-adjusted rate of drug overdose deaths involving cocaine more than tripled, and the rate of deaths involving psychostimulants with abuse potential increased nearly 5-fold.
- Summary
- Definitions
- Data sources and methods
- About the authors
- References
- Suggested citation
NCHS Data Brief No. 356, January 2020
PDF Versionpdf icon (423 KB) | Visual Abstract
Key findings
Data from the National Vital Statistics System, Mortality
- In 2018, there were 67,367 drug overdose deaths in the United States, a 4.1% decline from 2017 (70,237 deaths).
- The age-adjusted rate of drug overdose deaths in 2018 (20.7 per 100,000) was 4.6% lower than in 2017 (21.7).
- For 14 states and the District of Columbia, the drug overdose death rate was lower in 2018 than in 2017.
- The rate of drug overdose deaths involving synthetic opioids other than methadone (drugs such as fentanyl, fentanyl analogs, and tramadol) increased by 10%, from 9.0 in 2017 to 9.9 in 2018.
- From 2012 through 2018, the rate of drug overdose deaths involving cocaine more than tripled (from 1.4 to 4.5) and the rate for deaths involving psychostimulants with abuse potential (drugs such as methamphetamine) increased nearly 5-fold (from 0.8 to 3.9).
Deaths from drug overdose continue to contribute to mortality in the United States (1–5). This report uses the most recent data from the National Vital Statistics System (NVSS) to update trends in drug overdose deaths for all drugs and for specific drugs and drug types, and to identify changes in rates by state from 2017 to 2018.
Keywords: opioids, heroin, cocaine, methamphetamine, National Vital Statistics System Mortality File
In 2018, the age-adjusted rate of drug overdose deaths in the United States was 4.6% lower than the rate in 2017.
- In 2018, there were 67,367 drug overdose deaths in the United States (Figure 1), 4.1% fewer deaths than in 2017 (70,237).
- The rate in 2018 (20.7) was 4.6% lower than the rate in 2017 (21.7).
- The age-adjusted rate of drug overdose deaths increased from 6.1 per 100,000 standard population in 1999 to 21.7 in 2017. The rate increased on average by 10% per year from 1999 through 2006, by 2% per year from 2006 through 2013, and by 14% per year from 2013 through 2016.
- For each year, rates were higher for males than females. For males, the rate increased from 8.2 in 1999 to 29.1 in 2017, then decreased to 27.9 in 2018. For females, the rate increased from 3.9 in 1999 to 14.4 in 2017, then decreased to 13.6 in 2018.
Figure 1. Age-adjusted drug overdose death rates, by sex: United States, 1999–2018
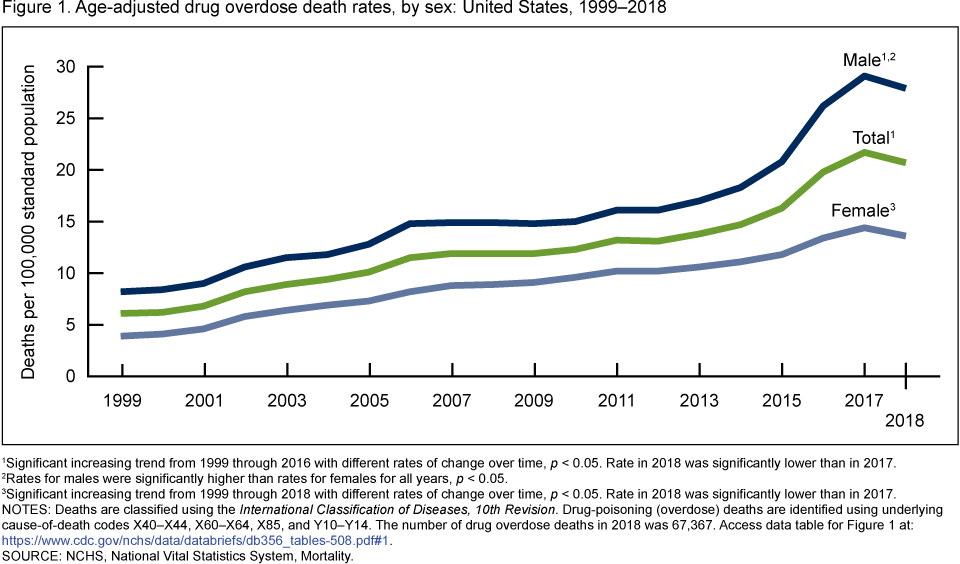
1Significant increasing trend from 1999 through 2016 with different rates of change over time, p < 0.05. Rate in 2018 was significantly lower than in 2017.
2Rates for males were significantly higher than rates for females for all years, p < 0.05.
3Significant increasing trend from 1999 through 2018 with different rates of change over time, p < 0.05. Rate in 2018 was significantly lower than in 2017.
NOTES: Deaths are classified using the International Classification of Diseases, 10th Revision. Drug-poisoning (overdose) deaths are identified using underlying cause-of-death codes X40–X44, X60–X64, X85, and Y10–Y14. The number of drug overdose deaths in 2018 was 67,367. Access data table for Figure 1pdf icon.
SOURCE: NCHS, National Vital Statistics System, Mortality.
For 14 states and the District of Columbia, the age-adjusted rate of drug overdose deaths in 2018 was lower than in 2017.
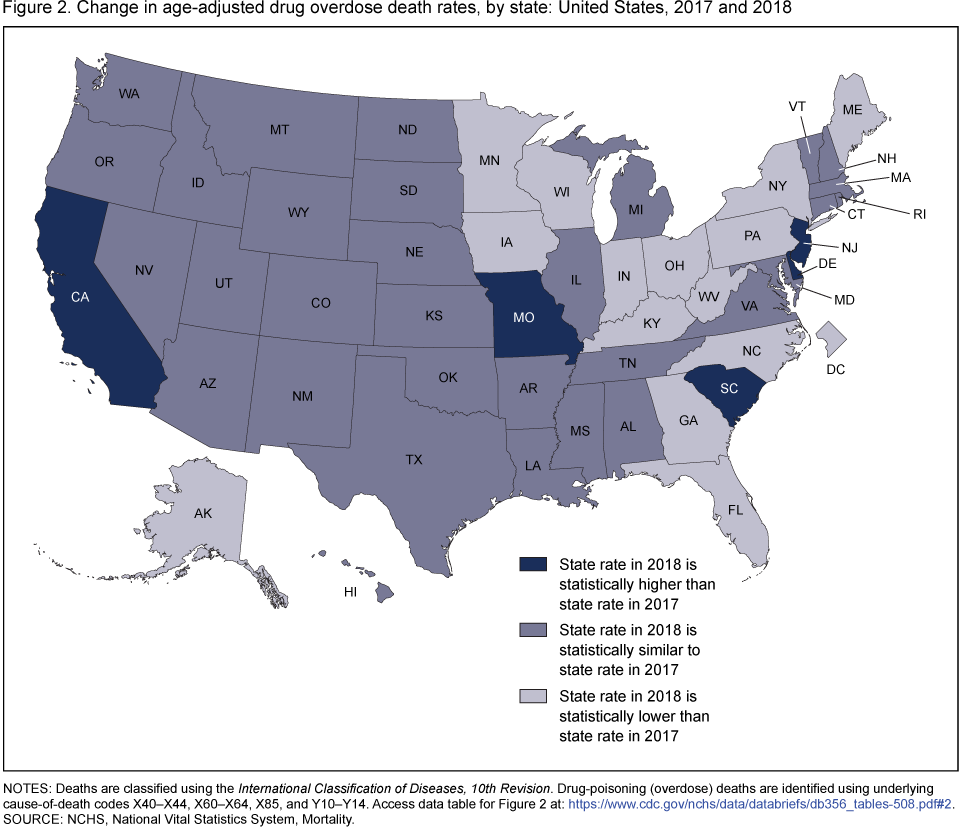
- The drug overdose death rate was lower in 2018 than in 2017 for 15 jurisdictions: Alaska, the District of Columbia, Florida, Georgia, Indiana, Iowa, Kentucky, Maine, Minnesota, New York, North Carolina, Ohio, Pennsylvania, West Virginia, and Wisconsin (Figure 2).
- The drug overdose death rate was higher in 2018 than in 2017 for 5 states: California, Delaware, Missouri, New Jersey, and South Carolina.
- In 2018, the states with the highest age-adjusted drug overdose death rates were West Virginia (51.5 per 100,000 standard population), Delaware (43.8), Maryland (37.2), Pennsylvania (36.1), Ohio (35.9), and New Hampshire (35.8).
- In 2018, the states with the lowest age-adjusted drug overdose death rates were Texas (10.4), North Dakota (10.2), Iowa (9.6), Nebraska (7.4), and South Dakota (6.9).
Figure 2. Change in age-adjusted drug overdose death rates, by state: United States, 2017 and 2018
NOTE: Deaths are classified using the International Classification of Diseases, 10th Revision. Drug-poisoning (overdose) deaths are identified using underlying cause-of-death codes X40–X44, X60–X64, X85, and Y10–Y14. Access data table for Figure 2pdf icon.
SOURCE: NCHS, National Vital Statistics System, Mortality.
The age-adjusted rate of drug overdose deaths involving synthetic opioids other than methadone increased by 10% from 2017 to 2018.
- The age-adjusted rate of drug overdose deaths involving synthetic opioids other than methadone, which include drugs such as fentanyl, fentanyl analogs, and tramadol, increased from 0.3 per 100,000 standard population in 1999 to 1.0 in 2013, 1.8 in 2014, 3.1 in 2015, 6.2 in 2016, 9.0 in 2017, and 9.9 in 2018 (Figure 3).
- The rate of drug overdose deaths involving heroin increased from 0.7 in 1999 to 1.0 in 2010, then increased to 4.9 in 2016 and 2017. The rate in 2018 (4.7) was lower than in 2017.
- The rate of drug overdose deaths involving natural and semisynthetic opioids, which include drugs such as oxycodone and hydrocodone, increased from 1.0 in 1999 to 3.1 in 2009, then increased to 4.4 in 2016 and 2017. The rate in 2018 (3.8) was lower than in 2017.
- The rate of drug overdose deaths involving methadone increased from 0.3 in 1999 to 1.8 in 2006 and 2007, then decreased to 1.0 in 2016 and 2017. The rate in 2018 (0.9) was lower than in 2017.
Figure 3. Age-adjusted drug overdose death rates involving opioids, by type of opioid: United States, 1999–2018
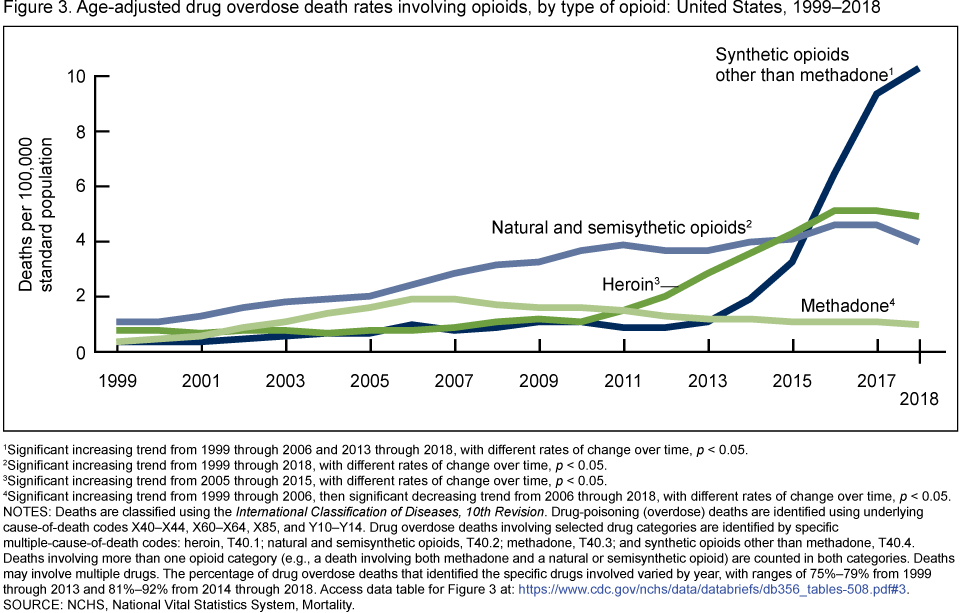
1Significant increasing trend from 1999 through 2006 and 2013 through 2018, with different rates of change over time, p < 0.05.
2Significant increasing trend from 1999 through 2018, with different rates of change over time, p < 0.05.
3Significant increasing trend from 2005 through 2015, with different rates of change over time, p < 0.05.
4Significant increasing trend from 1999 through 2006, then significant decreasing trend from 2006 through 2018, with different rates of change over time, p < 0.05.
NOTES: Deaths are classified using the International Classification of Diseases, 10th Revision. Drug-poisoning (overdose) deaths are identified using underlying cause-of-death codes X40–X44, X60–X64, X85, and Y10–Y14. Drug overdose deaths involving selected drug categories are identified by specific multiple-cause-of-death codes: heroin, T40.1; natural and semisynthetic opioids, T40.2; methadone, T40.3; and synthetic opioids other than methadone, T40.4. Deaths involving more than one opioid category (e.g., a death involving both methadone and a natural or semisynthetic opioid) are counted in both categories. Deaths may involve multiple drugs. The percentage of drug overdose deaths that identified the specific drugs involved varied by year, with ranges of 75%–79% from 1999 through 2013 and 81%–92% from 2014 through 2018. Access data table for Figure 3pdf icon.
SOURCE: NCHS, National Vital Statistics System, Mortality.
From 2012 through 2018, the age-adjusted rate of drug overdose deaths involving cocaine more than tripled, and the rate of deaths involving psychostimulants with abuse potential increased nearly 5-fold.
- The age-adjusted rate of drug overdose deaths involving cocaine increased from 1.4 per 100,000 standard population in 1999 to 2.5 in 2006, then decreased to 1.3 in 2010 and 1.5 in 2011. From 2012 through 2018, the rate increased on average by 27% per year to a rate of 4.5 in 2018 (Figure 4).
- The age-adjusted rate of drug overdose deaths involving psychostimulants with abuse potential, which include drugs such as methamphetamine, amphetamine, and methylphenidate, increased from 0.2 in 1999 to 0.8 in 2012. From 2012 through 2018, the rate increased on average by 30% per year to a rate of 3.9 in 2018.
Figure 4. Age-adjusted drug overdose death rates involving stimulants, by type of stimulant: United States, 1999–2018
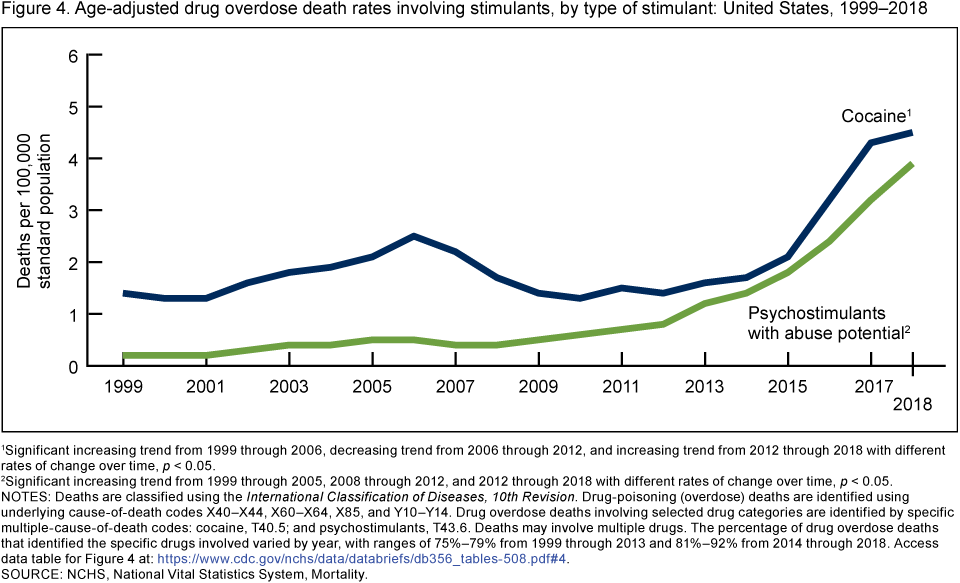
1Significant increasing trend from 1999 through 2006, decreasing trend from 2006 through 2012, and increasing trend from 2012 through 2018 with different rates of change over time, p < 0.05.
2Significant increasing trend from 1999 through 2005, 2008 through 2012, and 2012 through 2018 with different rates of change over time, p < 0.05.
NOTES: Deaths are classified using the International Classification of Diseases, 10th Revision. Drug-poisoning (overdose) deaths are identified using underlying cause-of-death codes X40–X44, X60–X64, X85, and Y10–Y14. Drug overdose deaths involving selected drug categories are identified by specific multiple-cause-of-death codes: cocaine, T40.5; and psychostimulants, T43.6. Deaths may involve multiple drugs. The percentage of drug overdose deaths that identified the specific drugs involved varied by year, with ranges of 75%–79% from 1999 through 2013 and 81%–92% from 2014 through 2018. Access data table for Figure 4pdf icon.
SOURCE: NCHS, National Vital Statistics System, Mortality.
Summary
This report updates statistics on deaths from drug overdoses in the United States, including information on trends since 1999 and changes in drug overdose death rates by state from 2017 to 2018.
Compared with 2017, the age-adjusted rate of drug overdose deaths declined in 2018, from 21.7 per 100,000 standard population to 20.7. There was a decrease in the rate for both males and females (from 29.1 in 2017 to 27.9 in 2018 for males, and from 14.4 in 2017 to 13.6 in 2018 for females). Fifteen jurisdictions (Alaska, District of Columbia, Florida, Georgia, Indiana, Iowa, Kentucky, Maine, Minnesota, New York, North Carolina, Ohio, Pennsylvania, West Virginia, and Wisconsin) had a lower age-adjusted rate of drug overdose deaths in 2018 compared with 2017, while five states (California, Delaware, Missouri, New Jersey, and South Carolina) had a higher rate in 2018 than in 2017. For all other states, the rates in 2017 and 2018 were not statistically different.
By specific drug, the rate of drug overdose deaths involving synthetic opioids other than methadone (drugs such as fentanyl, fentanyl analogs, and tramadol) continued to increase from 9.0 in 2017 to 9.9 in 2018. The rates of drug overdose deaths involving heroin, natural and semisynthetic opioids, and methadone were lower in 2018 than in 2017 (from 4.9 in 2017 to 4.7 in 2018 for heroin, from 4.4 in 2017 to 3.8 in 2018 for natural and semisynthetic opioids, and from 1.0 in 2017 to 0.9 in 2018 for methadone). The rates of drug overdose deaths involving cocaine and involving psychostimulants with abuse potential (drugs such as methamphetamine) were higher in 2018 than in 2017 (from 4.3 in 2017 to 4.5 in 2018 for cocaine, and 3.2 in 2017 to 3.9 in 2018 for psychostimulants with abuse potential).
Definitions
Drug poisoning (overdose) deaths: Includes deaths resulting from unintentional or intentional overdose of a drug, being given the wrong drug, taking a drug in error, or taking a drug inadvertently.
Natural and semisynthetic opioids: Includes drugs such as morphine, codeine, hydrocodone, and oxycodone.
Synthetic opioids other than methadone: Includes drugs such as fentanyl, fentanyl analogs, and tramadol.
Psychostimulants with abuse potential: Includes drugs such as methamphetamine, amphetamine, and methylphenidate.
Data source and methods
Estimates are based on the NVSS multiple-cause-of-death mortality files (6). Drug poisoning (overdose) deaths were identified using International Classification of Diseases, 10th Revision (ICD–10) underlying-cause-of-death codes X40–X44 (unintentional), X60–X64 (suicide), X85 (homicide), or Y10–Y14 (undetermined intent). Of the drug overdose deaths in 2018, 87.4% were unintentional, 7.2% were suicides, 5.2% were of undetermined intent, and less than 1% were homicides. The type of drug(s) involved are indicated by ICD–10 multiple-cause-of-death codes: heroin (T40.1); natural and semisynthetic opioids (T40.2); methadone (T40.3); synthetic opioids other than methadone (T40.4); cocaine (T40.5); and psychostimulants with abuse potential (T43.6).
Age-adjusted death rates were calculated using the direct method and adjusted to the 2000 U.S. standard population (7). Trends in age-adjusted death rates were evaluated using the Joinpoint Regression Program (Version 4.7.0.0) (8). Joinpoint software fitted weighted least-squares regression models to the rates on the log transform scale. Analyses were set to allow a maximum of three joinpoints across the period, a minimum of three observed time points from any given joinpoint to either end of the data, and a minimum of four observed time points between any two joinpoints. The permutation tests for model (number of joinpoints) significance were set at an overall alpha level of 0.05 (9). Differences between state estimates in 2017 and 2018 were evaluated using two-sided significance tests at the 0.01 level. Unless otherwise stated, differences in all other comparisons (e.g., age-adjusted rates for males compared with females) were statistically significant at the 0.05 level (7).
Several factors related to death investigation and reporting may affect measurement of death rates involving specific drugs. At autopsy, the substances tested for and the circumstances under which the toxicology tests are performed vary by jurisdiction. This variability is more likely to affect substance-specific death rates than the overall drug overdose death rate. The percentage of drug overdose deaths that identified the specific drugs involved varied by year, ranging from 75%–79% from 1999 through 2013 and from 81%–92% from 2014 through 2018.
Additionally, drug overdose deaths may involve multiple drugs; therefore, a single death might be included in more than one category when describing the rate of drug overdose deaths involving specific drugs. For example, a death that involved both fentanyl and cocaine would be included in both the rate of drug overdose deaths involving synthetic opioids other than methadone and the rate of drug overdose deaths involving cocaine.
About the authors
Holly Hedegaard is with the National Center for Health Statistics (NCHS), Division of Analysis and Epidemiology. Arialdi Miniño and Margaret Warner are with NCHS, Division of Vital Statistics.
References
- Hedegaard H, Warner M, Miniño AM. Drug overdose deaths in the United States, 1999–2017pdf icon. NCHS Data Brief, no 329. Hyattsville, MD: National Center for Health Statistics. 2018.
- Ahmad FB, Rossen LM, Spencer MR, Warner M, Sutton P. Provisional drug overdose death counts. National Center for Health Statistics. 2018.
- Kariisa M, Scholl L, Wilson N, Seth P, Hoots B. Drug overdose deaths involving cocaine and psychostimulants with abuse potential—United States, 2003–2017. MMWR Morb Mortal Wkly Rep 68(17):388–95. 2019.
- Scholl L, Seth P, Kariisa M, Wilson N, Baldwin G. Drug and opioid-involved overdose deaths—United States, 2013–2017. MMWR Morb Mortal Wkly Rep 67(5152):1419–27. 2019.
- Hedegaard H, Chen LH, Warner M. Drug-poisoning deaths involving heroin: United States, 2000–2013. NCHS Data Brief, no 190. Hyattsville, MD: National Center for Health Statistics. 2015.
- National Center for Health Statistics. Public-use data files: Mortality multiple cause files. 2018.
- Murphy SL, Xu JQ, Kochanek KD. Deaths: Final data for 2010pdf icon. National Vital Statistics Reports; vol 61 no 4. Hyattsville, MD: National Center for Health Statistics. 2013.
- National Cancer Institute. Joinpoint Regression Program (Version 4.7.0.0) [computer software]. 2019
- Ingram DD, Malec DJ, Makuc DM, Kruszon-Moran D, Gindi RM, Albert M, et al. National Center for Health Statistics guidelines for analysis of trends.pdf icon National Center for Health Statistics. Vital Health Stat 2(179). 2018.
Suggested citation
Hedegaard H, Miniño AM, Warner M. Drug overdose deaths in the United States, 1999–2018. NCHS Data Brief, no 356. Hyattsville, MD: National Center for Health Statistics. 2020.
Copyright information
All material appearing in this report is in the public domain and may be reproduced or copied without permission; citation as to source, however, is appreciated.
National Center for Health Statistics
Jennifer H. Madans, Ph.D., Acting Director
Amy M. Branum, Ph.D., Acting Associate Director for Science
Division of Analysis and Epidemiology
Irma E. Arispe, Ph.D., Director
Kevin C. Heslin, Ph.D., Associate Director for Science
Division of Vital Statistics
Steven Schwartz, Ph.D., Director
Hanyu Ni, Ph.D., M.P.H., Associate Director for Science