Vision Testing Among Children Aged 3–5 Years in the United States, 2016–2017
- Key findings
- Did the percentage of children aged 3–5 years who ever had their vision tested or had their vision tested in the past 12 months vary by age?
- Did the percentage of children aged 3–5 years who ever had their vision tested by a doctor or other health professional vary by race and Hispanic origin or sex?
- Did the percentage of children aged 3–5 years who ever had their vision tested by a doctor or other health professional vary by selected measures of socioeconomic status?
- Did the percentage of children aged 3–5 years who ever had their vision tested by a doctor or other health professional vary by selected measures of health care access and utilization?
- Summary
- Definitions
- Data sources and methods
- About the authors
- References
- Suggested citation
NCHS Data Brief No. 353, November 2019
PDF Versionpdf icon (423 KB)
Lindsey I. Black, M.P.H., Peter Boersma, M.P.H., and Alicia Jen
Key findings
Data from the National Health Interview Survey
- During 2016–2017, 63.5% of children aged 3–5 years had ever had their vision tested by a doctor or other health professional.
- Hispanic children (58.6%) were less likely to have ever had their vision tested compared with non-Hispanic white children (65.4%).
- Receipt of a vision test increased with increasing parental educational attainment.
- Children with private health insurance (66.7%) were more likely than both children with public coverage (61.2%) and uninsured children (43.3%) to have ever had a vision test.
- Children who did not receive a well-child visit in the past 12 months were less likely to have ever had a vision test compared with children that did receive a well-child visit in the past 12 months.
Childhood vision screenings may provide early detection of vision disorders and opportunities for subsequent treatment (1). The United States Preventive Service Task Force recommends that children aged 3–5 years receive a vision screening at least once to detect amblyopia (lazy eye), or its risk factors (2). This report examines the percentage of children aged 3–5 years who have ever had a vision test by selected characteristics using data from the vision supplement included in the 2016–2017 National Health Interview Survey (NHIS).
Keywords: eyes, screening, preschool, National Health Interview Survey
Did the percentage of children aged 3–5 years who ever had their vision tested or had their vision tested in the past 12 months vary by age?
In 2016–2017, the percentage of children aged 3–5 years who ever had their vision tested by a doctor or other health professional increased with age, from 51.9% among children aged 3 to 72.5% among children aged 5 (Figure 1). Similarly, the percentage of young children who had their vision tested in the past 12 months also increased with age, from 41.0% to 62.9%, respectively.
Figure 1. Percentage of children aged 3–5 years who ever had their vision tested or had their vision tested in the past 12 months by a doctor or other health professional, by age: United States, 2016–2017
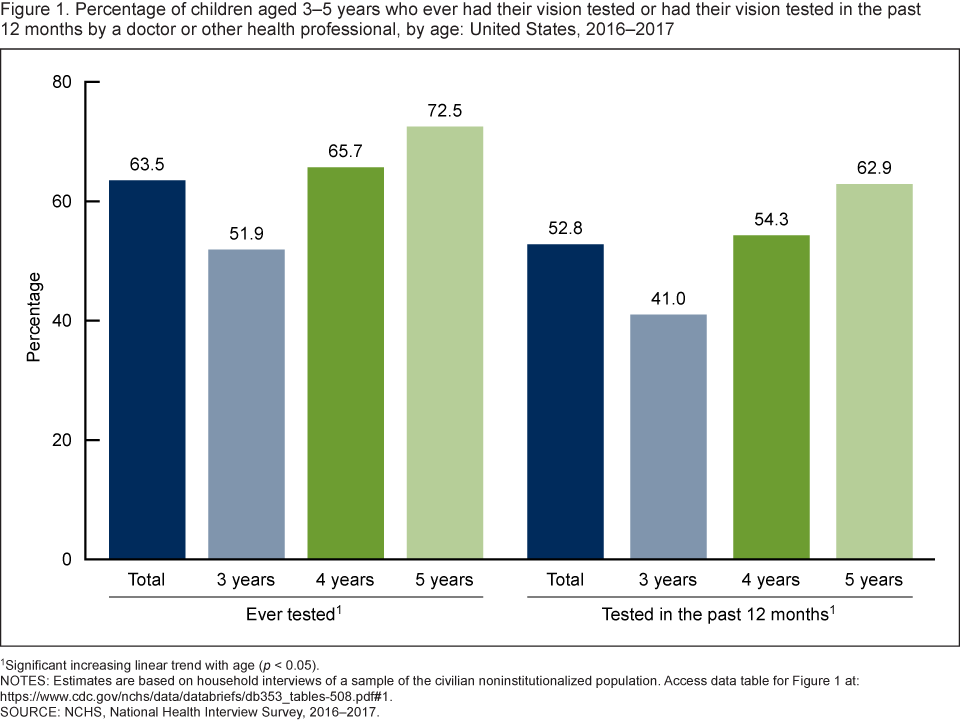
1Significant increasing linear trend with age (p < 0.05).
NOTES: Estimates are based on household interviews of a sample of the civilian noninstitutionalized population.
Access data table for Figure 1pdf icon.
SOURCE: NCHS, National Health Interview Survey, 2016–2017.
Did the percentage of children aged 3–5 years who ever had their vision tested by a doctor or other health professional vary by race and Hispanic origin or sex?
Hispanic children (58.6%) were less likely to ever have their vision tested compared with non-Hispanic white children (65.4%) (Figure 2). The observed difference between Hispanic children compared with non-Hispanic black children was not significant. Vision testing was similar between girls (64.3%) and boys (62.7%).
Figure 2. Percentage of children aged 3–5 years who ever had their vision tested by a doctor or other health professional, by race and Hispanic origin and sex: United States, 2016–2017
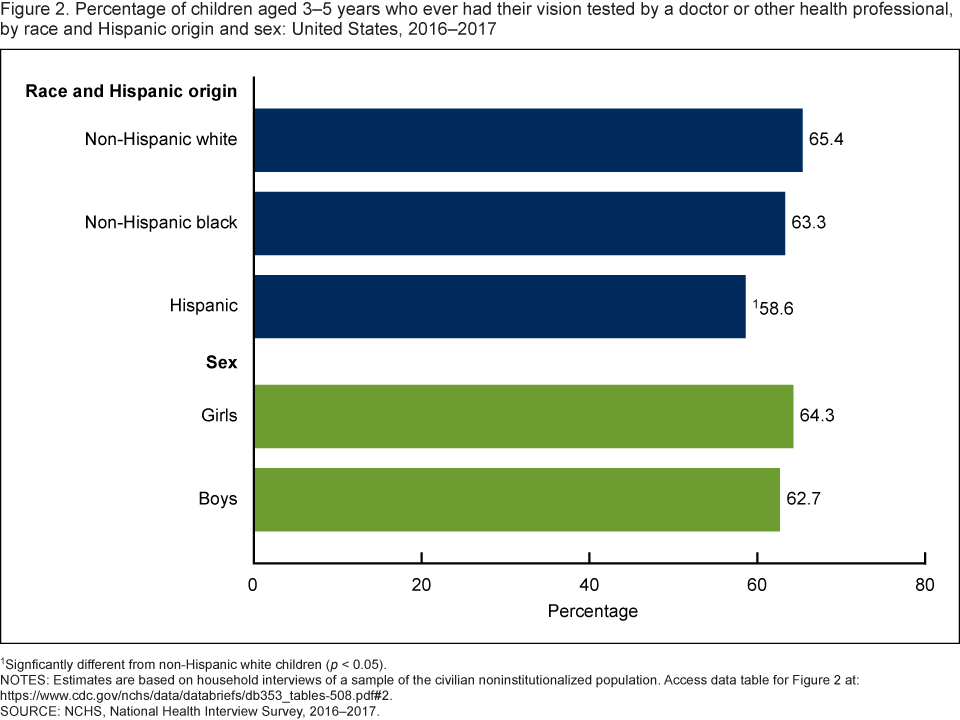
1Signficantly different from non-Hispanic white children (p < 0.05).
NOTES: Estimates are based on household interviews of a sample of the civilian noninstitutionalized population. Access data table for Figure 2pdf icon.
SOURCE: NCHS, National Health Interview Survey, 2016–2017
Did the percentage of children aged 3–5 years who ever had their vision tested by a doctor or other health professional vary by selected measures of socioeconomic status?
Children living in families with incomes equal to or greater than 200% of the federal poverty level (FPL) (67.0%) were more likely to have ever have their vision tested compared with children living in families with incomes below 200% of the FPL (58.9%) (Figure 3). The percentage of children who ever had their vision tested increased with parental education. Nearly 57% of children with parents who had a high school diploma or General Educational Development (GED) high school equivalency diploma or less, 62.4% of those with parents who had some college, and 69.1% of those with parents who had a bachelor’s degree or higher have ever had their vision tested.
Figure 3. Percentage of children aged 3–5 years who ever had their vision tested by a doctor or other health professional, by poverty status and parental educational attainment: United States, 2016–2017
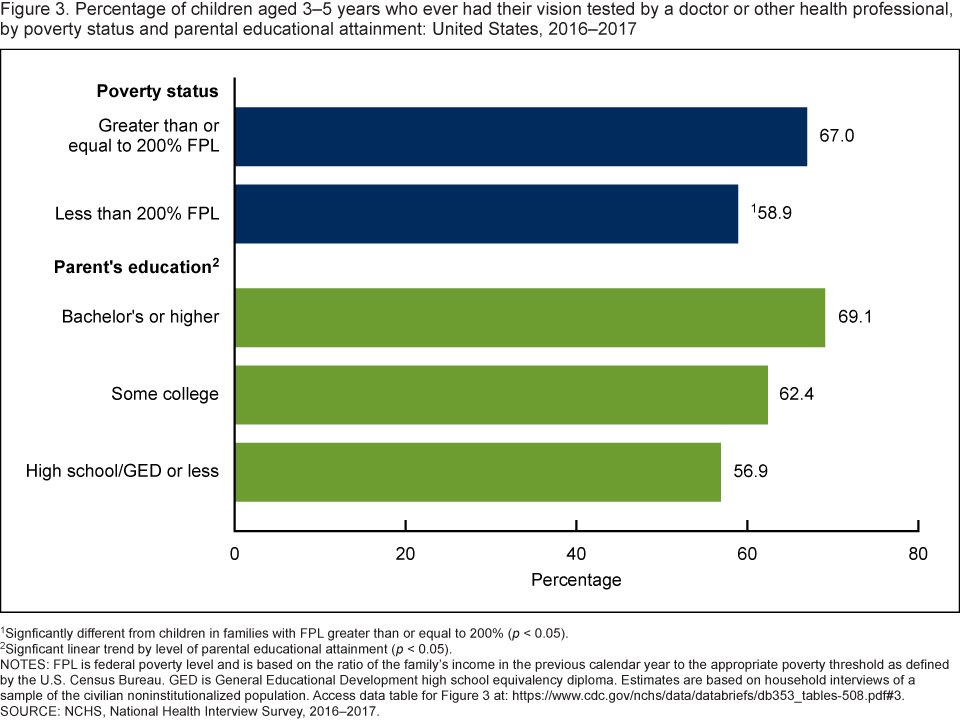
1Signficantly different from children in families with FPL greater than or equal to 200% (p < 0.05).
2Signficant linear trend by level of parental educational attainment (p < 0.05).
NOTES: FPL is federal poverty level and is based on the ratio of the family’s income in the previous calendar year to the appropriate poverty threshold as defined by the U.S. Census Bureau. GED is General Educational Development high school equivalency diploma. Estimates are based on household interviews of a sample of the civilian noninstitutionalized population. Access data table for Figure 3pdf icon.
SOURCE: NCHS, National Health Interview Survey, 2016–2017.
Did the percentage of children aged 3–5 years who ever had their vision tested by a doctor or other health professional vary by selected measures of health care access and utilization?
Children with private health insurance coverage (66.7%) were more likely to ever have their vision tested compared with children with public health insurance coverage (61.2%) and uninsured children (43.3%) (Figure 4). Children with public health insurance coverage were also more likely to have their vision tested compared with uninsured children. Children who did receive a well-child visit in the past 12 months (65.9%) were more likely than children who did not receive a well-child visit in the past 12 months (44.1%) to have ever had their vision tested.
Figure 4. Percentage of children aged 3–5 years who ever had their vision tested by a doctor or other health professional, by health insurance coverage status or receipt of well-child visit in the past 12 months: United States, 2016–2017
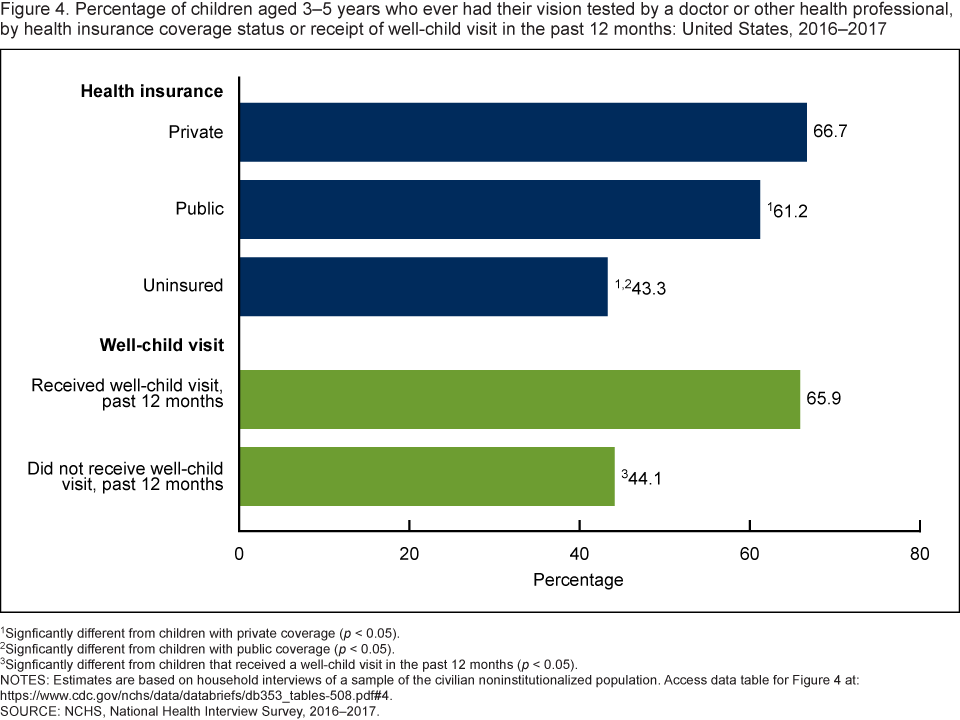
1Signficantly different from children with private coverage (p < 0.05).
2Signficantly different from children with public coverage (p < 0.05).
3Signficantly different from children that received a well-child visit in the past 12 months (p < 0.05).
NOTES: Estimates are based on household interviews of a sample of the civilian noninstitutionalized population. Access data table for Figure 4pdf icon.
SOURCE: NCHS, National Health Interview Survey, 2016–2017.
Summary
Data from the 2016–2017 NHIS show that among children aged 3–5 years, approximately 64% have ever had their vision tested by a doctor or other health professional as recommended and testing increased with age. Results were similar according to whether they had their vision tested in the past 12 months. However, there was variation in testing across several sociodemographic, socioeconomic, and health care access and utilization measures. Specifically, differences by race and Hispanic origin were observed and children in families of lower socioeconomic status were less likely than those of higher socioeconomic status to have ever had their vision tested. In addition, uninsured children and children who had not received a well-child visit within the past 12 months were less likely to have ever had their vision tested. Vision screenings are a recommended part of well-child visits (3) in which problems may be detected and timely intervention efforts may be offered.
Definitions
Health insurance coverage: Based on the status of health insurance coverage at the time of interview. Private health insurance includes children with comprehensive private insurance plans obtained through a parent’s or caregiver’s employer, purchased directly, purchased through local or community programs, or purchased through the Health Insurance Marketplace or a state-based exchange. Public health insurance includes children with Medicaid, Children’s Health Insurance Program, or other state-sponsored health plan. Uninsured children include those who were not reported to have been covered at the time of interview or those who were covered only by Indian Health Service or had only a single service plan (e.g., dental care only). Children with more than one type of health insurance were assigned to the first appropriate category in the following mutually exclusive hierarchy: private coverage, public coverage, other coverage (data not shown), or uninsured.
Parental education attainment: Based on the education level of the parent with the highest level of education, regardless of that parent’s age, living at the child’s residence.
Poverty status: Based on family income and family size using the U.S. Census Bureau’s poverty thresholds for the previous calendar year. The 2016–2017 National Health Interview Survey imputed income files were used which imputes family income when it is not provided.
Race and Hispanic origin: Based on responses to two questions that determine Hispanic or Latino origin and race. Persons of Hispanic- or Latino-origin may be of any race. Non-Hispanic white and non-Hispanic black refer to children with a single race group indicated. Data for children with more than one race group indicated or of other race groups are not shown.
Vision testing: Based on the response to the survey question, “Has (sample child) ever had (his/her) vision tested by a doctor or other health professional?”
Well-child checkup: Based on the response to the survey question, “During the past 12 months did (sample child) receive a well-child checkup— that is, a general checkup when (he/she) was not sick or injured?”
Data source and methods
Data from the 2016 and 2017 NHIS were used for this analysis. NHIS data are collected continuously throughout the year and include information about the health and health care of the civilian noninstitutionalized U.S. population. Interviews are conducted in respondents’ homes, but follow-ups to complete interviews may be conducted over the telephone.
NHIS consists of four main components: the Household, the Family, the Sample Adult, and the Sample Child. These components include both a core set of questions that remain relatively unchanged from year to year as well as supplemental questions that are not asked every year. The 2016 and 2017 NHIS included supplementary questions on expanded content related to child vision. Data for this analysis came from the NHIS Family and Sample Child core components and the supplementary questions on child vision. The Sample Child component is completed by a knowledgeable adult, usually a parent (90.5% of respondents for children aged 3–5 years were parents in 2016–2017). For more information about NHIS, visit https://www.cdc.gov/nchs/nhis.htm.
NHIS is designed to yield a nationally representative sample, and these analyses used weights to produce national estimates. The sample design is described in more detail elsewhere (4–5). Point estimates and the corresponding variances for this analysis were calculated using SUDAAN software (6) to account for the complex sample design of NHIS. Differences between percentages were evaluated using two-sided significance tests at the 0.05 level. Linear trends by age and parental educational attainment were evaluated using linear regression. All estimates in this report meet NCHS standards of reliability as specified in “National Center for Health Statistics Data Presentation Standards for Proportions” (7).
About the authors
Lindsey I. Black and Peter Boersma are with the National Center for Health Statistics, Division of Health Interview Statistics. At the time of this report, Alicia Jen was a Junior Fellow with the Joint Program in Survey Methodology and an undergraduate student at the University of Pennsylvania.
References
- Nye C. A child’s vision. Pediatr Clin of North Am 61(3):495–503. 2014.
- U.S. Preventive Services Task Force. Vision screening in children aged 6 months to 5 years of age: U.S. Preventive Services Task Force Recommendation Statement. JAMA 318(9):836–44. 2017.
- American Academy of Pediatrics. Recommendations for preventive pediatric health carepdf iconexternal icon. 2019.
- National Center for Health Statistics. Survey description, National Health Interview Survey, 2016. Hyattsville, Maryland. 2017.
- National Center for Health Statistics. Survey description, National Health Interview Survey, 2017. Hyattsville, Maryland. 2018.
- RTI International. SUDAAN (Release 11.0.0) [computer software]. 2012.
- Parker JD, Talih M, Malec DJ, Beresovsky V, Carroll M, Gonzales, JF Jr, et. al. National Center for Health Statistics data presentation standards for proportions. National Center for Health Statistics. Vital Health Stat 2(175). 2017.
Suggested citation
Black LI, Boersma P, Jen A. Vision testing among children aged 3–5 years in the United States, 2016–2017. NCHS Data Brief, no 353. Hyattsville, MD: National Center for Health Statistics. 2019.
Copyright information
All material appearing in this report is in the public domain and may be reproduced or copied without permission; citation as to source, however, is appreciated.
National Center for Health Statistics
Jennifer H. Madans, Ph.D., Acting Director
Amy M. Branum, Ph.D., Acting Associate Director for Science
Division of Health Interview Statistics
Stephen J. Blumberg, Ph.D., Director
Anjel Vahratian, Ph.D., M.P.H., Associate Director for Science