Mortality Patterns Between Five States With Highest Death Rates and Five States With Lowest Death Rates: United States, 2017
- Key findings
- Average age-adjusted death rates were higher for the five states with the highest rates overall and by sex compared with the five states with the lowest rates.
- Average age-specific death rates for all age groups were higher for the five states with the highest rates than for the five states with the lowest rates.
- Average age-adjusted death rates for the five states with the highest rates were higher for non-Hispanic white and non-Hispanic black persons but lower for Hispanic persons compared with the five states with the lowest rates.
- The average age-adjusted death rates for all top five causes of death were higher for the five states with the highest rates than for the five states with the lowest rates.
- Summary
- Definitions
- Data sources and methods
- About the authors
- References
- Suggested citation
NCHS Data Brief No. 350, September 2019
PDF Versionpdf icon (423 KB)
Jiaquan Xu, M.D.
Key findings
Data from the National Vital Statistics System, Mortality
- The average age-adjusted death rate for the five states with the highest rates (926.8 per 100,000 standard population) was 49% higher than the rate for the five states with the lowest rates (624.0).
- Age-specific death rates for all age groups were higher for the states with the highest rates compared with the states with the lowest rates.
- Age-adjusted death rates were higher for non-Hispanic white and non-Hispanic black populations but lower for the Hispanic population in states with the highest rates than in states with the lowest rates.
- The age-adjusted death rates for chronic lower respiratory diseases and unintentional injuries for the states with the highest rates (62.0 and 65.5, respectively) were almost doubled compared with the states with the lowest rates (31.0 and 35.8).
Mortality in the United States varies widely by state (1). This report compares average age-adjusted death rates by sex, race and ethnicity, and five leading causes of death between a group of five states with the highest age-adjusted death rates (Alabama, Kentucky, Mississippi, Oklahoma, and West Virginia) and a group of five states with the lowest age-adjusted death rates (California, Connecticut, Hawaii, Minnesota, and New York) in 2017 (2). Age-specific death rates for the two groups are presented as well.
Keywords: age-adjusted death rate, leading causes, health disparities, National Vital Statistics System
Average age-adjusted death rates were higher for the five states with the highest rates overall and by sex compared with the five states with the lowest rates.
- The average age-adjusted death rate for the five states with the highest death rates (926.8 per 100,000 standard population) was 49% higher than that for the five states with the lowest death rates (624.0) (Figure 1).
- Among males, the average death rate for the states with the highest rates (1,094.3) was 48% higher than that for the states with the lowest rates (741.2).
- Among females, the average death rate for the states with the highest rates (785.7) was 49% higher than that for the states with the lowest rates (526.4).
- The average death rate for the states with the highest rates was 27% higher than the national rate (731.9). For the states with the lowest rates, the average death rate was 15% lower than the national rate.
Figure 1. Average age-adjusted death rates for the five states with the highest rates and the five states with the lowest rates, by sex: United States, 2017
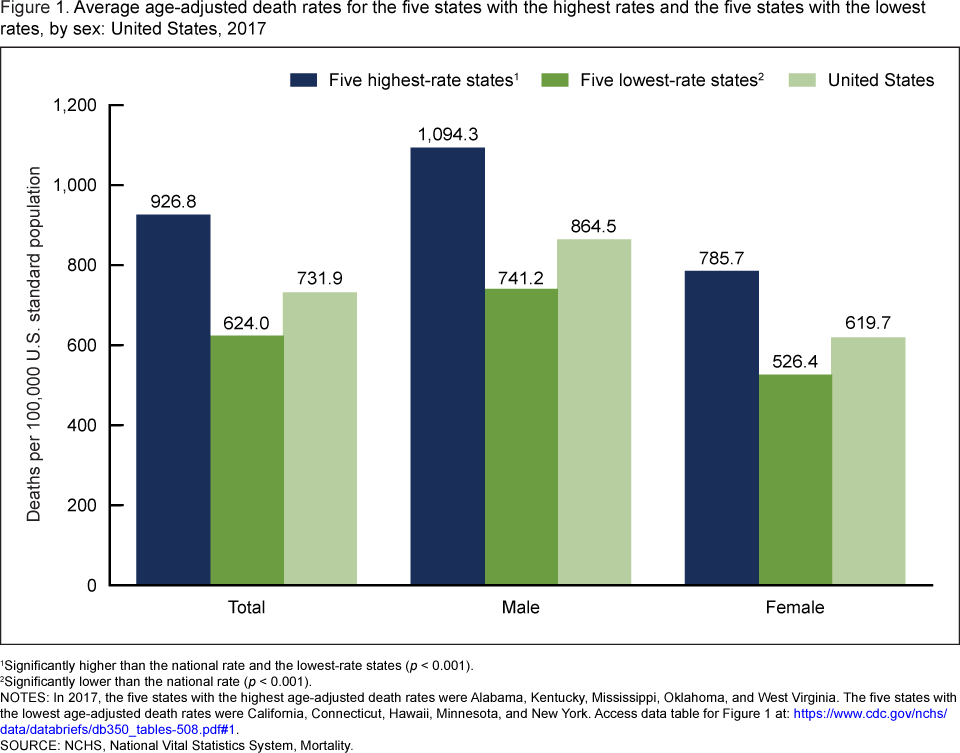
1Significantly higher than the national rate and the lowest-rate states (p < 0.001).
2Significantly lower than the national rate (p < 0.001).
NOTES: In 2017, the five states with the highest age-adjusted death rates were Alabama, Kentucky, Mississippi, Oklahoma, and West Virginia. The five states with the lowest age-adjusted death rates were California, Connecticut, Hawaii, Minnesota, and New York. Access data table for Figure 1pdf icon.
SOURCE: NCHS, National Vital Statistics System, Mortality.
Average age-specific death rates for all age groups were higher for the five states with the highest rates than for the five states with the lowest rates.
- On average, the death rates for age groups 25–34 and 35–44 for the states with the highest rates were more than double compared with the states with the lowest rates (103%, 186.1 and 91.8, respectively, per 100,000 population, and 112%, 302.0 and 142.4) (Figure 2).
- The smallest percent difference in rates between the highest-rate states and the lowest-rate states was for persons aged 85 and over (18%, 14,846.7 compared with 12,556.9).
Figure 2. Average death rates for the five states with the highest rates and the five states with the lowest rates, by age group: United States, 2017
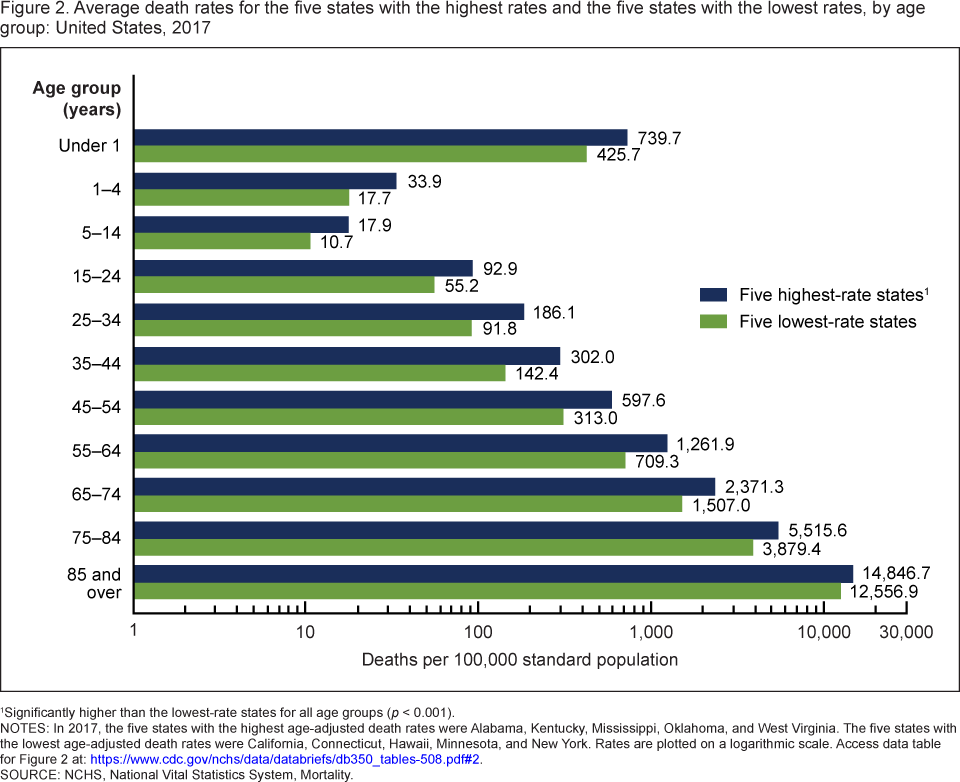
1Significantly higher than the lowest-rate states for all age groups (p < 0.001).
NOTES: In 2017, the five states with the highest age-adjusted death rates were Alabama, Kentucky, Mississippi, Oklahoma, and West Virginia. The five states with the lowest age-adjusted death rates were California, Connecticut, Hawaii, Minnesota, and New York. Rates are plotted on a logarithmic scale. Access data table for Figure 2pdf icon.
SOURCE: NCHS, National Vital Statistics System, Mortality.
Average age-adjusted death rates for the five states with the highest rates were higher for non-Hispanic white and non-Hispanic black persons but lower for Hispanic persons compared with the five states with the lowest rates.
- Average age-adjusted rates were 39% higher for non-Hispanic white persons (929.1 compared with 668.9) and 32% higher for non-Hispanic black persons (996.2 compared with 755.5) for the five states with the highest rates than for the five states with the lowest rates (Figure 3).
- The rate for Hispanic persons was 27% lower (374.6 compared with 509.7) for the states with highest rates than for the states with the lowest rates.
Figure 3. Average age-adjusted death rates for the five states with the highest rates and the five states with the lowest rates, by race and Hispanic origin: United States, 2017
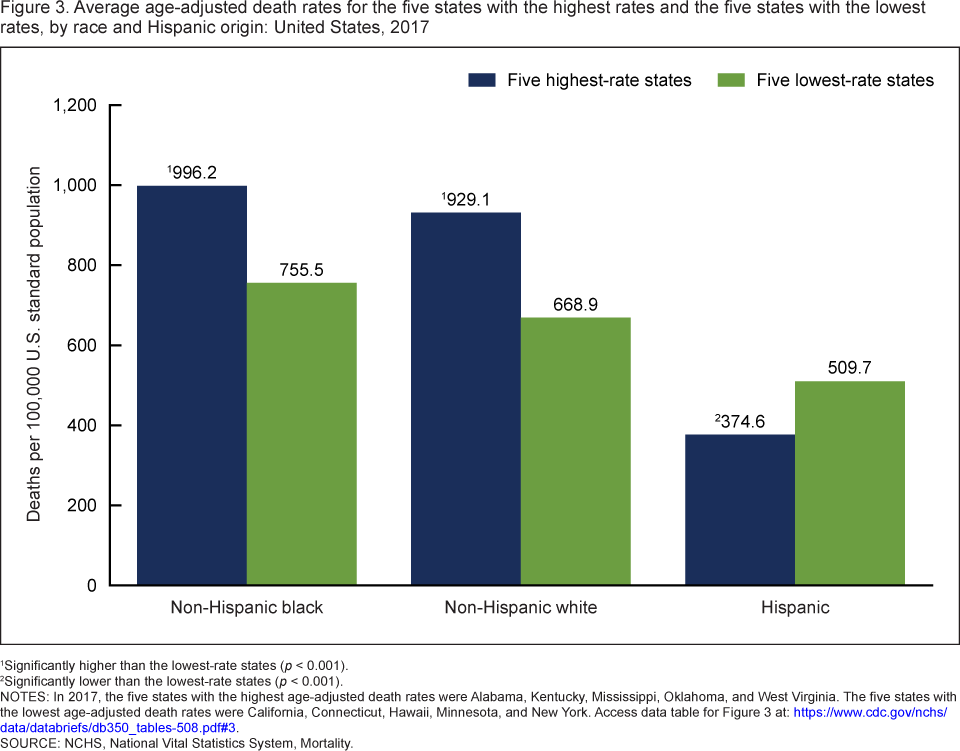
1Significantly higher than the lowest-rate states (p < 0.001).
2Significantly lower than the lowest-rate states (p < 0.001).
NOTES: In 2017, the five states with the highest age-adjusted death rates were Alabama, Kentucky, Mississippi, Oklahoma, and West Virginia. The five states with the lowest age-adjusted death rates were California, Connecticut, Hawaii, Minnesota, and New York. Access data table for Figure 3pdf icon.
SOURCE: NCHS, National Vital Statistics System, Mortality.
The average age-adjusted death rates for all top five causes of death were higher for the five states with the highest rates than for the five states with the lowest rates.
- In 2017, the five leading causes of death were the same for both groups. Average age-adjusted death rates for the top five causes of death overall were 47% higher (568.5 compared with 387.3) for the five states with the highest rates compared with the five states with the lowest rates (Figure 4).
- For the states with the highest rates, average age-adjusted death rates were 46% higher for heart disease (217.3 and 149.2, respectively), 29% higher for cancer (178.5 and 138.8), and 39% higher for stroke (45.3 and 32.5) compared with the states with the lowest rates.
- Average age-adjusted death rates for chronic lower respiratory diseases in the states with the highest rates were double that of the lowest states (62.0 compared with 31.0), and rates for unintentional injuries were nearly double (65.5 compared with 35.8) in the highest-rate states compared with the lowest-rate states.
Figure 4. Average age-adjusted death rates for the five leading causes of death for the five states with the highest rates and the five states with the lowest rates: United States, 2017
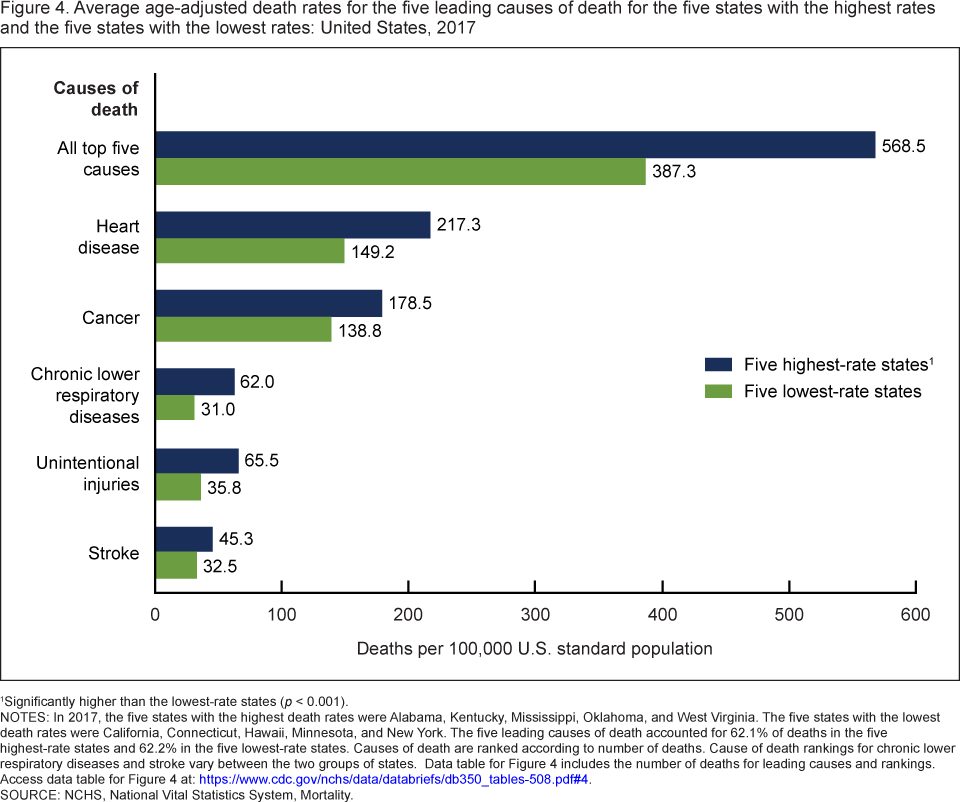
1Significantly higher than the lowest-rate states (p < 0.001).
NOTES: In 2017, the five states with the highest death rates were Alabama, Kentucky, Mississippi, Oklahoma, and West Virginia. The five states with the lowest death rates were California, Connecticut, Hawaii, Minnesota, and New York. The five leading causes of death accounted for 62.1% of deaths in the five highest-rate states and 62.2% in the five lowest-rate states. Causes of death are ranked according to number of deaths. Cause of death rankings for chronic lower respiratory diseases and stroke vary between the two groups of states. Data table for Figure 4 includes the number of deaths for leading causes and rankings. Access data table for Figure 4pdf icon.
SOURCE: NCHS, National Vital Statistics System, Mortality.
Summary
This report has shown that the differences in average death rates between the two groups of states with the five highest and lowest death rates persist when stratifying by gender, age, and race and Hispanic origin, and for the five leading causes of death. The death rates for each of the five leading causes of death for the states with the highest rates were higher than those for the five states with the lowest rates. The death rate for every age group presented in this report was higher for the states with the highest rates than for the states with the lowest rates. Differences were greatest for adults aged 25–34 and 35–44. The death rate for the Hispanic population was lower while rates for the non-Hispanic white and non-Hispanic black populations were higher for the states with the highest rates than for the states with the lowest rates. The greatest differences in the leading causes of death were for deaths due to chronic lower respiratory diseases and unintentional injuries, where rates for the highest-rate states were about twice the rates for the lowest-rate states.
Definitions
Cause of death: Based on medical information—including injury diagnoses and external causes of injury—entered on death certificates filed in the United States. This information is classified and coded in accordance with the International Statistical Classification of Diseases and Related Health Problems, 10th Revision (3).
Death rates: Based on the postcensal population as of July 1, 2017. These population estimates are available on the National Center of Health Statistics (NCHS) website (4).
Leading causes of death: Ranked according to the number of deaths assigned to rankable causes (5).
Data sources and methods
This report uses the 2017 mortality data file from the National Vital Statistics System. The mortality data are collected and compiled by NCHS from death certificates filed in all 50 states and the District of Columbia. Rates presented in this report are averages calculated by dividing the total number of deaths by the total population for a group of five states with the highest age-adjusted death rates (Alabama, Kentucky, Mississippi, Oklahoma, and West Virginia) and for a group of five states with the lowest age-adjusted death rates (California, Connecticut, Hawaii, Minnesota, and New York), using postcensal population estimates as of July 1, 2017. The direct standardization method was used to calculate age-adjusted death rates, using the 2000 U.S. standard population and age groups with 10-year intervals. Differences in average death rates between the highest-rate states and lowest-rate states were evaluated using a two-tailed z test.
About the authors
Jiaquan Xu is with the National Center for Health Statistics, Division of Vital Statistics, Mortality Statistics Branch.
References
- Centers for Disease Control and Prevention. CDC WONDER. Underlying cause of death: Detailed Mortality.
- Kochanek KD, Murphy SL, Xu JQ, Arias E. Deaths: Final data for 2017pdf icon. National Vital Statistics Reports; vol 68 no 9. Hyattsville, MD: National Center for Health Statistics. 2019.
- World Health Organization. International statistical classification of diseases and related health problems, 10th revision (ICD–10). 5th ed. Geneva, Switzerland. 2016.
- National Center for Health Statistics. U.S. census populations with bridged race categories.
- Heron M. Deaths: Leading causes for 2017pdf icon. National Vital Statistics Reports; vol 68 no 6. Hyattsville, MD: National Center for Health Statistics. 2019.
Suggested citation
Xu JQ. Mortality patterns between five states with highest death rates and five states with lowest death rates: United States, 2017. NCHS Data Brief, no 350. Hyattsville, MD; National Center for Health Statistics. 2019.
Copyright information
All material appearing in this report is in the public domain and may be reproduced or copied without permission; citation as to source, however, is appreciated.
National Center for Health Statistics
Jennifer H. Madans, Ph.D., Acting Director
Amy M. Branum, Ph.D., Acting Associate Director for Science
Division of Vital Statistics
Steven Schwartz, Ph.D., Director
Hanyu Ni, Ph.D., M.P.H., Associate Director for Science