Receipt of Pelvic Examinations Among Women Aged 15–44 in the United States, 1988–2017
- Key findings
- Receipt of pelvic examinations in the past 12 months decreased over time among women aged 15–44.
- Receipt of pelvic examinations in the past 12 months varied by Hispanic origin and race during 2015–2017.
- Receipt of pelvic examinations in the past 12 months varied by socioeconomic status.
- Receipt of pelvic examinations in the past 12 months varied by current health insurance status.
- Summary
- Definitions
- Data source and methods
- About the authors
- References
- Suggested citation
NCHS Data Brief No. 339, June 2019
PDF Versionpdf icon (481 KB)
Gladys M. Martinez, Ph.D., Jin Qin, Sc.D., Mona Saraiya, M.D., M.P.H., and George F. Sawaya, M.D.
Key findings
Data from the National Survey of Family Growth
- A decreasing trend in the receipt of pelvic examinations in the past 12 months among women aged 15–44 was observed from 1988 through 2017.
- A decreasing trend in the receipt of pelvic examinations among women aged 15–20 and 21–29 was observed from 1988 through 2017.
- During 2015–2017, receipt of a pelvic examination in the last 12 months was highest among non-Hispanic black women, followed by non-Hispanic white women and Hispanic women.
- During 2015–2017, receipt of a pelvic examination in the past 12 months increased with increasing levels of education.
Pelvic examination has been commonly performed as part of a physical examination for women in the United States. However, the value of routine pelvic examinations has been questioned recently (1,2). In 2012, the American College of Obstetricians and Gynecologists (ACOG) recommended annual pelvic examinations for women aged 21 and over as part of the well-woman visit (3). In 2018, ACOG advised that pelvic examinations be performed when indicated by medical history or symptoms (4). Using National Survey of Family Growth (NSFG) data through 2017 for women aged 15–44, this report describes trends overall and by age since 1988 in the receipt of pelvic examinations in the past year, and differences by Hispanic origin and race, education, poverty status, and health insurance status for 2015–2017.
Keywords: Hispanic origin and race, poverty level, education, National Survey of Family Growth
Receipt of pelvic examinations in the past 12 months decreased over time among women aged 15–44.
- A decreasing trend in the percentage of women aged 15–44 who received a pelvic examination in the past 12 months was observed from 1988 through 2017 (Figure 1). In 1988, a higher percentage of women received a pelvic examination in the past 12 months (64.9%) than at any of the other time points (52.5%–61.3%).
- The percentage of women aged 15–20 who received a pelvic examination in the past 12 months decreased over time: 42.3% in 1988, 36.7% in 1995, 31.8% in 2002, 24.1% and 21.8%, respectively in the periods 2006–2010 and 2011–2015, and 14.9% during 2015–2017.
- The percentage of women aged 21–29 who received a pelvic examination in the past 12 months decreased over time: 74.6% in 1988; 69.1% in 1995; 63.8%–62.2% in the periods 2002, 2006–2010, and 2011–2015; and 56.5% during 2015–2017.
- The percentage of women aged 30–44 who reported receiving a pelvic examination in the past 12 months showed no statistically significant change over time.
Figure 1. Receipt of pelvic examinations in the past year, by age and survey period: United States, 1988–2017
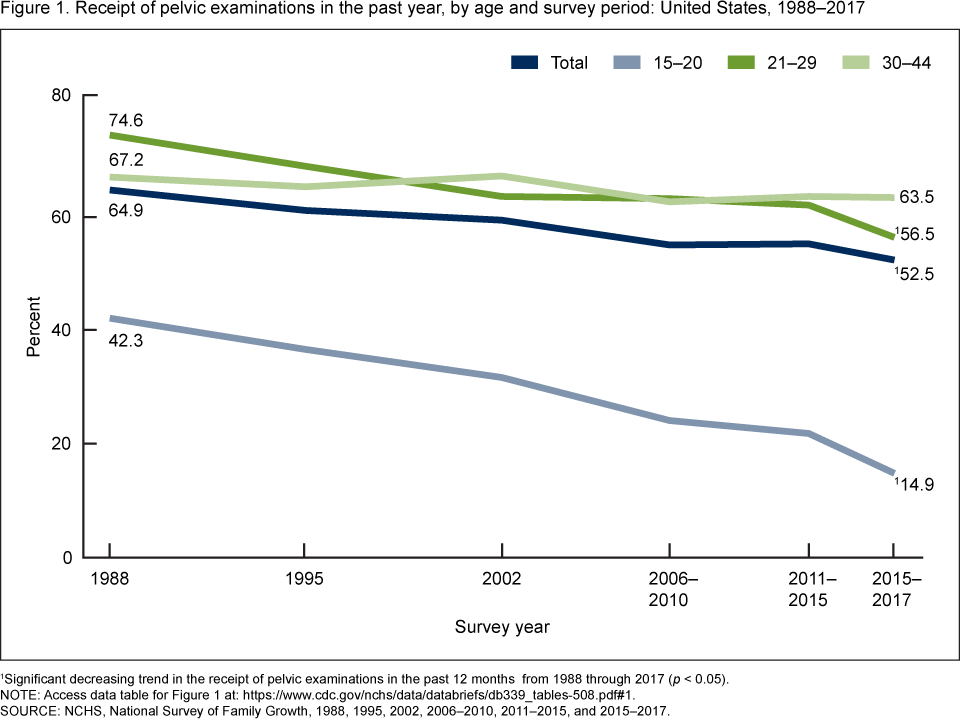
1Significant decreasing trend in the receipt of pelvic examinations in the past 12 months from 1988 through 2017 (p < 0.05).
NOTE: Access data table for Figure 1pdf icon.
SOURCE: NCHS, National Survey of Family Growth, 1988, 1995, 2002, 2006–2010, 2011–2015, and 2015–2017.
Receipt of pelvic examinations in the past 12 months varied by Hispanic origin and race during 2015–2017.
- Receipt of a pelvic examination in the past 12 months was highest among non-Hispanic black women and lowest among Hispanic women (Figure 2). Specifically, 59.5% of non-Hispanic black women, 53.8% of non-Hispanic white women, and 45.4% of Hispanic women received a pelvic examination in the past 12 months.
Figure 2. Receipt of pelvic examinations in the past year, by Hispanic origin and race: United States, 2015–2017
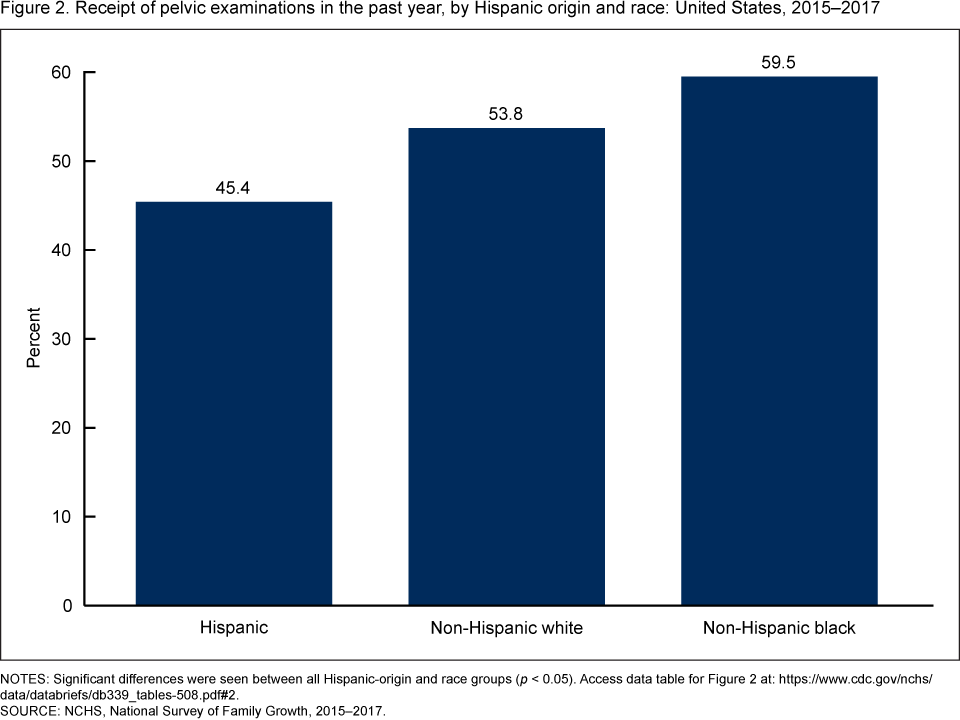
NOTES: Significant differences were seen between all Hispanic-origin and race groups (p < 0.05). Access data table for Figure 2pdf icon.
SOURCE: NCHS, National Survey of Family Growth, 2015–2017.
Receipt of pelvic examinations in the past 12 months varied by socioeconomic status.
- During 2015–2017, receipt of a pelvic examination in the past 12 months among women aged 22–44 increased with increasing education: 51.5% of women with less than a high school diploma, 55.0% of those with a high school diploma, 60.7% of those with some college, and 68.7% of those with a bachelor’s degree (Figure 3).
- Women with household incomes 300% or above the federal poverty level were more likely to have received a pelvic examination in the past 12 months (60.0%) compared with women with household incomes below 150% of the federal poverty level (47.5% ) and women with household incomes 150%–299% of the federal poverty level (49.5%).
Figure 3. Receipt of pelvic examinations in the past year, by education and poverty level: United States, 2015–2017
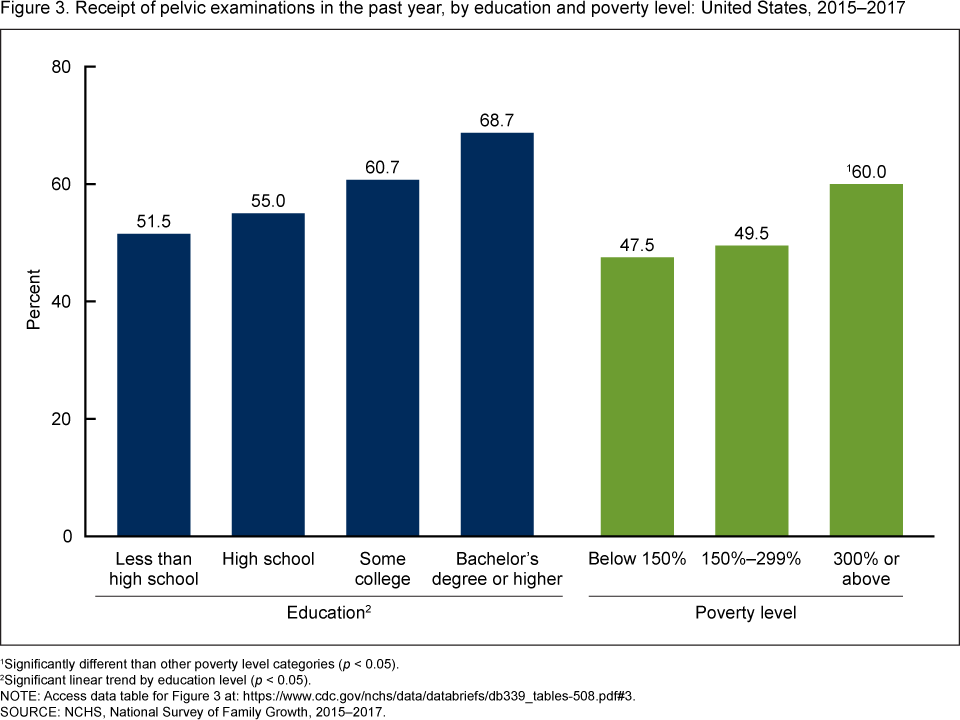
1Significantly different than other poverty level categories (p < 0.05).
2Significant linear trend by education level (p < 0.05).
NOTE: Access data table for Figure 3pdf icon.
SOURCE: NCHS, National Survey of Family Growth, 2015–2017.
Receipt of pelvic examinations in the past 12 months varied by current health insurance status.
- During 2015–2017, women without health insurance coverage were less likely to have received a pelvic examination in the past 12 months (38.9%) compared with women who had private insurance (56.2%), Medicaid (49.1%), or Medicare, military, or other government insurance (58.1%) (Figure 4).
- Women with private insurance were more likely to have received a pelvic examination in the past 12 months (56.2%) than those with Medicaid as their health insurance (49.1%).
Figure 4. Receipt of pelvic examinations in the past year, by current health insurance status: United States, 2015–2017
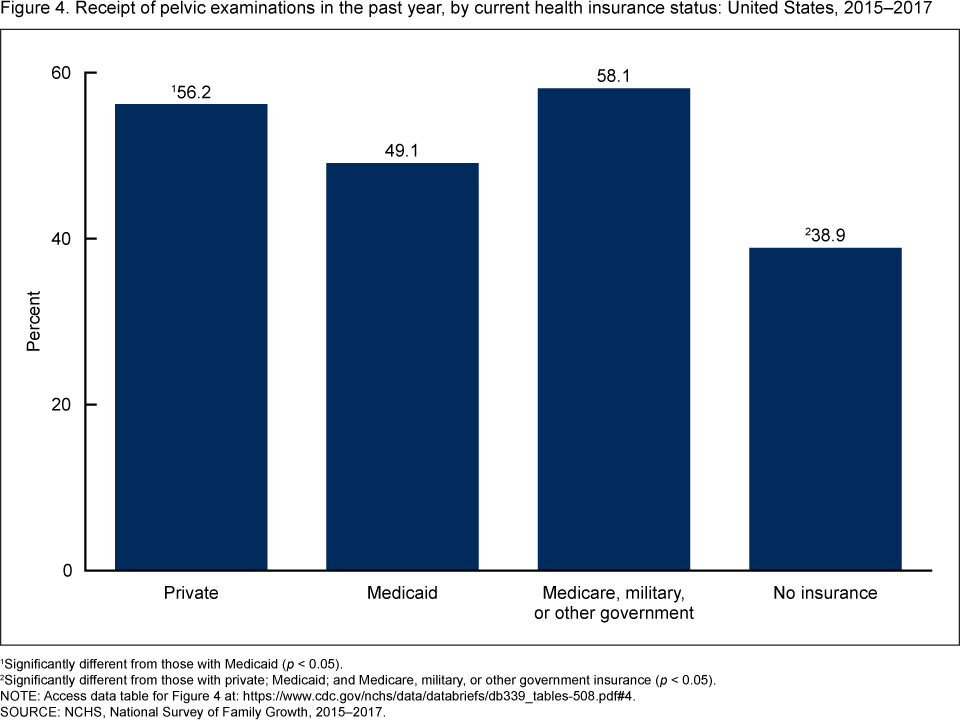
1Significantly different from those with Medicaid (p < 0.05).
2Significantly different from those with private; Medicaid; and Medicare, military, or other government insurance (p < 0.05).
NOTE: Access data table for Figure 4pdf icon.
SOURCE: NCHS, National Survey of Family Growth, 2015–2017.
Summary
This report describes trends in and characteristics of receipt of pelvic examinations in the past 12 months among women aged 15–44 in the United States. Women aged 15–44 in 1988 were more likely to have received a pelvic examination compared with women at any later NSFG survey period. The decrease in the receipt of pelvic examinations among women aged 15–44 occurred primarily among women aged 15–29. From 1988 through 2017, the percentage of women receiving pelvic examinations in the past 12 months decreased by 65% for women aged 15–20, 57% for women aged 21–29, and 6% for women aged 30–44. Women of lower socioeconomic status (lower levels of education and household income) were less likely than those of higher socioeconomic status to have received a pelvic examination in the past 12 months. Women without health insurance were less likely to have received a pelvic examination in the past 12 months compared with those with private; Medicaid; or Medicare, military, or other government insurance. These results could provide a benchmark for estimates of the prevalence of pelvic examinations before the 2018 ACOG-updated guidelines.
Definitions
Age: Respondent’s age at the time of the interview. The recode variable AGER was used.
Education: Educational attainment at the time of the interview, indicating the highest degree or grade finished. Results are presented only for women aged 22 and over because many younger women have not completed their education. The recode variable HIEDUC was used.
Health insurance: A measure of health insurance status at the time of the interview. For this report, the categories are combined into four mutually exclusive categories: private health insurance only; Medicaid; Medicare, military, or other government; and uninsured (includes no health insurance or having a single-service plan). The recode variable CURR_INS was used.
Hispanic origin and race: This report used the NSFG recode variable HISPRACE2, which conforms with the Office of Management and Budget’s 1997 guidelines for the collection and presentation of race and Hispanic-origin data in federal statistics systems, allowing respondents to report more than one racial or ethnic origin (5). The categories shown separately in this report are Hispanic; non-Hispanic white, single race; and non-Hispanic black, single race. Non-Hispanic respondents of other races or those reporting multiple races are included in the overall estimates but are not shown separately in figures due to the diversity of this group. The shorter phrase “non-Hispanic white women” refers to non-Hispanic white, single-race women, and “non-Hispanic black women” refers to non-Hispanic black, single-race women.
Pelvic examination: NSFG asked respondents, “(In the past 12 months have you received) a pelvic exam—where a doctor or nurse puts one hand in the vagina and the other on the abdomen?” The description of the examination was added in 2011; previously, the question asked, “In the past 12 months have you received a pelvic exam?” The variable was PELVIC12.
Poverty level: A measure of the household’s income expressed as a percentage of the federal poverty-level threshold for a household of that size. The recode variable POVERTY was used.
Data source and methods
This report is based primarily on interview data from the 10,094 women aged 15–44 in the 2015–2017 NSFG public-use data files. NSFG is a nationally representative survey of women and men aged 15–49 in the U.S. household population that gathers data on fertility, cohabitation, marriage, divorce, infertility, use of contraception, and general and reproductive health. More information is available on the NSFG website: https://www.cdc.gov/nchs/nsfg/index.htm
The data presented in this report are bivariate associations that may be explained by other factors. For example, age differences between two groups could explain differences in the outcomes. Statistics for this report were produced using the SURVEY procedures in SAS software version 9.4 and Proc Descript in SAS-callable Sudaan. Percentages were compared using two-tailed t tests at the 0.05 level. No adjustments were made for multiple comparisons. A weighted least-squares regression method was used to test the significance of trends that involved more than two time points or more than two age, education, or poverty groups. When this method was used, terms that refer to percentages that “increased” or “decreased” indicate that there was a significant difference over time or across groups. This report follows National Center for Health Statistics data presentation standards for proportions (6).
About the authors
Gladys M. Martinez is with the National Center for Health Statistics, Division of Vital Statistics. Jin Qin and Mona Saraiya are with the National Center for Chronic Disease Prevention and Health Promotion, Division of Cancer Prevention and Control. George F. Sawaya is with the University of California, San Francisco, Department of Obstetrics, Gynecology, and Reproductive Sciences.
References
- U.S. Preventive Services Task Force, Bibbins-Domingo K, Grossman DC, Curry SJ, Barry MJ, Davidson KW, et al. Screening for gynecologic conditions with pelvic examination: US Preventive Services Task Force recommendation statement. JAMA 317(9):947–53. 2017.
- Qaseem A, Humphrey LL, Harris R, Starkey M, Denberg TD, Clinical Guidelines Committee of the American College of Physicians. Screening pelvic examination in adult women: A clinical practice guideline from the American College of Physicians. Ann Intern Med 161(1):67–72. 2014.
- Committee on Gynecologic Practice. Committee opinion no. 534: Well-woman visit. Obstet Gynecol 120(2 Pt 1):421–4. 2012.
- ACOG Committee opinion no. 754: The utility of and indications for routine pelvic examination. Obstet Gynecol 132(4):e174–80. 2018.
- Office of Management and Budget. Revisions to the standards for the classification of federal data on race and ethnicity. Fed Regist 62(210):58782–90. 1997.
- Parker JD, Talih M, Malec DJ, Beresovsky V, Carroll M, Gonzalez JF Jr, et al. National Center for Health Statistics Data Presentation Standards for Proportions. National Center for Health Statistics. Vital Health Stat 2(175). 2017.
Suggested citation
Martinez GM, Qin J, Saraiya M, Sawaya GF. Receipt of pelvic examinations among women aged 15–44 in the United States, 1988–2017. NCHS Data Brief, no 339. Hyattsville, MD: National Center for Health Statistics. 2019.
Copyright information
All material appearing in this report is in the public domain and may be reproduced or copied without permission; citation as to source, however, is appreciated.
National Center for Health Statistics
Jennifer H. Madans, Ph.D., Acting Director
Amy M. Branum, Ph.D., Acting Associate Director for Science
Division of Vital Statistics
Steven Schwartz, Ph.D., Director
Hanyu Ni, Ph.D., M.P.H., Associate Director for Science