Strategies Used by Adults Aged 18–64 to Reduce Their Prescription Drug Costs, 2017
- Key findings
- Use of strategies to reduce prescription drug costs decreased from 2013 through 2015 and then remained relatively constant from 2015 through 2017 among adults aged 18–64 who were prescribed medication in the past 12 months.
- The percentage who asked their doctor for a lower-cost medication was highest among women and uninsured adults.
- In 2017, the percentage who did not take their medication as prescribed to reduce their prescription drug costs was highest among women and uninsured adults.
- The percentage who used alternative therapies to reduce their prescription drug costs was highest among women and uninsured adults.
- Summary
- Definitions
- Data source and methods
- About the authors
- References
- Suggested citation
NCHS Data Brief No. 333, March 2019
PDF Versionpdf icon (481 KB)
Robin A. Cohen, Ph.D., Peter Boersma, M.P.H., and Anjel Vahratian, Ph.D., M.P.H.
Key findings
Data from the National Health Interview Survey
- Among adults aged 18–64 who were prescribed medication in the past 12 months, the percentage who used selected strategies to reduce their prescription drug costs in the past 12 months decreased from 2013 through 2015 and then remained stable from 2015 through 2017.
- In 2017, among adults aged 18–64 who were prescribed medication, women were more likely than men to use selected strategies to reduce their prescription drug costs.
- In 2017, strategies for reducing prescription drug costs were most commonly practiced among those who were uninsured compared with those with private insurance or Medicaid, as 39.5% asked their doctor for a lower-cost medication, 33.6% did not take their medication as prescribed, and 13.9% used alternative therapies.
In 2017, nearly 60% of U.S. adults aged 18–64 reported being prescribed medication in the past 12 months (1). Approximately 70% of prescription medications carry out-of-pocket costs, with generics costing on average $6 and brand names costing on average $30 (2). Strategies to reduce prescription drug costs at the individual level may include asking one’s doctor for a lower-cost medication, not taking medication as prescribed, or using alternative therapies (3). This report examines changes over time in the percentage of adults aged 18–64 who were prescribed medication and reported using these selected strategies to reduce their prescription drug costs in the past 12 months.
Keywords: medication, non-adherence, National Health Interview Survey
Use of strategies to reduce prescription drug costs decreased from 2013 through 2015 and then remained relatively constant from 2015 through 2017 among adults aged 18–64 who were prescribed medication in the past 12 months.
- The percentage of adults aged 18–64 who were prescribed medication in the past 12 months who asked their doctor for a lower-cost medication decreased from 25.8% in 2013 to 19.8% in 2015, and then remained relatively constant from 2015 through 2017 (19.5%) (Figure 1).
- The percentage of adults aged 18–64 who did not take medication as prescribed decreased from 14.9% in 2013 to 11.1% in 2015, and then remained relatively constant from 2015 through 2017 (11.4%).
- The percentage of adults aged 18–64 who used alternative therapies decreased from 5.8% in 2013 to 4.8% in 2015, and then remained relatively constant from 2015 through 2017 (5.4%).
Figure 1. Percentage of adults aged 18–64 who were prescribed medication in the past 12 months who used selected strategies to reduce prescription drug costs, by year: United States, 2013–2017
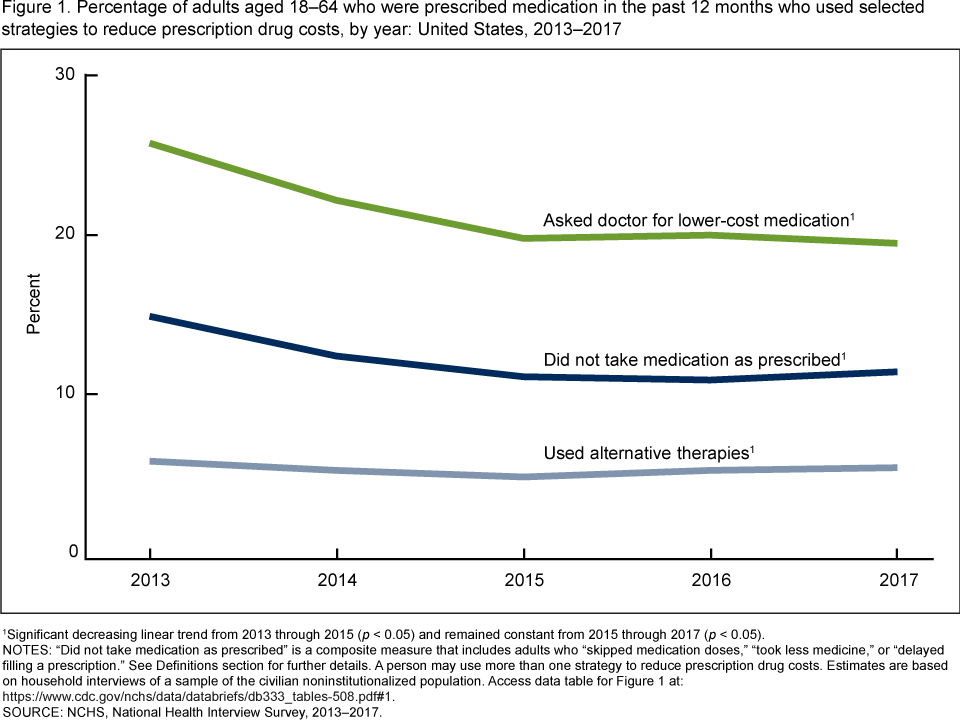
1Significant decreasing linear trend from 2013 through 2015 (p < 0.05) and remained constant from 2015 through 2017 (p < 0.05).
NOTES: Access data table for Figure 1pdf icon.
SOURCE: NCHS, National Health Interview Survey, 2013–2017.
The percentage who asked their doctor for a lower-cost medication was
highest among women and uninsured adults.
- Among adults aged 18–64 who were prescribed medication in the past 12 months, 19.5% asked their doctor for a lower-cost medication in the past 12 months to reduce their prescription drug costs (Figure 2).
- Women (22.0%) were more likely than men (16.4%) to ask their doctor for a lower-cost medication
Figure 2. Percentage of adults aged 18–64 who were prescribed medication in the past 12 months who asked their doctor for a lower-cost medication, by sex and health insurance status: United States, 2017
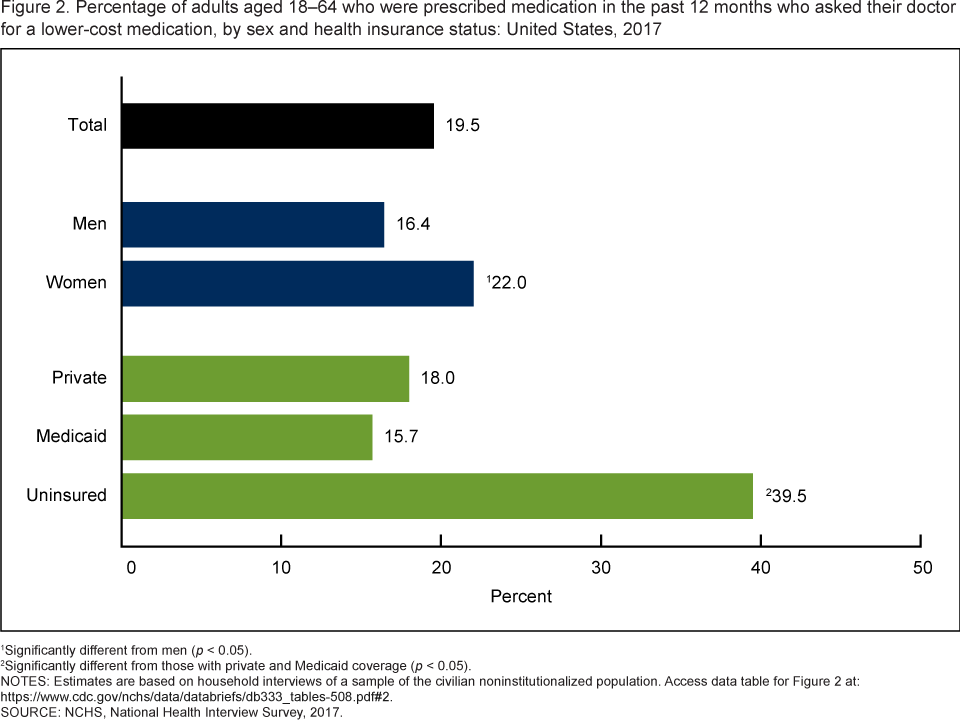
1Significantly different from men (p < 0.05).
2Significantly different from those with private coverage (p < 0.05).
3Significantly different from those with Medicaid coverage (p < 0.05).
NOTES: Estimates are based on household interviews of a sample of the civilian noninstitutionalized population Access data table for Figure 3pdf icon.
SOURCE: NCHS, National Health Interview Survey, 2017.
In 2017, the percentage who did not take their medication as prescribed to reduce their prescription drug costs was highest among women and uninsured adults.
- Among adults aged 18–64 who were prescribed medication in the past 12 months, 11.4% did not taken their medication as prescribed to reduce their prescription drug costs (Figure 3).
- Women (12.7%) were more likely than men (9.7%) to not take their medication as prescribed.
- Uninsured adults (33.6%) were more likely than those with private health insurance (8.4%) or Medicaid coverage (12.5%) to not take their medication as prescribed, while adults with Medicaid coverage were more likely than those with private health insurance to use this strategy.
Figure 3. Percentage of adults aged 18–64 who were prescribed medication in the past 12 months who did not take their medication as prescribed to reduce prescription drug costs, by sex and health insurance status: United States, 2017
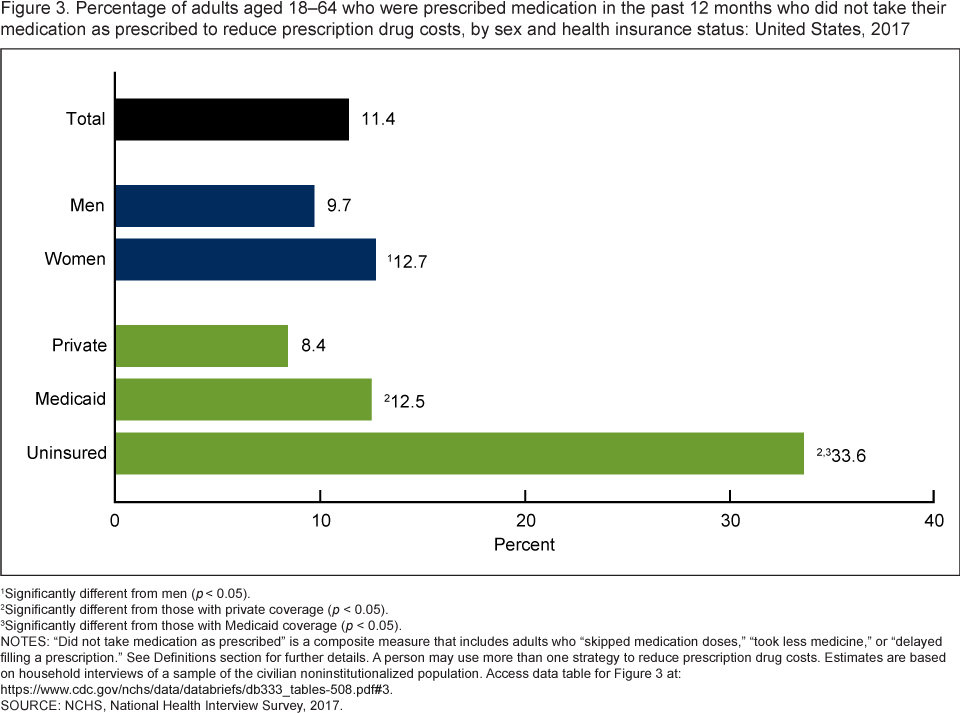
1Significantly different from men (p < 0.05).
2Significantly different from those with private coverage (p < 0.05).
3Significantly different from those with Medicaid coverage (p < 0.05).
NOTES: “Did not take medication as prescribed” is a composite measure that includes adults who “skipped medication doses,” “took less medicine,” or “delayed filling a prescription.” See Definitions section for further details. A person may use more than one strategy to reduce prescription drug costs. Estimates are based on household interviews of a sample of the civilian noninstitutionalized population. Access data table for Figure 3pdf icon.
SOURCE: NCHS, National Health Interview Survey, 2017.
The percentage who used alternative therapies to reduce their prescription drug costs was highest among women and uninsured adults.
- Among adults aged 18–64 who were prescribed medication in the past 12 months, 5.4% used alternative therapies to reduce their prescription drug costs (Figure 4).
- Women (6.6%) were more likely than men (3.9%) to use alternative therapies.
- Uninsured adults (13.9%) were more likely than those with private health insurance (4.4%) or Medicaid coverage (6.4%) to use alternative therapies. Adults with Medicaid coverage were more likely than those with private health insurance to use alternative therapies.
Figure 4. Percentage of adults aged 18–64 who were prescribed medication in the past 12 months who used alternative therapies to reduce prescription drug costs, by sex and health insurance status: United States, 2017
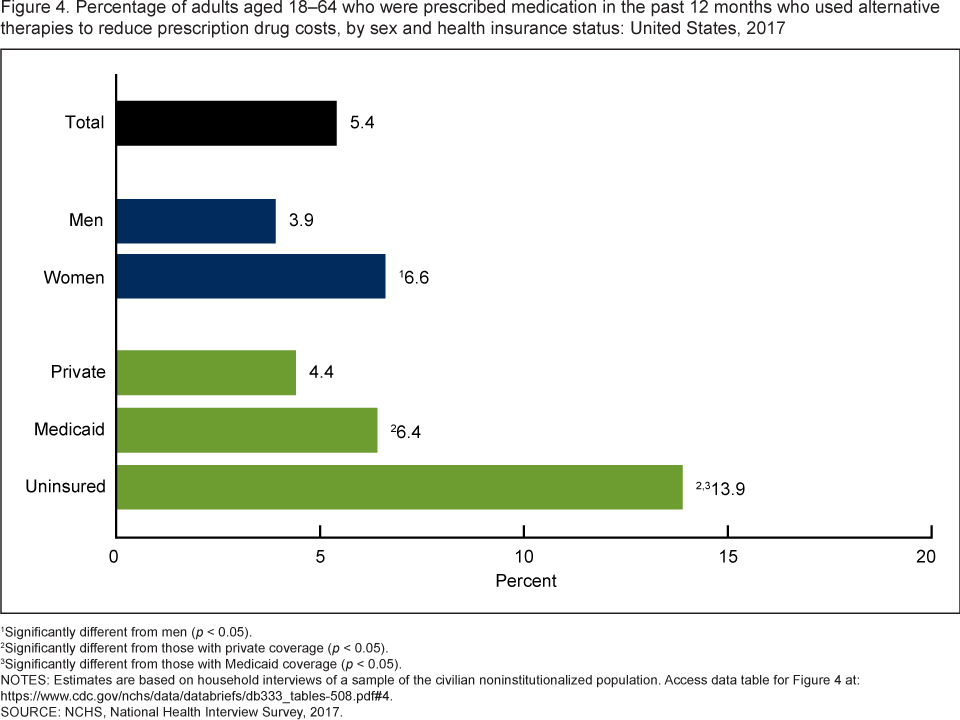
1Significantly different from men (p < 0.05).
2Significantly different from those with private coverage (p < 0.05).
3Significantly different from those with Medicaid coverage (p < 0.05).
NOTES: Estimates are based on household interviews of a sample of the civilian noninstitutionalized population. Access data table for Figure 4pdf icon.
SOURCE: NCHS, National Health Interview Survey, 2017.
Summary
Among U.S. adults aged 18–64 who were prescribed medication in the past 12 months, the percentage who did not take their medication as prescribed, asked their doctor for a lower-cost medication, or used alternative therapies to reduce prescription drug costs decreased from 2013 through 2015, and then remained relatively constant from 2015 through 2017. In 2017, strategies for reducing prescription drug costs were most commonly practiced among those who were uninsured, as 39.5% asked their doctor for a lower-cost medication, 33.6% did not take their medication as prescribed, and 13.9% used alternative therapies. Women were more likely than men to use each of these strategies.
In 2017, total retail prescription drug spending accounted for 10% of total national health expenditures. However, the growth in national retail prescription drug spending has slowed in recent years (4). Approximately 70% of prescriptions have an out-of-pocket cost, with the out-of-pocket cost for a generic prescription costing on average $6 and a brand name prescription costing on average $30 (2). Cost-saving strategies to reduce prescription drug costs may have implications for health status and have been associated with increased emergency room use and hospitalizations compared with adults who follow recommended pharmacotherapy (5,6).
Definitions
Strategies for reducing prescription drug costs: Based on the following questions: The following questions concern the use of prescription medication: During the past 12 months, are any of the following true for you? …[1] You skipped medication doses to save money …[2] You took less medicine to save money …[3] You delayed filling a prescription to save money … [4] You asked your doctor for a lower-cost medication to save money …[5] You used alternative therapies to save money. Adults were asked questions 1 through 4 only if they reported having been prescribed medication by a doctor or other health care provider during the past 12 months. All adults were asked question 5, including those who might not be taking prescription medication. For this analysis, only those adults who were prescribed medication in the past 12 months were included.
Did not take medication as prescribed: Based on a positive response to any of the following three questions described previously: …You skipped medication doses to save money …You took less medicine to save money …You delayed filling a prescription to save money.
Health insurance coverage: At the time of interview, respondents reported their type(s) of coverage. A health insurance hierarchy of four mutually exclusive categories was developed (7). Adults with more than one type of health insurance were assigned to the first appropriate category in the following hierarchy: Private coverage, Medicaid (includes state-sponsored health plans including the Children’s Health Insurance Program [CHIP]), other coverage (includes Medicare, other government, and military coverage), and uninsured. Adults with “other coverage” are included in the totals but are not shown separately.
In this report, strategies used to reduce prescription drug costs are based on the 12 months prior to interview, while health insurance coverage was measured at the time of interview. Therefore, the adults’ health insurance status may have been different at the time they used a strategy to reduce their prescription drug costs.
Data source and methods
Data from the 2013–2017 National Health Interview Survey (NHIS) were used for this analysis. NHIS is a nationally representative, household survey of the civilian noninstitutionalized U.S. population. It is conducted continuously throughout the year by the National Center for Health Statistics (NCHS). Interviews are conducted in the respondent’s home, but follow-ups to complete interviews may be conducted by telephone when necessary. For more information about NHIS, visit the NHIS website: https://www.cdc.gov/nchs/nhis.htm.
Point estimates and the corresponding variances were calculated using SUDAAN software (8) to account for the complex sample design of NHIS. All estimates in this report meet NCHS standards of reliability as specified in “National Center for Health Statistics Data Presentation Standards for Proportions” (9). Linear trends by year were evaluated using logistic regression. Differences between percentages were evaluated using two-sided significance tests at the 0.05 level.
About the authors
Robin A. Cohen, Peter Boersma, and Anjel Vahratian are with the National Center for Health Statistics, Division of Health Interview Statistics.
References
- Boersma P, Cohen RA, Vahratian A. QuickStats: Percentage of adults aged ≥ 18 years who were prescribed medication in the past 12 months, by sex and age group—National Health Interview Survey, 2017. MMWR 68(4):97. 2019.
- IQVIA Institute for Human Data Science. Medicine use and spending in the U.S.: A review of 2017 and outlook to 2022.external icon. 2018.
- Cohen RA, Villarroel MA. Strategies used by adults to reduce their prescription drug costs: United States, 2013. NCHS Data Brief, no 184. Hyattsville, MD: National Center for Health Statistics. 2015.
- Martin AB, Hartman M, Washington B, Catlin A. National health care spending in 2017: Growth slows to post-great recession rates; Share of GDP stabilizes. Health Aff (Millwood) 38(1):96–106. 2019.
- Heisler M, Choi H, Rosen AB, Vijan S, Kabeto M, Langa KM, Piette JD. Hospitalizations and deaths among adults with cardiovascular disease who underuse medications because of cost: A longitudinal analysis. Med Care 48(2):87–94. 2010.
- Jha AK, Aubert RE, Yao J, Teagarden JR, Epstein RS. Greater adherence to diabetes drugs is linked to less hospital use and could save nearly $5 billion annually. Health Aff (Millwood) 31(8):1836–46. 2012.
- Bloom B, Simpson G, Cohen RA, Parsons PE. Access to health care. Part 2: Working-age adultspdf icon. National Center for Health Statistics. Vital Health Stat 10(197). 1997
- RTI International. SUDAAN (Release 11.0.01) [computer software]. 2013.
- Parker JD, Talih M, Malec DJ, Beresovsky V, Carroll M, Gonzalez Jr JF. National Center for Health Statistics Data Presentation Standards for Proportionspdf icon. National Center for Health Statistics. Vital Health Stat 2(175). 2017.
Suggested citation
Cohen RA, Boersma P, Vahratian A. Strategies used by adults aged 18–64 to reduce their prescription drug costs, 2017. NCHS Data Brief, no 333. Hyattsville, MD: National Center for Health Statistics. 2019.
Copyright information
All material appearing in this report is in the public domain and may be reproduced or copied without permission; citation as to source, however, is appreciated.
National Center for Health Statistics
Jennifer H. Madans, Ph.D., Acting Director
Amy M. Branum, Ph.D., Acting Associate Director for Science
Division of Health Interview Statistics
Stephen J. Blumberg, Ph.D., Director
Anjel Vahratian, Ph.D., M.P.H., Acting Associate Director for Science