Trends in Fertility and Mother’s Age at First Birth Among Rural and Metropolitan Counties: United States, 2007–2017
- Key findings
- From 2007 through 2017, total fertility rates declined for each urbanization level, but differences between rural and metro counties widened.
- From 2007 to 2017, total fertility rates declined for all three race and Hispanic-origin groups for rural and metro counties.
- From 2007 through 2017, the mean maternal age at first birth increased for rural and metro counties, but differences in mean age among rural and metro counties widened.
- From 2007 to 2017, the mean maternal age at first birth increased in each urbanization level for all race and Hispanic-origin groups.
- Summary
- Definitions
- Data sources and methods
- About the authors
- References
- Suggested citation
NCHS Data Brief No. 323, October 2018
PDF Versionpdf icon (481 KB)
Danielle M. Ely, Ph.D., and Brady E. Hamilton, Ph.D.
Key findings
Data from the National Vital Statistics System
- During 2007–2017, total fertility rates in the United States fell for rural and metropolitan counties: 12% in rural, 16% in small or medium metro, and 18% in large metro counties.
- Rural counties had higher total fertility rates for each year from 2007 through 2017 compared with small or medium and large metro counties.
- During 2007–2017, the mean age of mothers at first birth rose by 1.3 (rural), 1.5 (small or medium metro), and 1.8 years (large metro).
- For all years, the mean age of mothers at first birth was lower in rural counties compared with metro counties.
- Downward trends in total fertility rates and increases in mean maternal age over time occurred in rural and metro counties for each selected race and Hispanic-origin group.
Since the most recent peak in the total fertility rate (the estimated number of lifetime births expected per 1,000 women) in 2007, the United States has experienced a decreasing total fertility rate and an increasing mean, or average, age of mothers at first birth (1–4). Previous research shows rural areas have persistently higher fertility and worse birth outcomes compared with metropolitan (metro) areas (2,5–8). This report describes trends and differences in total fertility rates and mean maternal age at first birth overall, and by race and Hispanic origin, between rural and small or medium metro, and rural and large metro counties, from 2007 through 2017.
Keywords: race and Hispanic origin, National Vital Statistics System
From 2007 through 2017, total fertility rates declined for each urbanization level, but differences between rural and metro counties widened.
- The total fertility rate in rural counties declined 9% from 2007 through 2011 and did not change significantly from 2011 through 2017 (Figure 1). Total fertility rates in small or medium metro and large metro counties decreased 16% and 18%, respectively, from 2007 through 2017.
- In 2007, the total fertility rate in rural counties was 5% higher than total fertility rates in small or medium metro and large metro counties. In 2017, these differences widened to 10% and 14%, respectively.
- In 2017, the total fertility rate for rural counties was 1,950.0 births per 1,000 women compared with 1,778.0 in small or medium metro and 1,712.0 in large metro counties.
Figure 1. Total fertility rate, by urbanization level: United States, 2007–2017
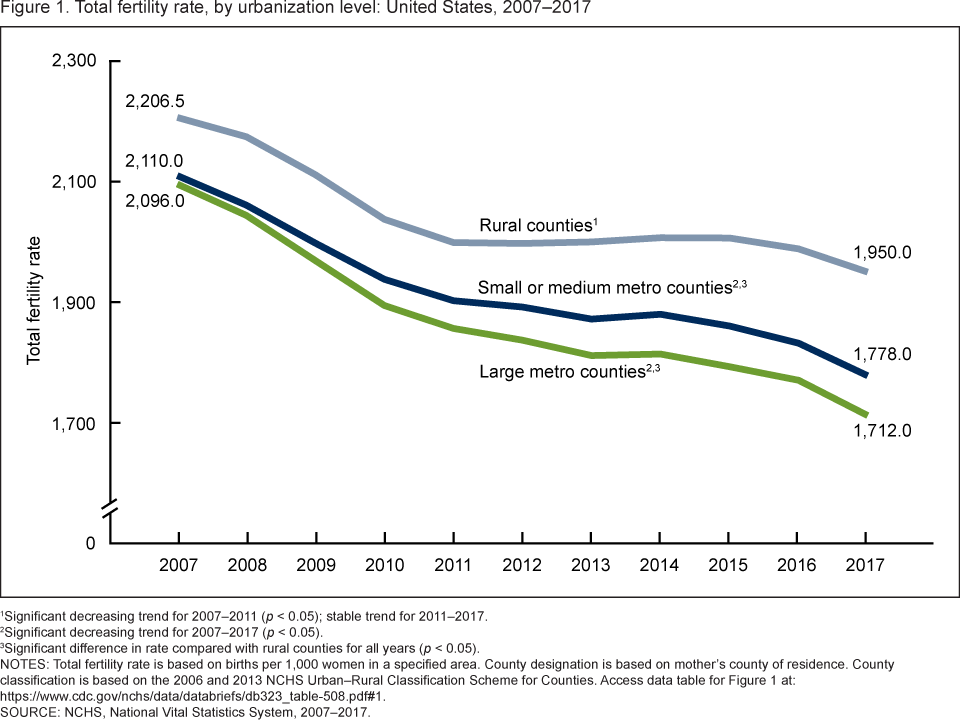
1Significant decreasing trend for 2007–2011 (p < 0.05); stable trend for 2011–2017.
2Significant decreasing trend for 2007–2017 (p < 0.05).
3Significant difference in rate compared with rural counties for all years (p < 0.05).
NOTES: Total fertility rate is based on births per 1,000 women in a specified area. County designation is based on mother’s county of residence. County classification is based on the 2006 and 2013 NCHS Urban–Rural Classification Scheme for Counties. Access data table for Figure 1pdf icon.
SOURCE: NCHS, National Vital Statistics System, 2007–2017.
From 2007 to 2017, total fertility rates declined for all three race and Hispanic-origin groups for rural and metro counties.
- In 2017 compared with 2007, among the three race and Hispanic-origin groups, the largest decline in total fertility rates occurred among Hispanic women, the group with the highest rates (26% in rural, 29% in small or medium metro, and 30% in large metro counties) (Figure 2).
- Total fertility rates were higher in rural counties compared with small or medium metro and large metro counties for non-Hispanic white and Hispanic women in both 2007 and 2017.
- Among non-Hispanic black women, the total fertility rate was higher in rural counties compared to small or medium and large metro in 2007, but in 2017 the rate was higher in small or medium metro counties compared to rural.
Figure 2. Total fertility rate, by race and Hispanic origin and urbanization level: United States, 2007 and 2017
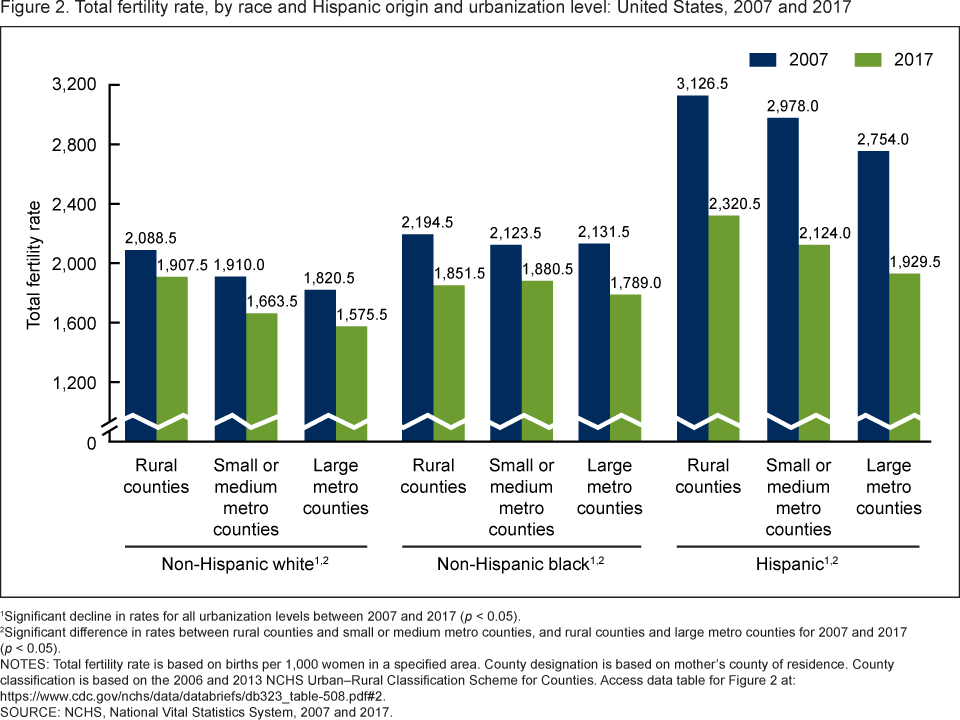
1Significant decline in rates for all urbanization levels between 2007 and 2017 (p < 0.05).
2Significant difference in rates between rural counties and small or medium metro counties, and rural counties and large metro counties for 2007 and 2017 (p < 0.05).
NOTES: Total fertility rate is based on births per 1,000 women in a specified area. County designation is based on mother’s county of residence. County classification is based on the 2006 and 2013 NCHS Urban–Rural Classification Scheme for Counties. Access data table for Figure 2pdf icon.
SOURCE: NCHS, National Vital Statistics System, 2007 and 2017.
From 2007 through 2017, the mean maternal age at first birth increased for rural and metro counties, but differences in mean age among rural and metro counties widened.
- The mean maternal age at first birth increased by 1.3 years in rural counties, 1.5 years in small or medium metro counties, and 1.8 years in large metro counties from 2007 through 2017 (Figure 3).
- For all years 2007 through 2017, the mean age at first birth in rural counties (23.2 years in 2007 and 24.5 in 2017) was lower than the mean age in small or medium metro counties (24.3 in 2007 and 25.8 in 2017) and large metro counties (25.9 in 2007 and 27.7 in 2017).
- Between 2007 and 2017, the difference in mean maternal age at first birth widened from 1.1 to 1.3 years between rural and small or medium metro counties, and from 2.7 to 3.2 years between rural and large metro counties.
Figure 3. Mean age at first birth, by urbanization level: United States, 2007–2017
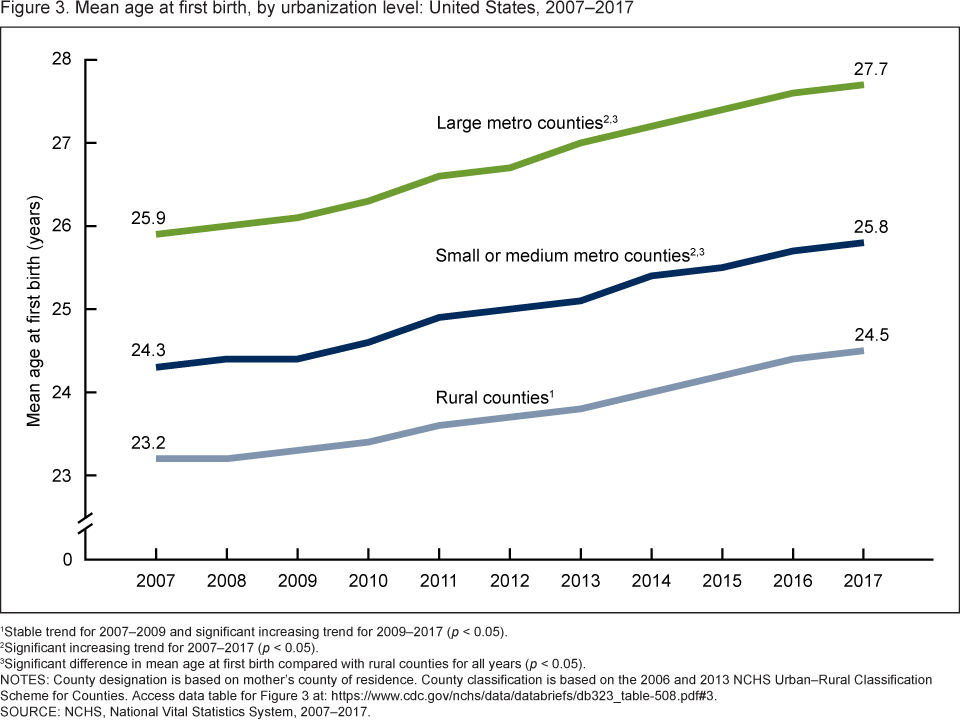
1Stable trend for 2007–2009 and significant increasing trend for 2009–2017 (p < 0.05).
2Significant increasing trend for 2007–2017 (p < 0.05).
3Significant difference in mean age at first birth compared with rural counties for all years (p < 0.05).
NOTES: County designation is based on mother’s county of residence. County classification is based on the 2006 and 2013 NCHS Urban–Rural Classification Scheme for Counties. Access data table for Figure 3pdf icon.
SOURCE: NCHS, National Vital Statistics System, 2007–2017.
From 2007 to 2017, the mean maternal age at first birth increased in each urbanization level for all race and Hispanic-origin groups.
- Among the three race and Hispanic-origin groups, non-Hispanic black mothers had the largest increase in mean age at first birth in 2017, compared with 2007, with rises of 1.7 years in rural, 1.9 years in small or medium metro, and 2.4 years in large metro counties (Figure 4).
- In 2007 and 2017, the mean age at first birth was consistently lower in rural counties compared with both types of metro counties, regardless of race and Hispanic origin.
Figure 4. Mean age at first birth, by race and Hispanic origin and urbanization level: United States, 2007 and 2017
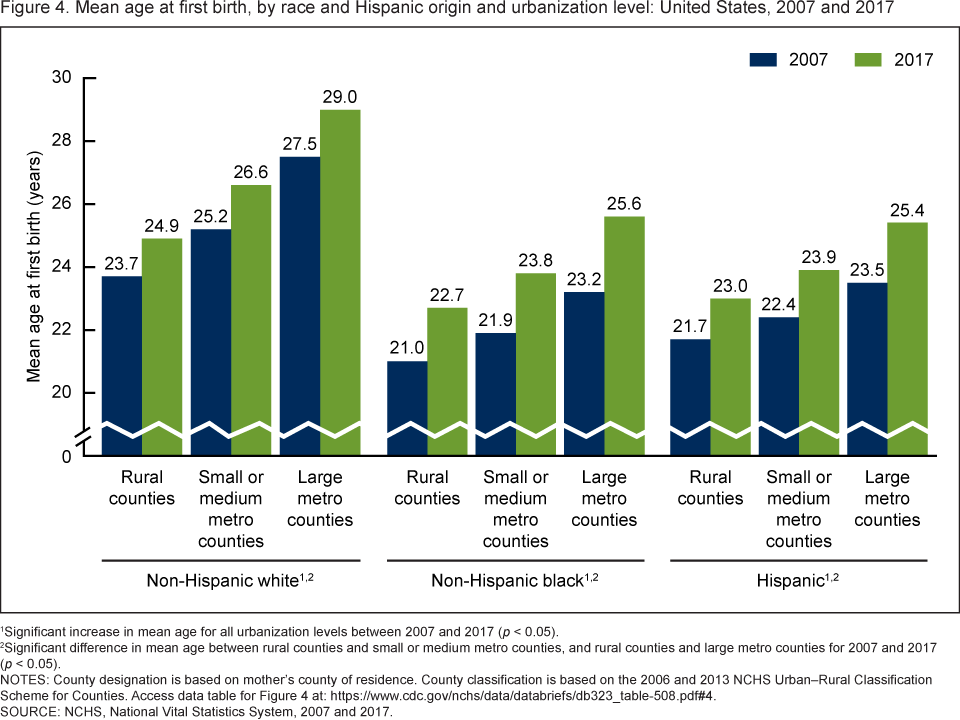
1Significant increase in mean age for all urbanization levels between 2007 and 2017 (p < 0.05).
2Significant difference in mean age between rural counties and small or medium metro counties, and rural counties and large metro counties for 2007 and 2017 (p < 0.05).
NOTES: County designation is based on mother’s county of residence. County classification is based on the 2006 and 2013 NCHS Urban–Rural Classification Scheme for Counties. Access data table for Figure 4pdf icon.
SOURCE: NCHS, National Vital Statistics System, 2007 and 2017.
Summary
This report shows declines in the total fertility rate and increases in the mean age of mothers at first birth for rural, small or medium metro, and large metro counties in the United States from 2007 through 2017. It also demonstrates differences in total fertility rates and mean age at first birth between rural and metro counties. The total fertility rate in rural counties was higher and the mean age at first birth lower compared with small or medium metro counties and large metro counties. The differences in total fertility rates and mothers mean age at first birth between rural and metro areas widened over the study period. Declines in total fertility rates and increases in mean maternal age were also observed for women of each race and Hispanic-origin group, non-Hispanic white, non-Hispanic black, and Hispanic, by urbanization level from 2007 to 2017. The mean age at first birth was lower for each race and Hispanic-origin group in rural counties than in small or medium metro counties, or in large metro counties, with the differences widening over the study period. The differences in total fertility rates between rural and metro areas are consistent with previous research describing differences in childbearing behaviors and a higher average number of children in rural areas compared with metro areas (5,7).
Definitions
Mean age at first birth: The arithmetic average of the age of mothers at the time of first birth, computed directly from the frequency of first births by age of mother (1).
Race and Hispanic origin: Race and Hispanic origin are reported separately on birth certificates. Persons of Hispanic origin may be of any race. Persons of non-Hispanic ancestry are further classified by race because of differences in fertility and maternal characteristics between Hispanic and non-Hispanic persons. Multiple-race data reported were bridged to single-race categories for comparability with earlier years (1). Multiple-race reporting areas vary in 2007 and 2017, with all states and the District of Columbia reporting multiple race data in 2017 (1).
Total fertility rate: Estimation of the number of births that a hypothetical group of 1,000 women would have over their lifetimes, based on age-specific birth rates in a given year (1).
Urbanization level: County classification as metropolitan (metro) or rural is based on the county of maternal residence (8). Counties were classified according to their metropolitan status using the National Center for Health Statistics (NCHS) Urban–Rural Classification Scheme. Metropolitan counties include large central counties, the fringes of large counties (suburbs), medium counties, and small counties. Nonmetropolitan counties (i.e., rural) include micropolitan statistical areas and noncore areas, including open countryside, rural towns (populations of less than 2,500), and areas with populations of 2,500–49,999 that are not part of larger labor market areas (metropolitan areas). For this report, county of residence was categorized by collapsing these categories into two metro and one nonmetro categories: large metropolitan, and small or medium metropolitan. Rural counties include micropolitan and noncore counties.
Data sources and methods
This study analyzed data from the birth data set, which is part of the National Vital Statistics System. The birth data set is the primary data set for analyzing birth trends and patterns in the United States. Birth data sets are available from Vital Statistics Data Available Online.
Population data for computing birth rates were provided by the U.S. Census Bureau and are based on the April 1, 2000, and April 1, 2010 censuses (9).
For all figures, rural is the reference area; comparisons of rural with small or medium metro, and rural with large metro counties were performed to assess differences between rural and metro areas. The focus of this report is on rural compared with metropolitan areas given historic differences between these areas for race and Hispanic origin composition and fertility patterns (2,5,6).
References to differences, decreases, and increases in rates or means indicate that the changes are statistically significant at the 0.05 level.
References to trends in rates for Figure 1 and mean age in Figure 3 were evaluated using the Joinpoint Regression Program (10). A maximum of 1 joinpoint is allowed during the 2007–2017 period, which is the default setting. The default settings were also selected for the other parameters of the analysis. For details, see reference 11. The differences between the rates and means were evaluated using a two-tailed z test at the 0.05 level.
About the authors
Danielle M. Ely and Brady E. Hamilton are with the National Center for Health Statistics, Division of Vital Statistics, Reproductive Statistics Branch.
References
- Martin JA, Hamilton BE, Osterman MJK, Driscoll AK, Drake P. Births: Final data for 2017. National Vital Statistics Reports; vol 67 no 8. Hyattsville, MD: National Center for Health Statistics. 2018 [Forthcoming].
- Hamilton BE, Rossen LM, Branum AM. Teen birth rates for urban and rural areas in the United States, 2007–2015. NCHS Data Brief, no 264. Hyattsville, MD: National Center for Health Statistics. 2016.
- Martin JA, Hamilton BE, Osterman MJK, Driscoll AK, Drake P. Births: Final data for 2016pdf icon. National Vital Statistics Reports; vol 67 no 1. Hyattsville, MD: National Center for Health Statistics. 2018.
- Martin JA, Hamilton BE, Osterman MJK, Driscoll AK, Mathews TJ. Births: Final data for 2015pdf icon. National Vital Statistics Reports; vol 66 no 1. Hyattsville, MD: National Center for Health Statistics. 2017.
- Whelpton PK, Campbell AA, Patterson JE. Fertility and family planning in the United States. Princeton, NJ: Princeton University Press. 1966.
- Stern, D. Race and ethnicity in rural America: Housing assistance councilexternal icon. 2014.
- Daniels K, Martinez GM, Nugent CN. Urban and rural variation in fertility-related behavior among U.S. women, 2011–2015. NCHS Data Brief, no 297. Hyattsville, MD: National Center for Health Statistics. 2018.
- Ingram DD, Franco SJ. NCHS urban–rural classification scheme for countiespdf icon. National Center for Health Statistics. Vital Health Stat 2(154). 2012.
- National Center for Health Statistics. U.S. Census populations with bridged race categories.
- National Cancer Institute. Joinpoint Regression Program (Version 4.4.0.0) [computer software]. 2017.
- Ingram DD, Malec DJ, Makuc DM, Kruszon-Moran D, Gindi RM, Albert M, et al. National Center for Health Statistics Guidelines for Analysis of Trendspdf icon. National Center for Health Statistics. Vital Health Stat 2(179). 2018.
Suggested citation
Ely DM, Hamilton BE. Trends in fertility and mother’s age at first birth among rural and metropolitan counties: United States, 2007–2017. NCHS Data Brief, no 323. Hyattsville, MD: National Center for Health Statistics. 2018.
Copyright information
All material appearing in this report is in the public domain and may be reproduced or copied without permission; citation as to source, however, is appreciated.
National Center for Health Statistics
Charles J. Rothwell, M.S., M.B.A., Director
Jennifer H. Madans, Ph.D., Associate Director for Science
Division of Vital Statistics
Delton Atkinson, M.P.H., M.P.H., P.M.P., Director
Hanyu Ni, Ph.D., M.P.H., Associate Director for Science