Prevalence of Total, Diagnosed, and Undiagnosed Diabetes Among Adults: United States, 2013–2016
- Key findings
- During 2013–2016, the prevalence of total diabetes was higher among men than among women.
- The prevalence of total, diagnosed, and undiagnosed diabetes increased with age.
- The prevalence of total, diagnosed, and undiagnosed diabetes varied by race and Hispanic origin.
- The prevalence of total, diagnosed, and undiagnosed diabetes increased with increasing weight status category.
- Summary
- Definition
- Data source and methods
- About the authors
- References
- Suggested citation
NCHS Data Brief No. 319, September 2018
PDF Versionpdf icon (364 KB)
Nicholas D. Mendola, M.P.H., Te-Ching Chen, Ph.D., Qiuping Gu, M.D., Ph.D., Mark S. Eberhardt, Ph.D., and Sharon Saydah, Ph.D.
Key findings
Data from the National Health and Nutrition Examination Survey
- In 2013–2016, the prevalence of total diabetes was 14.0%; the prevalence of diagnosed diabetes was 9.7%; and the prevalence of undiagnosed diabetes was 4.3% among U.S. adults.
- The prevalence of total diabetes was higher among men (15.9%) than among women (12.2%).
- The prevalence of total, diagnosed, and undiagnosed diabetes increased with age.
- The prevalence of total, diagnosed, and undiagnosed diabetes was higher in Hispanic adults than in non-Hispanic white adults. The prevalence of total and diagnosed diabetes was higher among non-Hispanic black adults compared with non-Hispanic white adults.
- The prevalence of total, diagnosed, and undiagnosed diabetes increased with increasing weight status category.
Diabetes is a major cause of morbidity and mortality in the United States(1–3). Diabetes can be present but undiagnosed, meaning that a person can have diabetes but not report having ever been told by a doctor or health professional that they have the condition. Type 2 diabetes can progress over an extended time period with gradual, often unnoticed, changes occurring before diagnosis. If left unmanaged, diabetes may contribute to serious health outcomes including neuropathy, nephropathy, retinopathy, coronary artery disease, stroke, and peripheral vascular disease (4). This report presents the prevalence of total, diagnosed, and undiagnosed diabetes in U.S. adults in 2013–2016.
Keywords: fasting plasma glucose, hemoglobin A1c, NHANES
During 2013–2016, the prevalence of total diabetes was higher among men than among women.
- The prevalence of total diabetes was 14.0% among adults. The prevalence of diagnosed and undiagnosed diabetes was 9.7% and 4.3%, respectively (Figure 1).
- Men had a higher prevalence of total diabetes (15.9%) compared with women (12.2%), but differences in diagnosed and undiagnosed diabetes by sex were not significant.
Figure 1. Age-adjusted prevalence of total, diagnosed, and undiagnosed diabetes among adults aged 20 and over, by sex: United States, 2013–2016
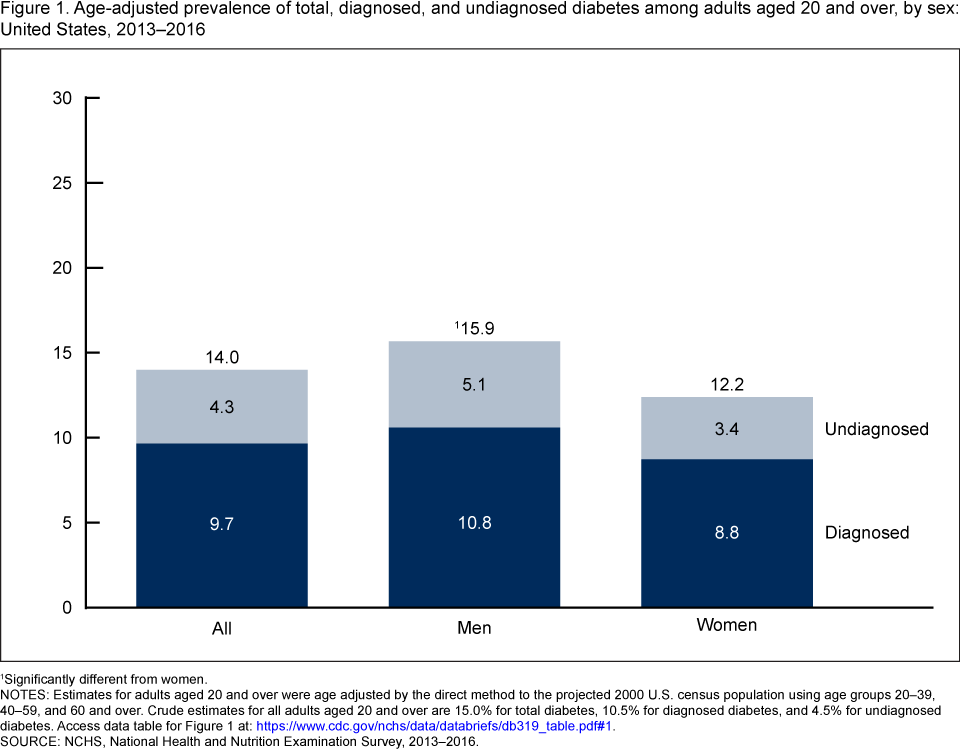
1Significantly different from women.
NOTES: Estimates for adults aged 20 and over were age adjusted by the direct method to the projected 2000 U.S. census population using age groups 20–39, 40–59, and 60 and over. Crude estimates for all adults aged 20 and over are 15.0% for total diabetes, 10.5% for diagnosed diabetes, and 4.5% for undiagnosed diabetes. Access data table for Figure 1pdf icon.
SOURCE: NCHS, National Health and Nutrition Examination Survey, 2013–2016.
The prevalence of total, diagnosed, and undiagnosed diabetes increased with age.
- The prevalence of total diabetes was 3.5% among adults aged 20–39, 16.3% among adults aged 40–59, and 28.2% among adults aged 60 and over (Figure 2).
- The prevalence of diagnosed diabetes was 1.8% among adults aged 20–39, 11.1% among adults aged 40–59, and 21.0% among adults aged 60 and over.
- The prevalence of undiagnosed diabetes was 1.7% among adults aged 20–39, 5.2% among adults aged 40–59, and 7.2% among adults aged 60 and over.
Figure 2. Prevalence of total, diagnosed, and undiagnosed diabetes among adults aged 20 and over, by age group: United States, 2013–2016
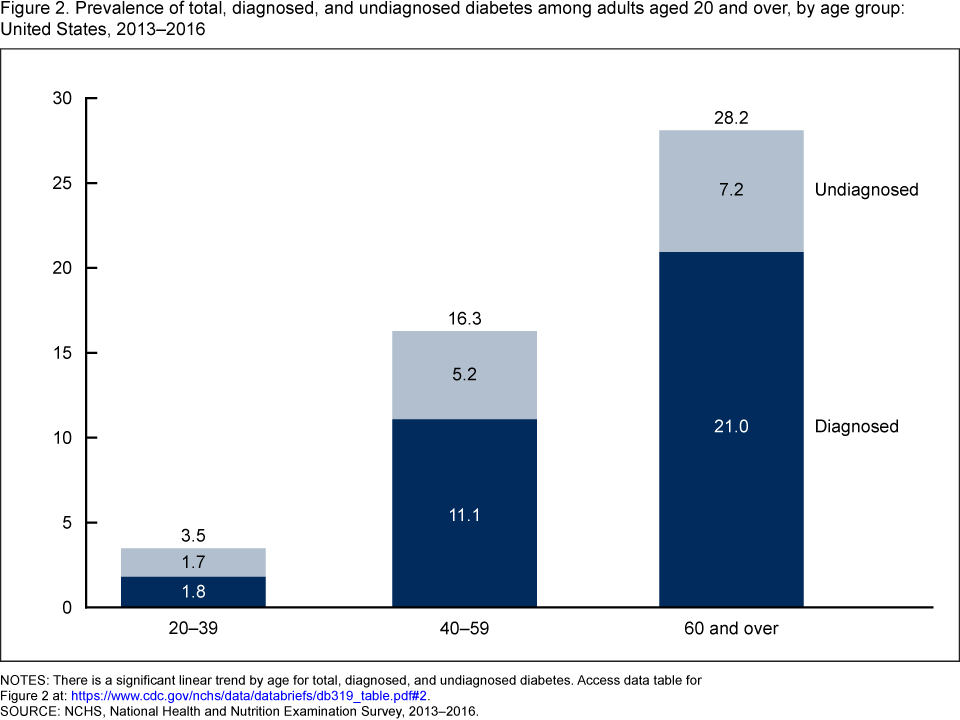
NOTES: There is a significant linear trend by age for total, diagnosed, and undiagnosed diabetes. Access data table for Figure 2pdf icon
SOURCE: NCHS, National Health and Nutrition Examination Survey, 2013–2016.
The prevalence of total, diagnosed, and undiagnosed diabetes varied by race and Hispanic origin.
- Total diabetes was higher among non-Hispanic black (17.9%) and Hispanic (19.8%) adults compared with non-Hispanic white (12.4%) adults; total diabetes was also higher for Hispanic compared with non-Hispanic Asian (15.3%) adults (Figure 3).
- The prevalence of diagnosed diabetes was higher in Hispanic (13.6%) and non-Hispanic black (13.9%) adults compared with non-Hispanic Asian (10.2%) and non-Hispanic white (8.5%) adults.
- The prevalence of undiagnosed diabetes was higher in Hispanic (6.2%) adults compared with non-Hispanic white (3.9%) and non-Hispanic black (4.0%) adults.
Figure 3. Age-adjusted prevalence of total, diagnosed, and undiagnosed diabetes among adults aged 20 and over, by race and Hispanic origin: United States, 2013–2016
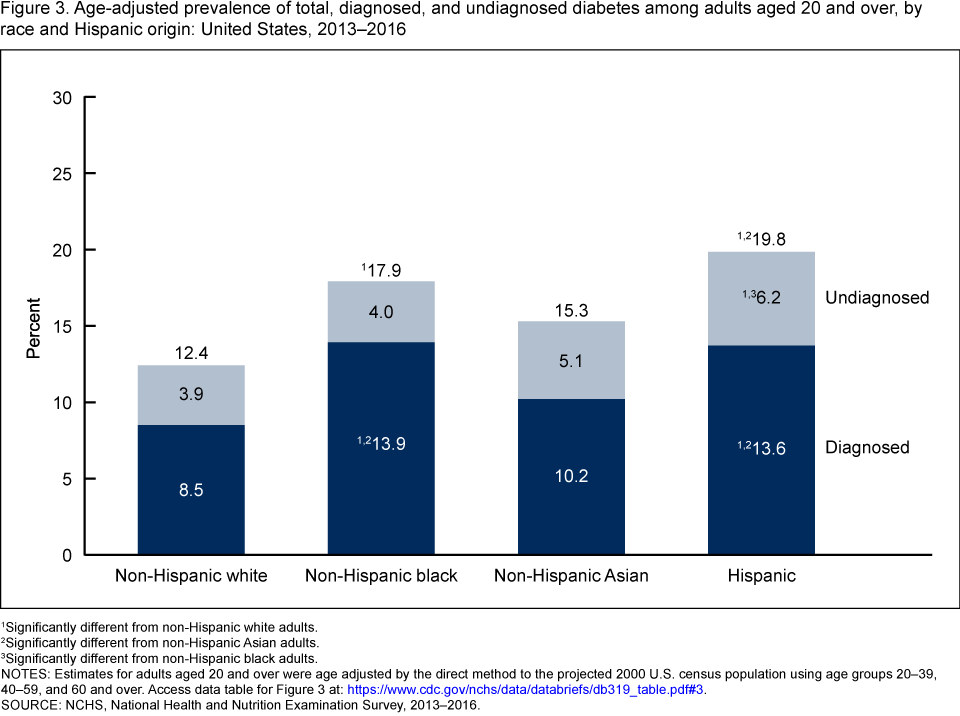
1Significantly different from non-Hispanic white adults.
2Significantly different from non-Hispanic Asian adults.
3Significantly different from non-Hispanic black adults.
NOTES: Estimates for adults aged 20 and over were age adjusted by the direct method to the projected 2000 U.S. census population using age groups 20–39, 40–59, and 60 and over. Access data table for Figure 3pdf icon.
SOURCE: NCHS, National Health and Nutrition Examination Survey, 2013–2016.
The prevalence of total, diagnosed, and undiagnosed diabetes increased with increasing weight status category.
- The prevalence of total diabetes increased with increasing weight status category, from 6.2% among underweight or normal weight adults to 11.8% among overweight adults to 20.7% among adults with obesity (Figure 4).
- The prevalence of diagnosed diabetes increased with increasing weight status category, from 4.3% among underweight or normal weight adults to 8.6% among overweight adults to 14.0% among adults with obesity.
- The prevalence of undiagnosed diabetes increased with increasing weight status category, from 1.9% among underweight or normal weight adults to 3.2% among overweight adults to 6.8% among adults with obesity.
Figure 4. Age-adjusted prevalence of total, diagnosed, and undiagnosed diabetes among adults aged 20 and over, by weight status category: United States, 2013–2016
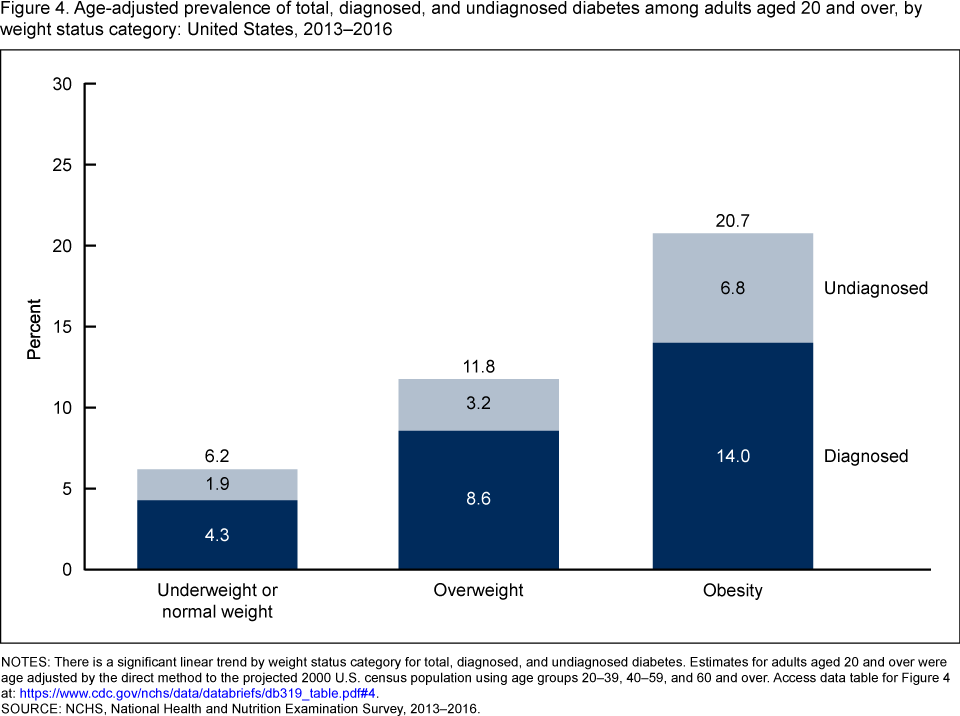
NOTES: There is a significant linear trend by weight status category for total, diagnosed, and undiagnosed diabetes. Estimates for adults aged 20 and over were age adjusted by the direct method to the projected 2000 U.S. census population using age groups 20–39, 40–59, and 60 and over. Access data table for Figure 4pdf icon.
SOURCE: NCHS, National Health and Nutrition Examination Survey, 2013–2016.
Summary
In 2013–2016, the prevalence of total diabetes was 14.0% among U.S. adults. The prevalence of diagnosed diabetes was 9.7%, and the prevalence of undiagnosed diabetes was 4.3%. These results show that among all adults with diabetes, 30.7% had undiagnosed diabetes.
Men had a higher prevalence of total diabetes than women. The prevalence of total, diagnosed, and undiagnosed diabetes increased with age and weight status. Differences were seen in the prevalence of diagnosed, undiagnosed, and total diabetes among the race and Hispanic-origin groups. The prevalence of total, diagnosed, and undiagnosed diabetes was higher among Hispanic adults than among non-Hispanic white adults, and the prevalence of total and diagnosed diabetes was higher among non-Hispanic black adults than among non-Hispanic white adults. No significant differences were seen in the prevalence of total, diagnosed, or undiagnosed diabetes between non-Hispanic Asian and non-Hispanic white adults.
Continued monitoring of total, diagnosed, and undiagnosed diabetes will provide information about the burden of diabetes among adults in the United States.
Definitions
Diagnosed diabetes: Participants were classified as having diagnosed diabetes if they answered “yes” to the question: “Other than during pregnancy, have you ever been told by a doctor or health professional that you have diabetes or sugar diabetes?”
Undiagnosed diabetes: Participants were classified as having undiagnosed diabetes if they did not report a diagnosis of diabetes by a health care provider, and their fasting (8–24 hours) plasma glucose was greater than or equal to 126 mg/dL or their hemoglobin A1c was greater than or equal to 6.5%.
Total diabetes: Combined overall prevalence of diagnosed and undiagnosed diabetes.
Weight status: Body mass index (BMI) was calculated as measured weight in kilograms divided by measured height in meters squared and rounded to one decimal place. Overweight was defined as a BMI greater than or equal to 25 and less than 30. Obesity was defined as a BMI greater than or equal to 30. Normal or underweight was defined as a BMI less than 25.
Data source and methods
NHANES is a cross-sectional, complex, multistage probability sample of the U.S. noninstitutionalized population. The survey consists of interviews conducted in participants’ homes, standardized physical examinations in mobile examination centers, and laboratory tests on blood and other specimens. During 2013–2016, Hispanic, non-Hispanic black, and non-Hispanic Asian persons, among other groups, were oversampled to obtain reliable estimates on these subgroups. Race- and Hispanic-origin-specific estimates reflect individuals reporting only one race; those reporting more than one race are included in the total but are not reported separately.
Criteria from the American Diabetes Association were used to define diabetes (5). Participants were randomly assigned to a morning, afternoon, or evening exam. Fasting plasma glucose data from the morning exam (after an 8- to 24-hour fast) were used to define total and undiagnosed diabetes. BMI was calculated as weight in kilograms divided by height in meters squared and rounded to one decimal place. Pregnant women were excluded. Fasting sample weights were used to account for differential probabilities of selection, nonresponse, and noncoverage.
The standard errors of percentages were estimated using Taylor series linearization. Estimates were age adjusted to the projected 2000 U.S. census population using age groups 20–39, 40–59, and 60 and over (6). Pairwise differences between groups were evaluated using t statistics. Stated differences were statistically significant at p less than 0.05. Orthogonal contrasts were used to test for linear trends across categories of age and weight status. Statistical analyses were conducted using SAS release 9.4 (SAS Institute Inc., Cary, N.C.) and SAS-callable SUDAAN release 11.0 (RTI International, Research Triangle Park, N.C.).
About the authors
Nicholas D. Mendola was a student volunteer with the National Center for Health Statistics (NCHS), Division of Health and Nutrition Examination Surveys, and a graduate student at the George Washington University Milken Institute School of Public Health during the analysis and writing of this report. Te-Ching Chen, Qiuping Gu, and Mark S. Eberhardt are with NCHS’ Division of Health and Nutrition Examination Surveys. Sharon Saydah is with the National Center for Chronic Disease Prevention and Health Promotion, Division of Diabetes Translation.
References
- Centers for Disease Control and Prevention. National diabetes statistics report, 2017: Estimates of diabetes and its burden in the United Statespdf icon. Atlanta, GA: U.S. Department of Health and Human Services. 2017.
- Menke A, Casagrande S, Geiss L, Cowie CC. Prevalence of and trends in diabetes among adults in the United States, 1988–2012. JAMA 314(10):1021–9. 2015.
- Heron M. Deaths: Leading causes for 2016. National Vital Statistics Reports; vol 67 no 6. Hyattsville, MD: National Center for Health Statistics. 2018.
- Beagley J, Guariguata L, Weil C, Motala AA. Global estimates of undiagnosed diabetes in adults. Diabetes Res Clin Pract 103(2):150–60. 2014.
- American Diabetes Association. Classification and diagnosis of diabetes: Standards of medical care in diabetes—2018. Diabetes Care 41(Suppl 1):S13–S27. 2018.
- Klein RJ, Schoenborn CA. Age adjustment using the 2000 projected U.S. population. Healthy People Statistical Notes, no 20. Hyattsville, MD: National Center for Health Statistics. 2001.
Suggested citation
Mendola ND, Chen T-C, Gu Q, Eberhardt MS, Saydah S. Prevalence of total, diagnosed, and undiagnosed diabetes among adults: United States, 2013–2016. NCHS Data Brief, no 319. Hyattsville, MD: National Center for Health Statistics. 2018.
Copyright information
All material appearing in this report is in the public domain and may be reproduced or copied without permission; citation as to source, however, is appreciated.
National Center for Health Statistics
Charles J. Rothwell, M.S., M.B.A., Director
Jennifer H. Madans, Ph.D., Associate Director for Science
Division of Health and Nutrition Examination Surveys
Kathryn S. Porter, M.D., M.S., Director
Ryne Paulose-Ram, M.A., Ph.D., Associate Director for Science