Trends in Liver Cancer Mortality Among Adults Aged 25 and Over in the United States, 2000–2016
- Key findings
- Age-adjusted liver cancer death rates increased steadily from 2000 through 2016 for both men and women aged 25 and over.
- Age-adjusted death rates for liver cancer increased during 2000–2016 for non-Hispanic white, non-Hispanic black, and Hispanic adults but decreased for non-Hispanic Asian or Pacific Islander adults.
- Death rates for liver cancer increased from 2000 through 2016 for age groups 65–74 and 75 and over.
- In 2016, the District of Columbia had the highest age-adjusted liver cancer death rate and Vermont had the lowest rate.
- Summary
- Definitions
- Data source and methods
- About the authors
- References
- Suggested citation
NCHS Data Brief No. 314, July 2018
PDF Versionpdf icon (661 KB)
Jiaquan Xu, M.D.
Key findings
Data from the National Vital Statistics System, Mortality
- Age-adjusted death rates for liver cancer increased 43%, from 10.5 per 100,000 U.S. standard population to 15.0 for men and 40%, from 4.5 to 6.3 for women, between 2000 and 2016.
- During 2000–2016, liver cancer death rates decreased 22% for non-Hispanic Asian or Pacific Islander (API) adults, but increased 48% for non-Hispanic white, 43% for non-Hispanic black, and 27% for Hispanic adults.
- Trends in liver cancer death rates varied by age group, but increasing trends from 2000 through 2016 were observed for adults aged 65–74 and 75 and over.
- In 2016, among the 50 states and the District of Columbia (D.C.), D.C. had the highest death rate while Vermont had the lowest.
Liver cancer (including intrahepatic bile duct cancer) was the ninth leading cause of cancer death in 2000 and rose to sixth in 2016 (1). Although death rates for all cancer combined have declined since 1990, a recent report documented an increasing trend in liver cancer death rates during 1990–2014 (2,3). In this report, trends in liver cancer death rates are examined by sex, race and Hispanic origin, and age group from 2000 through 2016 for adults aged 25 and over. Death rates in 2016 by state and the District of Columbia (D.C.) are also presented.
Keywords: sex, intrahepatic bile duct, race and ethnicity, National Vital Statistics System
Age-adjusted liver cancer death rates increased steadily from 2000 through 2016 for both men and women aged 25 and over.
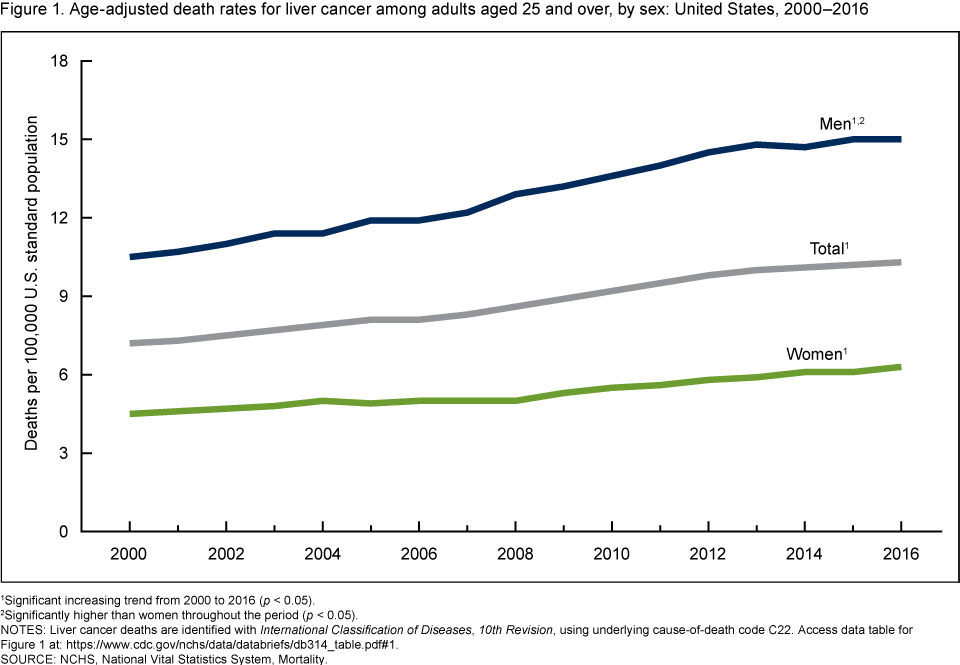
- Liver cancer death rates for adults aged 25 and over increased 43% from 7.2 per 100,000 U.S. standard population in 2000 to 10.3 in 2016 (Figure 1).
- Liver cancer death rates increased 43% from 10.5 in 2000 to 15.0 in 2016 for men and 40% from 4.5 to 6.3 for women.
- The death rate for men was between 2.0–2.5 times the rate for women throughout the period.
Figure 1. Age-adjusted death rates for liver cancer among adults aged 25 and over, by sex: United States, 2000–2016
1Significant increasing trend from 2000 to 2016 (p < 0.05).
2Significantly higher than women throughout the period (p < 0.05).
NOTES: Liver cancer deaths are identified with International Classification of Diseases, 10th Revision, using underlying cause-of-death code C22. Access data table for Figure 1pdf icon.
SOURCE: NCHS, National Vital Statistics System, Mortality.
Age-adjusted death rates for liver cancer increased during 2000–2016 for non-Hispanic white, non-Hispanic black, and Hispanic adults but decreased for non-Hispanic Asian or Pacific Islander adults.
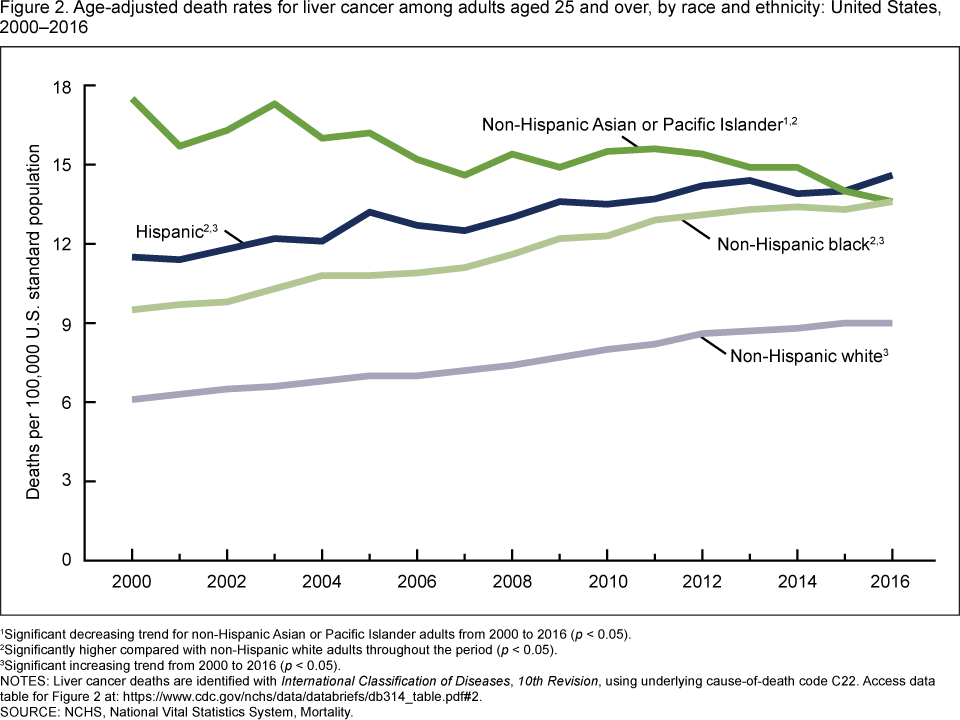
- During 2000–2016, the age-adjusted death rate for liver cancer increased 48% (6.1 per 100,000 U.S. standard population to 9.0) for non-Hispanic white adults and 43% (9.5 to 13.6) for non-Hispanic black adults (Figure 2).
- While non-Hispanic Asian or Pacific Islander (API) adults had the highest liver cancer death rates during 2000–2014 among the four race and Hispanic-origin groups, this group experienced the only decrease (22%), from 17.5 in 2000 to 13.6 in 2016.
- The liver cancer death rate increased 27% from 11.5 in 2000 to 14.6 in 2016 for Hispanic adults, surpassing the rate for non-Hispanic API adults in 2016.
- Non-Hispanic white adults had the lowest death rate among the four racial and ethnic groups throughout the period.
Figure 2. Age-adjusted death rates for liver cancer among adults aged 25 and over, by race and ethnicity: United States, 2000–2016
1Significant decreasing trend for non-Hispanic Asian or Pacific Islander adults from 2000 to 2016 (p < 0.05).
2Significantly higher compared with non-Hispanic white adults throughout the period (p < 0.05).
3Significant increasing trend from 2000 to 2016 (p < 0.05).
NOTES: Liver cancer deaths are identified with International Classification of Diseases, 10th Revision, using underlying cause-of-death code C22. Access data table for Figure 2pdf icon.
SOURCE: NCHS, National Vital Statistics System, Mortality.
Death rates for liver cancer increased from 2000 through 2016 for age groups 65–74 and 75 and over.
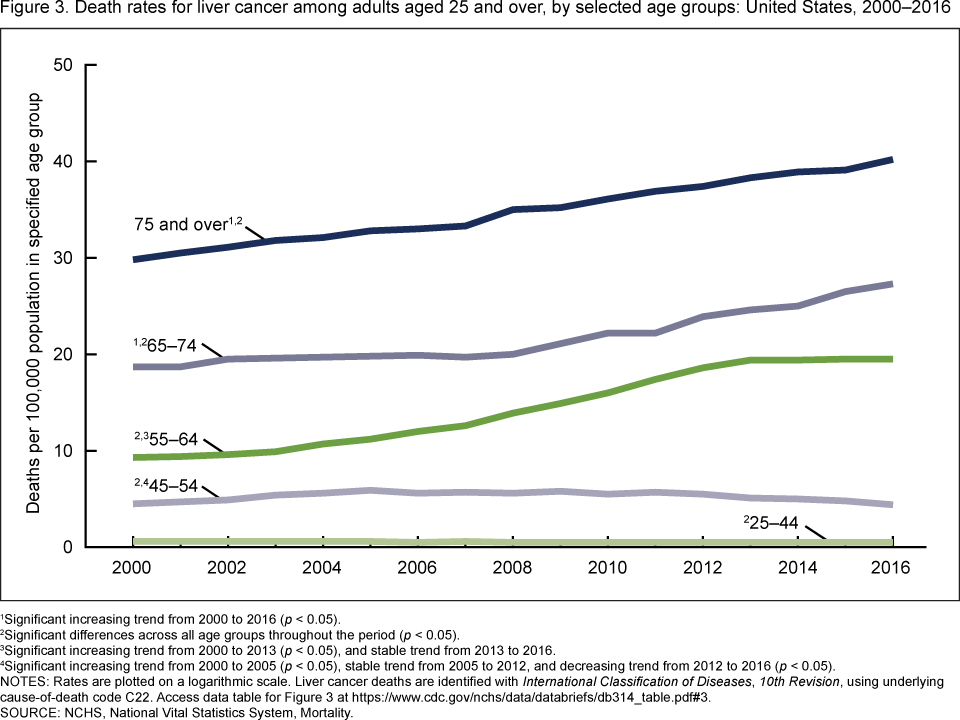
- For adults aged 25–44, the rate remained essentially unchanged during 2000–2016 (Figure 3).
- For adults aged 45–54, the rate increased 31% from 2000 to 2005, remained stable from 2005 to 2012, and then decreased 20%, from 5.5 per 100,000 population in 2012 to 4.4 in 2016.
- For adults aged 55–64, the rate increased 109% from 9.3 in 2000 to 19.4 in 2013, but remained stable through 2016.
- For adults aged 65–74, the rate increased 7%, from 18.7 in 2000 to 20.0 in 2008, and 37% from 20.0 in 2008 to 27.3 in 2016. The rate increased 35% (29.8 in 2000 to 40.2 in 2016) for adults aged 75 and over.
- The liver cancer death rate was the highest for adults aged 75 and over, followed by age groups 65–74, 55–64, 45–54, and 25–44.
Figure 3. Death rates for liver cancer among adults aged 25 and over, by selected age groups: United States, 2000–2016
1Significant increasing trend from 2000 to 2016 (p < 0.05).
2Significant differences across all age groups throughout the period (p < 0.05).
3Significant increasing trend from 2000 to 2013 (p < 0.05), and stable trend from 2013 to 2016.
4Significant increasing trend from 2000 to 2005 (p < 0.05), stable trend from 2005 to 2012, and decreasing trend from 2012 to 2016 (p < 0.05).
NOTES: Rates are plotted on a logarithmic scale. Liver cancer deaths are identified with International Classification of Diseases, 10th Revision, using underlying cause-of-death code C22. Access data table for Figure 3pdf icon.
SOURCE: NCHS, National Vital Statistics System, Mortality.
In 2016, the District of Columbia had the highest age-adjusted liver cancer death rate and Vermont had the lowest rate.
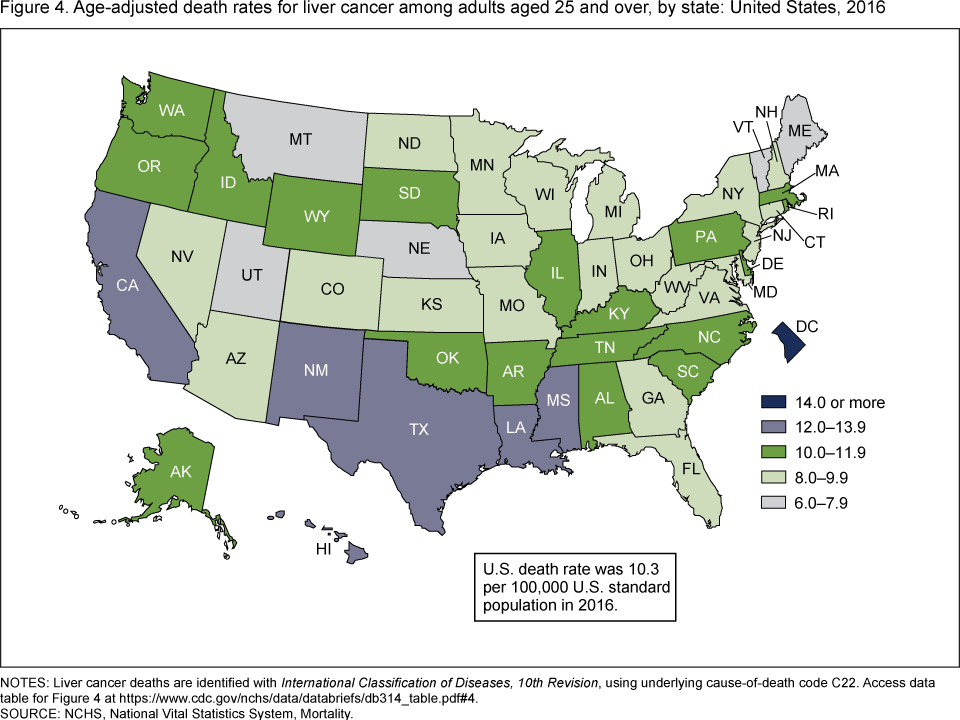
- In 2016, age-adjusted death rates for liver cancer among adults were highest in D.C. (16.8 per 100,000 U.S. standard population), Louisiana (13.8), Hawaii (12.7), and Mississippi and New Mexico (12.4 each) (Figure 4).
- The five states with the lowest age-adjusted liver cancer death rates were Vermont (6.0), Maine (7.4), Montana (7.7), and Utah and Nebraska (7.8 each).
Figure 4. Age-adjusted death rates for liver cancer among adults aged 25 and over, by state: United States, 2016
NOTES: Liver cancer deaths are identified with International Classification of Diseases, 10th Revision, using underlying cause-of-death code C22. Access data table for Figure 4pdf icon.
SOURCE: NCHS, National Vital Statistics System, Mortality.
Summary
This report provides the most recent trends in liver cancer mortality by sex, race and Hispanic origin, and age group for adults aged 25 and over. From 2000 through 2016, death rates increased significantly for both men and women, with the death rate for men between two and two and a half times the rate for women. Liver cancer death rates increased for non-Hispanic white, non-Hispanic black, and Hispanic adults, but declined for non-Hispanic API adults. The rate for non-Hispanic white adults aged 25 and over was the lowest of the four race and Hispanic-origin groups from 2000 through 2016, while the rate for non-Hispanic API adults was the highest from 2000 through 2014. The death rate for Hispanic adults surpassed the rate for non-Hispanic API adults in 2016, thus becoming the highest among the four race and ethnicity groups. From 2000 to 2016, death rates for liver cancer increased significantly for age groups 65–74 and 75 and over. The rate for adults aged 45–54 initially increased, but then decreased significantly since 2012. Liver cancer death rates in 2016 varied by jurisdiction, with the lowest death rate in Vermont and the highest in D.C.
Definitions
Cause-of-death classification: Cause of death is determined based on medical information entered on death certificates filed in the United States. This information is classified and coded in accordance with the International Statistical Classification of Diseases and Related Health Problems, 10th Revision (ICD–10) (4).
Underlying causes of death: Defined by the World Health Organization as “the disease or injury which initiate the train of events leading directly to death, or the circumstances of the accident or violence which produce the fatal injury” (4). In the case of liver cancer deaths, the underlying cause of death is coded to C22 according to ICD–10.
Data source and methods
All data in the report are from the 2000 to 2016 mortality files from the National Vital Statistics System. The direct standardization method was used to calculate age-adjusted death rates, using the 2000 U.S. standard population aged 25 and over and age groups with 10-year intervals (5).
More than 99% of all deaths with liver cancer reported on the death certificate were to adults 25 years of age and over and, therefore, only decedents aged 25 and over were included in this analysis. Race and Hispanic origin are reported separately on the death certificate. Persons of Hispanic origin may be of any race. A recent report has shown that, in the 1999–2011 period, deaths for the non-Hispanic API and Hispanic populations were underreported by 3% for all ages in each group (6). It was presumed that the degree of underreporting of deaths observed for the non-Hispanic API and Hispanic populations in 1999–2011 data also applied to the data for years 2012–2016. Trends in death rates were evaluated using Joinpoint Regression Program (7). A maximum of three joinpoints were allowed during the 2000–2016 period, which is the default setting. The differences between death rates were evaluated using a two-tailed z test at the 0.05 level.
About the author
Jiaquan Xu is with the National Center for Health Statistics, Division of Vital Statistics, Mortality Statistics Branch. The author gratefully acknowledges the assistance of Sally C. Curtin, who provided the content review.
References
- Centers for Disease Control and Prevention. Wide-ranging online data for epidemiologic research (WONDER). Underlying cause of death output based on the Detailed Mortality File.
- Xu JQ, Murphy SL, Kochanek KD, Bastian BA, Arias E. Deaths: Final data for 2016. National Vital Statistics Reports; vol 67 no 5. Hyattsville, MD: National Center for Health Statistics. 2018.
- Islami F, Miller KD, Siegel RL, Fedewa SA, Ward EM, Jemal A. Disparities in liver cancer occurrence in the United States by race/ethnicity and stateexternal icon. CA Cancer J Clin 67(4). 2017.
- World Health Organization. International statistical classification of diseases and related health problems, 10th revision (ICD–10). 2008 ed. Geneva, Switzerland. 2009.
- National Center for Health Statistics. National Vital Statistics System. U.S. census populations with bridged race categories.
- Arias E, Heron M, Hakes JK. The validity of race and Hispanic-origin reporting on death certificates in the United States: An updatepdf icon. Vital Health Stat 2(172). Hyattsville, MD: National Center for Health Statistics. 2016.
- National Cancer Institute. Joinpoint Regression Program (Version 4.4.0.0) [computer software]. 2017.
Suggested citation
Xu JQ. Trends in liver cancer mortality among adults aged 25 and over in the United States, 2000–2016. NCHS Data Brief, no 314. Hyattsville, MD: National Center for Health Statistics. 2018.
Copyright information
All material appearing in this report is in the public domain and may be reproduced or copied without permission; citation as to source, however, is appreciated.
National Center for Health Statistics
Charles J. Rothwell, M.S., M.B.A., Director
Jennifer H. Madans, Ph.D., Associate Director for Science
Division of Vital Statistics
Delton Atkinson, M.P.H., M.P.H., P.M.P., Director
Hanyu Ni, Ph.D., M.P.H., Associate Director for Science