Suicide Rates in the United States Continue to Increase
- Key findings
- From 2000 through 2016, suicide rates increased for both males and females, with greater annual percentage increases occurring after 2006.
- Suicide rates for females aged 10–74 were higher in 2016 than in 2000.
- Suicide rates for males aged 15–74 were higher in 2016 than in 2000.
- In 2016, the means of suicide among females varied by age group.
- In 2016, the means of suicide among males also varied by age group.
- Summary
- Data source and methods
- About the authors
- References
- Suggested citation
NCHS Data Brief No. 309, June 2018
PDF Versionpdf icon (1 MB)
Holly Hedegaard, M.D., Sally C. Curtin, M.A., and Margaret Warner, Ph.D.
Key findings
Data from the National Vital Statistics System, Mortality
- For 2000–2016, the age-adjusted suicide rate increased 30%, from 10.4 to 13.5 per 100,000 population, increasing on average by about 1% per year from 2000 through 2006 and by 2% per year from 2006 through 2016.
- For females aged 10–74, suicide rates in 2016 were higher than in 2000.
- For males aged 15–74, suicide rates in 2016 were higher than in 2000.
- In 2016, for females, suffocation accounted for a higher percentage of suicides among those under age 25, while poisoning accounted for a higher percentage among those aged 45 and over.
- In 2016, firearms were the most common means of suicide among males aged 15 and over.
In 2016, suicide was the 10th leading cause of death in the United States (a href=”#ref1″>1). Although the Healthy People 2020 target is to reduce suicide rates to 10.2 per 100,000 by 2020 (2), suicide rates have steadily increased in recent years (3,4). This Data Brief uses the most recent data from the National Vital Statistics System (NVSS) to update trends in suicide mortality from 2000 through 2016 and to describe differences by sex, age group, and means of suicide (e.g., suffocation, firearms, poisoning).
Keywords: National Vital Statistics System, death certificates, underlying cause of death, intentional self-harm
From 2000 through 2016, suicide rates increased for both males and females, with greater annual percentage increases occurring after 2006.
- From 2000 through 2016, the age-adjusted suicide rate increased 30%, from 10.4 per 100,000 standard population to 13.5. The rate increased on average by about 1% per year from 2000 through 2006 and by 2% per year from 2006 through 2016 (Figure 1).
- For males, the rate increased 21%, from 17.7 in 2000 to 21.4 in 2016. The rate increased on average by about 2% per year from 2000 through 2002, did not statistically change from 2002 through 2006, increased by about 2% per year from 2006 through 2010, and by about 1% per year from 2010 through 2016.
- For females, the rate increased 50%, from 4.0 in 2000 to 6.0 in 2016. The rate increased on average by about 2% per year from 2000 through 2007 and by about 3% per year from 2007 through 2016.
- The ratio of male-to-female suicide rates was 4.4 in 2000 and 3.6 in 2016. The narrowing in the ratio of male-to-female suicide rates reflects the accelerated increase in female suicide rates compared with male suicide rates beginning in 2007.
Figure 1. Age-adjusted suicide rates, by sex: United States, 2000–2016
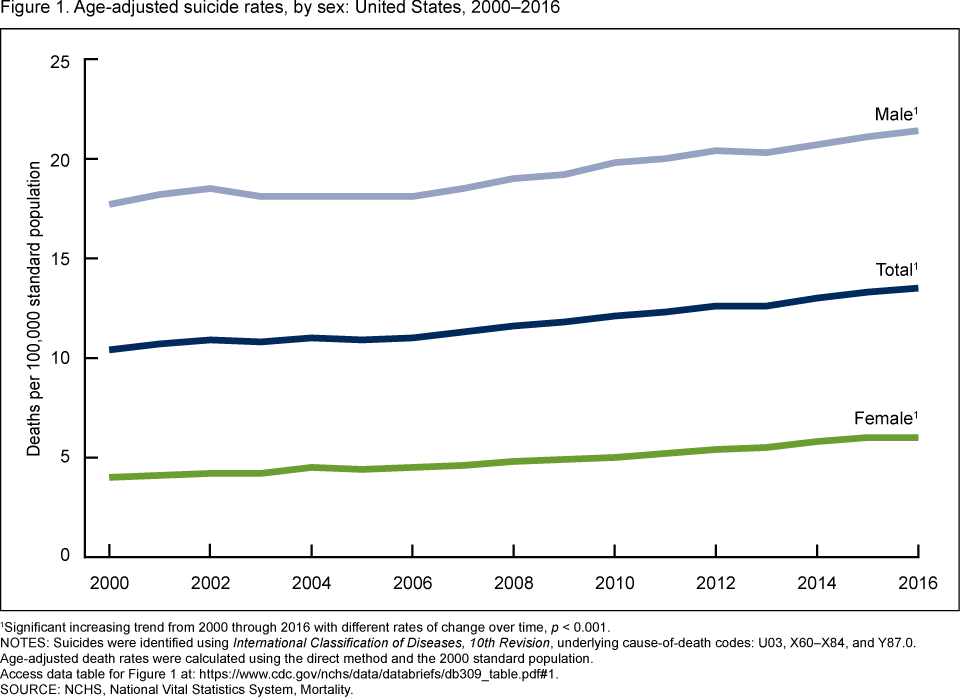
1Significant increasing trend from 2000 through 2016 with different rates of change over time, p < 0.001.
NOTES: Suicides were identified using International Classification of Diseases, 10th Revision, underlying cause-of-death codes: U03, X60–X84, and Y87.0. Age-adjusted death rates were calculated using the direct method and the 2000 standard population. Access data table for Figure 1pdf icon.
SOURCE: NCHS, National Vital Statistics System, Mortality.
Suicide rates for females aged 10–74 were higher in 2016 than in 2000.
- Suicide rates for females were highest among those aged 45–64 in both 2000 (6.2 per 100,000 females) and 2016 (9.9) (Figure 2).
- Although based on a small number of deaths, the suicide rate for females aged 10–14 increased significantly, from 0.6 per 100,000 in 2000 to 1.7 in 2016.
- Suicide rates were significantly higher in 2016 compared with 2000 among females aged 15–24 (5.4 and 3.0, respectively), 25–44 (7.6 and 5.4), 45–64 (9.9 and 6.2), and 65–74 (6.2 and 4.0).
Figure 2. Suicide rates for females, by age group: United States, 2000 and 2016
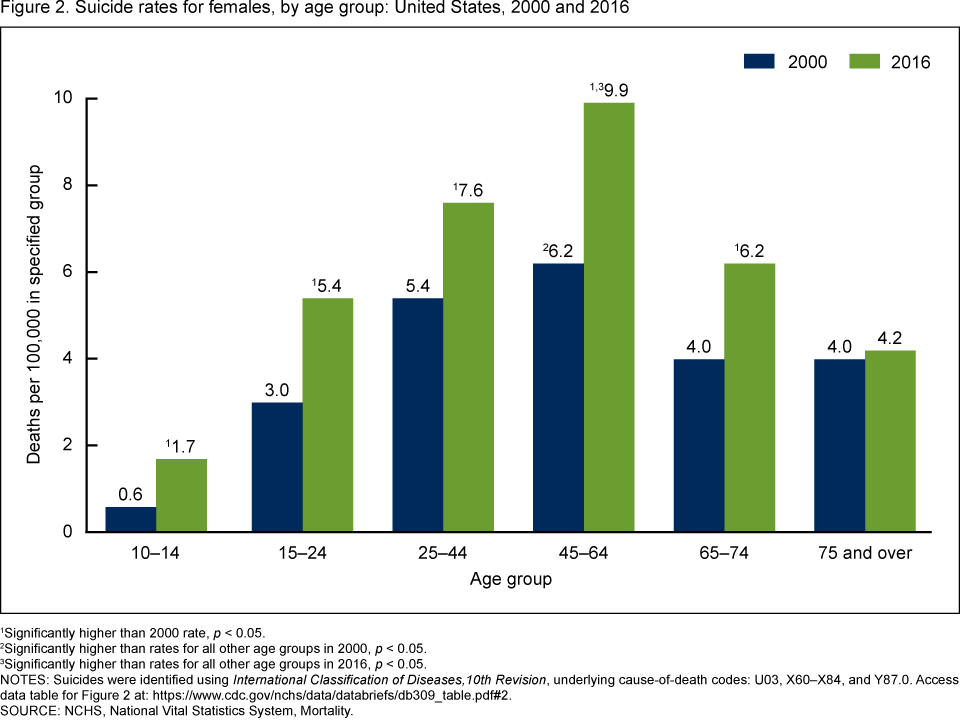
1Significantly higher than 2000 rate, p < 0.05.
2Significantly higher than rates for all other age groups in 2000, p < 0.05.
3Significantly higher than rates for all other age groups in 2016, p < 0.05.
NOTES: Suicides were identified using International Classification of Diseases, 10th Revision, underlying cause-of-death codes: U03, X60–X84, and Y87.0. Access data table for Figure 2pdf icon.
SOURCE: NCHS, National Vital Statistics System, Mortality.
Suicide rates for males aged 15–74 were higher in 2016 than in 2000.
- Suicide rates for males were highest among those aged 75 and over in both 2000 (42.4 per 100,000 males) and 2016 (39.2) (Figure 3).
- Suicide rates were significantly higher in 2016 compared with 2000 among males aged 15–24 (20.5 and 17.1, respectively), 25–44 (26.2 and 21.3), 45–64 (29.1 and 21.3), and 65–74 (25.9 and 22.7).
- The suicide rate in 2016 for males aged 75 and over (39.2) was significantly lower than the rate in 2000 (42.4).
Figure 3. Suicide rates for males, by age group: United States, 2000 and 2016
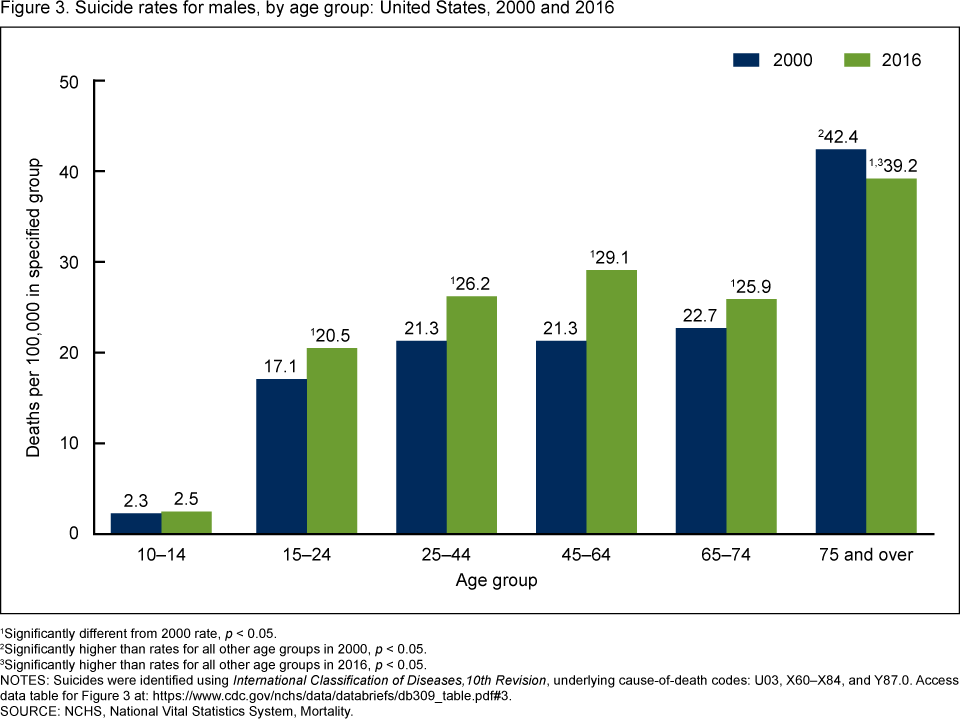
1Significantly different from 2000 rate, p < 0.05.
2Significantly higher than rates for all other age groups in 2000, p < 0.05.
3Significantly higher than rates for all other age groups in 2016, p < 0.05.
NOTES: Suicides were identified using International Classification of Diseases, 10th Revision, underlying cause-of-death codes: U03, X60–X84, and Y87.0. Access data table for Figure 3pdf icon.
SOURCE: NCHS, National Vital Statistics System, Mortality.
In 2016, the means of suicide among females varied by age group.
- Among females aged 10–14, the most frequent means of suicide in 2016 was suffocation (119 of 171 deaths or 70%) (Figure 4).
- Nearly three-quarters of all suicides among females aged 15–24 involved either suffocation (509 of 1,148 deaths or 44%) or firearms (335 deaths or 29%).
- Among females aged 25–44, 32% (1,035 of 3,215 deaths) of suicides involved firearms, 31% involved suffocation (1,004 deaths), and 28% involved poisoning (887 deaths).
- Poisoning was the most frequent means of suicide among females aged 45 and over, accounting for 40% of suicides among those aged 45–64 (1,720 of 4,253 deaths), 41% among those aged 65–74 (381 of 940 deaths), and 37% among those aged 75 and over (188 of 510 deaths).
- Firearms were the second most frequent means of suicide among females aged 45 and over, accounting for 32% of suicides among those aged 45–64 (1,361 of 4,253 deaths), 38% among those aged 65–74 (358 of 940 deaths), and 33% among those aged 75 and over (168 of 510 deaths).
Figure 4. Number of suicides for females, by age group and means of suicide: United States, 2016
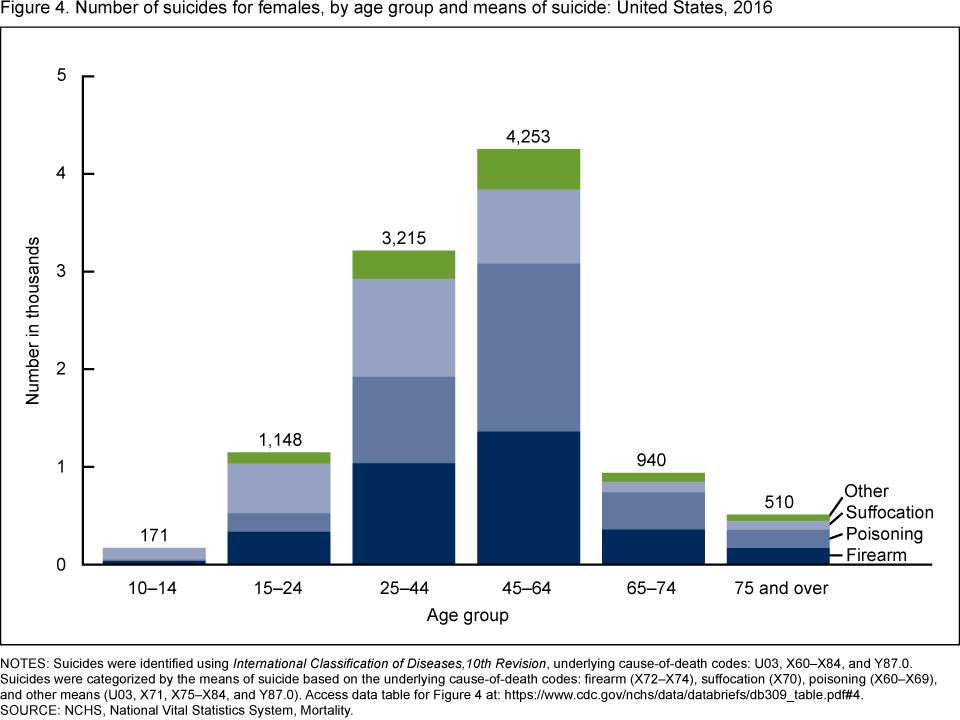
NOTES: Suicides were identified using International Classification of Diseases, 10th Revision, underlying cause-of-death codes: U03, X60–X84, and Y87.0. Suicides were categorized by the means of suicide involved based on the underlying cause-of-death codes: firearm (X72–X74), suffocation (X70), poisoning (X60–X69), and other means (U03, X71, X75–X84, and Y87.0). Access data table for Figure 4pdf icon.
SOURCE: NCHS, National Vital Statistics System, Mortality.
In 2016, the means of suicide among males also varied by age group.
- In 2016, suffocation and firearms each accounted for about one-half (48%) of suicides among males aged 10–14 (128 and 126 of 265 deaths, respectively) (Figure 5).
- For males aged 15–24, about one-half of all suicides (2,348 of 4,575 deaths or 51%) involved firearms while another one-third (1,591 deaths or 35%) involved suffocation.
- For males aged 25 and over, the percentage of suicides involving firearms increased with age, from 48% of suicides among those aged 25–44 (5,362 of 11,181 deaths), to 55% among those aged 45–64 (6,579 of 11,943 deaths), to 74% among those aged 65–74 (2,574 of 3,463 deaths), and to 81% among those aged 75 and over (2,656 of 3,291 deaths).
Figure 5. Number of suicides for males, by age group and means of suicide: United States, 2016
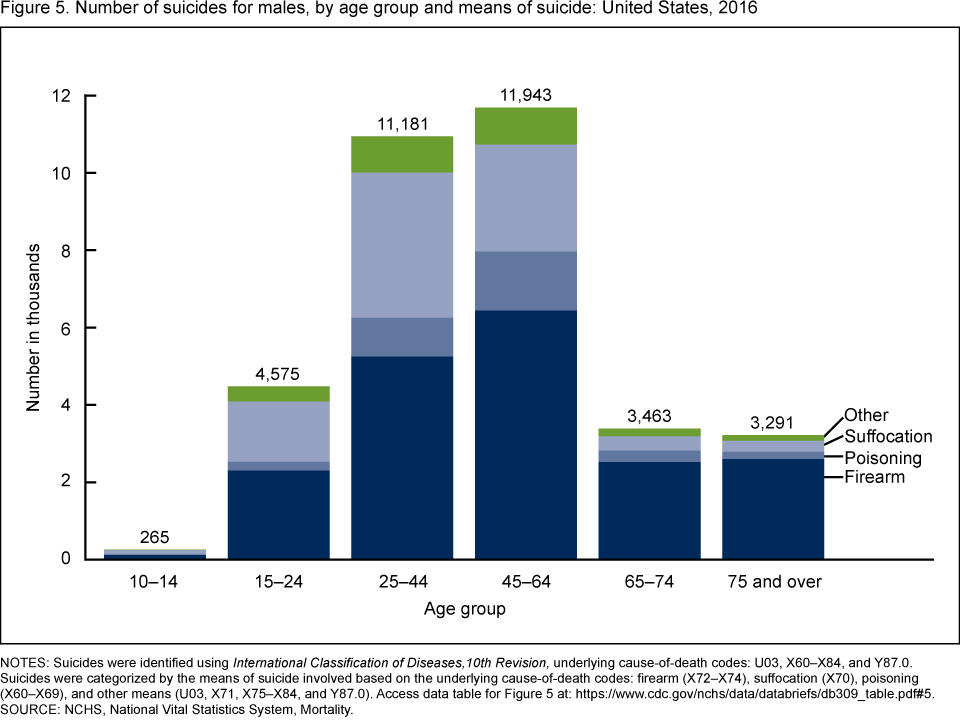
NOTES: Suicides were identified using International Classification of Diseases, 10th Revision, underlying cause of death codes: U03, X60–X84, and Y87.0. Suicides were categorized by the means of suicide involved based on the underlying cause-of-death codes: firearm (X72–X74), suffocation (X70), poisoning (X60–X69), and other means (U03, X71, X75–X84, and Y87.0). Access data table for Figure 5pdf icon.
SOURCE: NCHS, National Vital Statistics System, Mortality.
Summary
Since 2008, suicide has ranked as the 10th leading cause of death for all ages in the United States (1,5). In 2016, suicide became the second leading cause of death among those aged 10–34 and the fourth leading cause among those aged 35–54 (5).
This report highlights trends in suicide rates from 2000 through 2016. During this period, the average annual percentage increase in rates accelerated from approximately 1% per year from 2000 through 2006 to about 2% per year from 2006 through 2016. The age-adjusted rate of suicide among females increased by 50% from 2000 through 2016, while the rate for males increased by 21%. Compared with rates in 2000, suicide rates in 2016 were higher for females in all age groups for those aged 10–74 and for males aged 15–74. Among the means of suicide (i.e., firearms, poisoning, suffocation, and other means), suffocation accounted for the highest percentage of suicides in 2016 among females under age 25, while poisoning accounted for the highest percentage among females aged 45 and over. Among females aged 25–44, the percentage of deaths from firearms, suffocation, and poisoning were similar (32%, 31%, and 28%, respectively). Suffocation and firearms each accounted for about one-half of all suicides among males aged 10–14, while firearms accounted for the highest percentage of suicides among males aged 15 and over.
Data sources and methods
Data were analyzed using the NVSS multiple cause-of-death mortality files from 2000 through 2016 (6). Suicide deaths were identified using International Classification of Diseases, 10th Revision (ICD–10) underlying cause-of-death codes: U03, X60–84, and Y87.0 (7). Suicide deaths were categorized by means of suicide using ICD–10 underlying cause-of-death codes: firearms (X72–X74), suffocation (X70), poisoning (X60–X69), and other means (U03, X71, X75–X84, and Y87.0). Poisoning includes both drug and nondrug (e.g., toxic substances or gases) intoxications. Suffocation includes hanging, asphyxiation, and other mechanical and nonmechanical threats to oxygenation (e.g., trapped in low oxygen environment). Other means include such mechanisms as cutting and piercing; falls and jumping; burns from fire, hot substances, and hot liquids; and transportation. Age-adjusted death rates were calculated using the direct method and the 2000 U.S. standard population (8). The small number of suicides during 2000–2016 for persons aged 5–9 (88 deaths) were included in the total numbers and age-adjusted rates but not in age-specific numbers or rates. Trends in age-adjusted death rates were evaluated using the Joinpoint Regression Program (9). The default setting of a maximum of three joinpoints was used to assess trends from 2000 through 2016. Male-to-female rate ratios were calculated as the male age-adjusted rate divided by the female age-adjusted rate. Pairwise comparisons of rates in Figures 2 and 3 were conducted using Student’s t test statistic.
About the authors
Holly Hedegaard is with the National Center for Health Statistics (NCHS) Office of Analysis and Epidemiology, and Sally C. Curtin and Margaret Warner are with the NCHS Division of Vital Statistics.
References
- Kochanek KD, Murphy SL, Xu JQ, Arias E. Mortality in the United States, 2016pdf icon. NCHS Data Brief, no 293. Hyattsville, MD: National Center for Health Statistics. 2017.
- U.S. Department of Health and Human Services. Healthy People 2020external icon. Washington, DC. 2010.
- QuickStats: Age-adjusted rate for suicide, by sex—National Vital Statistics System, United States, 1975–2015. MMWR Morb Mortal Wkly Rep 66(10):285. 2017.
- Curtin SC, Warner M, Hedegaard H. Increase in suicide in the United States, 1999–2014pdf icon. NCHS Data Brief, no 241. Hyattsville, MD: National Center for Health Statistics. 2016.
- Centers for Disease Control and Prevention. WISQARS. Ten leading causes of death, United States. Atlanta, GA. 2017.
- National Center for Health Statistics. Public-use data files: Mortality multiple cause files. 2016.
- World Health Organization. International statistical classification of diseases and related health problems, 10th revision (ICD–10). 2008 ed. Geneva, Switzerland. 2009.
- Murphy SL, Xu JQ, Kochanek KD, Curtin SC, Arias E. Deaths: Final data for 2015pdf icon. National Vital Statistics Reports; vol 66 no 6. Hyattsville, MD: National Center for Health Statistics. 2017.
- National Cancer Institute. Joinpoint Regression Program (Version 3.4.3) [computer software]. 2010.
Suggested citation
Hedegaard H, Curtin SC, Warner M. Suicide rates in the United States continue to increase. NCHS Data Brief, no 309. Hyattsville, MD: National Center for Health Statistics. 2018.
Copyright information
All material appearing in this report is in the public domain and may be reproduced or copied without permission; citation as to source, however, is appreciated.
National Center for Health Statistics
Charles J. Rothwell, M.S., M.B.A., Director
Jennifer H. Madans, Ph.D., Associate Director for Science
Office of Analysis and Epidemiology
Irma E. Arispe, Ph.D., Director
Makram Talih, Ph.D., Associate Director for Science
Division of Vital Statistics
Delton Atkinson, M.P.H., M.P.H., P.M.P., Director
Hanyu Ni, Ph.D., M.P.H., Associate Director for Science