Behind International Rankings of Infant Mortality: How the United States Compares with Europe
- Key findings
- In 2005, the United States ranked 30th in infant mortality.
- Differences in the reporting of live births between countries can have an impact on international comparisons of infant mortality.
- The U.S. infant mortality rate was still higher than for most European countries when births at less than 22 weeks of gestation were excluded.
- The United States compares favorably with European countries in infant mortality rates for preterm, but not for term infants.
- The percentage of births that were born preterm was much higher in the United States than in Europe.
- Much of the high infant mortality rate in the United States is due to the high percentage of preterm births.
- Summary
- Definitions
- Data source and methods
- About the authors
- References
- Suggested citation
NCHS Data Brief No. 23, November 2009
PDF Versionpdf icon (979 KB)
by Marian F. MacDorman, Ph.D., and T.J. Mathews, M.S.
Key findings
Data from the United States’ Linked Birth/Infant Death Data Set and the European Perinatal Health Report
- Infant mortality rates for preterm (less than 37 weeks of gestation) infants are lower in the United States than in most European countries; however, infant mortality rates for infants born at 37 weeks of gestation or more are higher in the United States than in most European countries.
- One in 8 births in the United States were born preterm, compared with 1 in 18 births in Ireland and Finland.
- If the United States had Sweden’s distribution of births by gestational age, nearly 8,000 infant deaths would be averted each year and the U.S. infant mortality rate would be one-third lower.
- The main cause of the United States’ high infant mortality rate when compared with Europe is the very high percentage of preterm births in the United States.
Infant mortality is an important indicator of the health of a nation, and the recent stagnation (since 2000) in the U.S. infant mortality rate has generated concern among researchers and policy makers. The percentage of preterm births in the United States has risen 36% since 1984 (1). In this report we compare infant mortality rates between the United States and Europe. We also compare two factors that determine the infant mortality rate—gestational age-specific infant mortality rates and the percentage of preterm births. U.S. data are from the Linked Birth/Infant Death Data Set (2,3), and European data for 2004 are from the recently published European Perinatal Health Report (4). We also examine requirements for reporting a live birth among countries to assess the possible effect of reporting differences on infant mortality data.
Keywords: infant mortality, international comparisons, preterm birth, gestational age-specific infant mortality rates
In 2005, the United States ranked 30th in infant mortality.
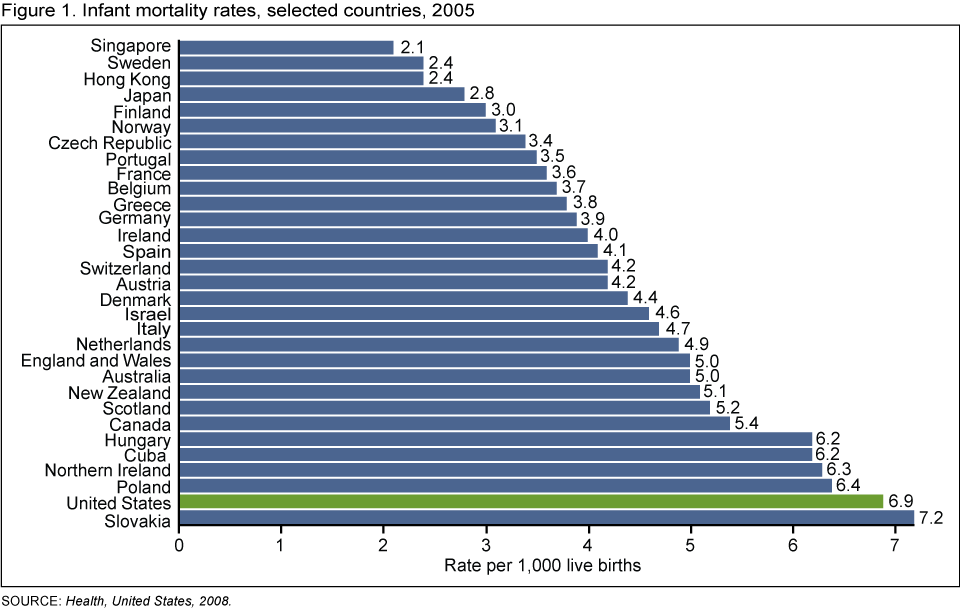 image icon
In 2005, the latest year that the international ranking is available for, the United States ranked 30th in the world in infant mortality, behind most European countries, Canada, Australia, New Zealand, Hong Kong, Singapore, Japan, and Israel (5).
The United States international ranking in infant mortality fell from 12th in the world in 1960, to 23rd in 1990 to 29th in 2004 and 30th in 2005 (5). After decades of decline, the United States infant mortality rate did not decline significantly from 2000 to 2005 (6).
In 2005, 22 countries had infant mortality rates of 5.0 infant deaths per 1,000 live births or lower. The lowest infant mortality rates (3.0 or lower) were found in selected Scandinavian (Sweden and Finland) and East Asian (Japan, Hong Kong, and Singapore) countries (5). The rate in the United States was 6.86 in 2005 (6).
Differences in the reporting of live births between countries can have an impact on international comparisons of infant mortality.
In the United States and in 14 of 19 European countries, all live births at any birthweight or gestational age are required to be reported. Also, since no live births occur before 12 weeks of gestation, the requirement for Norway that all live births at 12 weeks of gestation or more be reported is substantially the same as for countries where all live births are required to be reported.
Table 1. Requirements for reporting a live birth, United States and selected European countries, 2004
| Reporting requirement | Country |
|---|---|
| All live births | Austria, Denmark, England and Wales, Finland, Germany, Hungary, Italy, Northern Ireland, Portugal, Scotland, Slovak Republic, Spain, Sweden, United States |
| Live births at 12 weeks of gestation or more | Norway |
| Live births at 500 grams birthweight or more, and less than 500 grams if the infant survives for 24 hours | Czech Republic |
| Live births at 22 weeks of gestation or more, or 500 grams birthweight or more | France |
| All live births for civil registration, births at 500 grams birthweight or more for the national perinatal register | Ireland |
| Live births at 22 weeks of gestation or more, 500 grams birthweight or more if gestational age is unknown | Netherlands |
| Live births at 500 or more grams birthweight | Poland |
SOURCE: NCHS/National Vital Statistics System for U.S. data and European Perinatal Health Report [PDF – 6.3 MB], p. 40 for European data.
In the Czech Republic, France, the Netherlands, and Poland, births at 500 grams birthweight or more or 22 weeks of gestation or more are required to be reported.
Although most countries require that all live births be reported, limits on birth registration requirements for some countries do have the potential to affect infant mortality comparisons, especially if very small infants who die soon after birth are excluded from infant mortality computations (7,8). There is also concern that birth registration may be incomplete near the lower limit of the reporting requirement, as the exact gestational age may not always be known.
Differences in national birth registration notwithstanding, there can also be individual differences between physicians or hospitals in the reporting of births for very small infants who die soon after birth.
For this reason, births and infant deaths at less than 22 weeks of gestation are excluded from the subsequent analysis in this report.
The U.S. infant mortality rate was still higher than for most European countries when births at less than 22 weeks of gestation were excluded.
When births at less than 22 weeks were excluded, the U.S. infant mortality rate dropped from 6.8 to 5.8 infant deaths per 1,000 live births in 2004 (2).
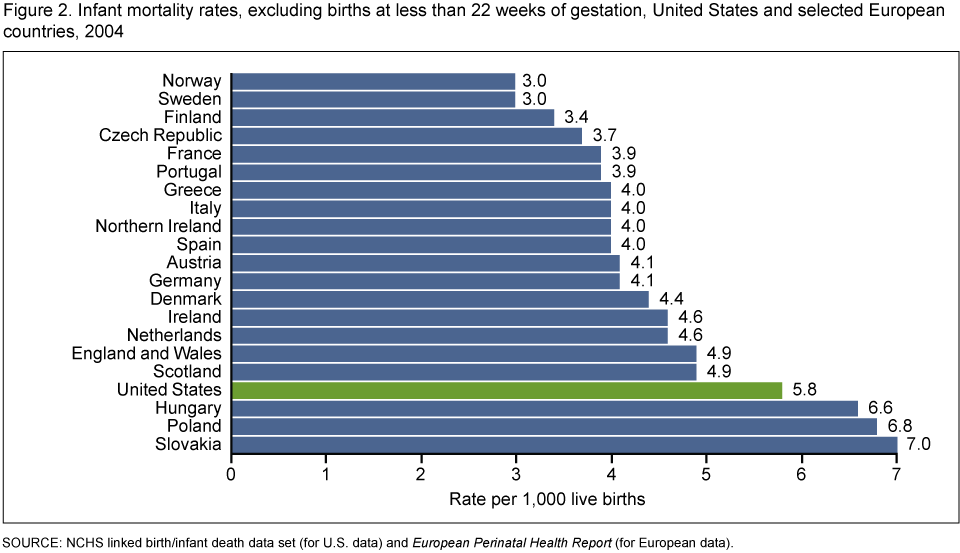 image icon
The U.S. infant mortality rate of 5.8 was nearly twice that for Sweden and Norway (3.0), the countries with the lowest infant mortality rates. Infant mortality rates for Hungary, Poland, and Slovakia were higher than the U.S. rate.
The United States compares favorably with European countries in infant mortality rates for preterm, but not for term infants.
The overall infant mortality rate can be partitioned into two key components: gestational age-specific infant mortality rates (i.e., the mortality rate for infants at a given gestational age); and the distribution of births by gestational age.
For the United States and for European countries, infant mortality rates were highest for infants born at 22-23 weeks of gestation and declined sharply with increasing gestational age. The majority of infants born at 22-23 weeks of gestation die in their first year of life; however, infant mortality rates for these very small infants may be unreliable as they may be affected by reporting differences as well as by differences in infant resuscitation practices (9).
Table 2. Gestational age-specific infant mortality rates, United States and selected European countries, 2004
| Selected countries | 22-23 weeks1 | 24-27 weeks | 28-31 weeks | 32-36 weeks | 37 weeks or more |
|---|---|---|---|---|---|
| United States | 707.7 | 236.9 | 45.0 | 8.6 | 2.4 |
| Austria | 888.9 | 319.6 | 43.8 | 5.8 | 1.5 |
| Denmark | 947.4 | 301.2 | 42.2 | 10.3 | 2.3 |
| England and Wales2 | 880.5 | 298.2 | 52.2 | 10.6 | 1.8 |
| Finland | 900.0 | 315.8 | 58.5 | 9.7 | 1.4 |
| Northern Ireland | 1,000.0 | 268.3 | 54.5 | 13.1 | 1.6 |
| Norway | 555.6 | 220.2 | 56.4 | 7.2 | 1.5 |
| Poland | 921.1 | 530.6 | 147.7 | 23.1 | 2.3 |
| Scotland | 1,000.0 | 377.0 | 60.8 | 8.8 | 1.7 |
| Sweden | 515.2 | 197.7 | 41.3 | 12.8 | 1.5 |
1 Infant mortality rates at 22-23 weeks of gestation may be unreliable due to reporting differences.
2 England and Wales provided 2005 data.
NOTE: Infant mortality rates are per 1,000 live births in specified group.
SOURCE: NCHS linked birth/infant death data set (for U.S. data), and European Perinatal Health Report (for European data).
The infant mortality rate for infants born at 24-27 weeks of gestation was lower in the United States than in most European countries (except Norway and Sweden) seven countries had higher rates. For infants born at 28-31 weeks of gestation, the U.S. rate was lower than for all countries shown except Austria, Denmark, and Sweden. For infants born at 32-36 weeks of gestation, the U.S. infant mortality rate was lower than for all countries shown except Austria and Norway. However, for infants born at 37 weeks of gestation or more, the United States’ infant mortality rate was highest among the countries studied.
The percentage of births that were born preterm was much higher in the United States than in Europe.
 image icon
In 2004, when births at less than 22 weeks of gestation were excluded, 12.4% of U.S. births were preterm, compared with 5.5% in Ireland, 6.3% in Sweden and France, and 7.4% in England and Wales. In the United States, 1 out of every 8 births were born preterm, whereas in Ireland and Finland only 1 out of 18 births were born preterm.
Among the 21 countries shown in Figure 2, the percentage of preterm births in the United States was 65% higher than in England and Wales, and more than double that for Ireland, Finland, and Greece.
Reporting differences have little effect on the percentage of preterm births because most preterm births occur well after 22 weeks of gestation. For example, the percentage of preterm births for the United States in 2004 was 12.5% when all births were included and 12.4% when births of less than 22 weeks of gestation were excluded.
Because preterm births are at greater risk of death or disability than term births, countries with a higher percentage of preterm births tend to have higher infant mortality rates.
Much of the high infant mortality rate in the United States is due to the high percentage of preterm births.
In 2004, the U.S. infant mortality rate (excluding births at less than 22 weeks of gestation) was 5.8, nearly twice the rate of 3.0 for Sweden, one of the two European countries with the lowest infant mortality rate (along with Norway).
Using direct standardization (10), we applied the U.S. gestational-age specific infant mortality rates to Sweden’s distribution of births by gestational age. If the United States had Sweden’s distribution of births by gestational age, the U.S. infant mortality rate (excluding births at less than 22 weeks of gestation) would go from 5.8 to 3.9 infant deaths per 1,000 live births—a decline of 33%.
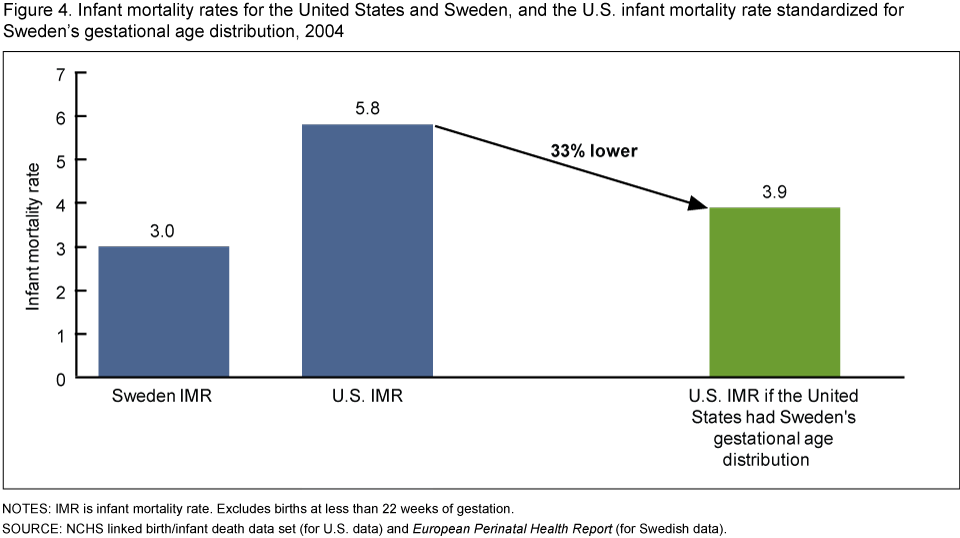 image icon
Thus, one-third (nearly 8,000) of infant deaths in the United States would be averted if the United States had Sweden’s distribution of births by gestational age. This provides evidence that lowering the percentage of preterm births could have a dramatic impact on infant mortality in the United States.
Summary
In 2005, the United States ranked 30th in the world in infant mortality, behind most European countries, Canada, Australia, New Zealand, Hong Kong, Singapore, Japan, and Israel. There are some differences among countries in the reporting of very small infants who may die soon after birth. However, it appears unlikely that differences in reporting are the primary explanation for the United States’ relatively low international ranking. In 2005, 22 countries had infant mortality rates of 5.0 or below. One would have to assume that these countries did not report more than one-third of their infant deaths for their infant mortality rates to equal or exceed the U.S. rate. This level of underreporting appears unlikely for most developed countries.
The United States compares favorably with Europe in the survival of infants born preterm. Infant mortality rates for preterm infants are lower in the United States than in most European countries. However, infant mortality rates for infants born at 37 weeks of gestation or more are generally higher in the United States than in European countries.
The primary reason for the United States’ higher infant mortality rate when compared with Europe is the United States’ much higher percentage of preterm births. In 2004, 1 in 8 infants born in the United States were born preterm, compared with 1 in 18 in Ireland and Finland. Preterm infants have much higher rates of death or disability than infants born at 37 weeks of gestation or more (2–4, 6), so the United States’ higher percentage of preterm births has a large effect on infant mortality rates. If the United States had the same gestational age distribution of births as Sweden, the U.S. infant mortality rate (excluding births at less than 22 weeks of gestation) would go from 5.8 to 3.9 infant deaths per 1,000 live births, a 33% decline. These data suggest that preterm birth prevention is crucial to lowering the U.S. infant mortality rate.
Definitions
Infant death: Death of an infant before his or her first birthday.
Infant mortality rate: Number of infant deaths per 1,000 live births.
Gestational age-specific infant mortality rate: Number of infant deaths for a specific gestational age group (for example, 24-27 weeks of gestation), divided by the number of live births for the same gestational age group x 1,000.
Preterm birth: Birth before 37 completed weeks of gestation.
Data source and methods
International rankings of infant mortality are from Health, United States, 2008, which provided international rankings for 2005 and earlier years (5). Data on infant mortality rates, gestational age-specific infant mortality rates, and the percentage of preterm births for European countries in 2004 were from the European Perinatal Health Report (4). Data were included for countries listed in both the European Perinatal Health Report and Health, United States, 2008, international rankings. To promote international comparability, the European Perinatal Health Report excluded data for live births and infant deaths of less than 22 weeks of gestation, and comparable data were computed for the United States from the NCHS Linked Birth/Infant Death Data Set (2,3). Direct standardization, a method described in detail elsewhere (10), was used to compute how much the U.S. infant mortality rate would be reduced if the United States had the same gestational-age distribution of births as Sweden.
Gestational age data for the United States are based on the date of last menstrual period, except when it is inconsistent with birthweight in which case the obstetric estimate is used (1). In many European countries data on gestational age are based on the “best obstetrical estimate,” which combines clinical and ultrasound data, but some countries favor use of the last menstrual period and others use only ultrasound estimates (4). The European Perinatal Health Report (4) and others (11,12) found that the use of ultrasound estimates tended to increase the preterm birth rate, when compared with data based on the last menstrual period. However, a study from the United States found the opposite effect for the use of the clinical estimate of gestation, when compared with gestational age dating based on the last menstrual period (13).
About the authors
Marian F. MacDorman and T.J. Mathews are with the Centers for Disease Control and Prevention’s National Center for Health Statistics, Division of Vital Statistics, Reproductive Statistics Branch. Frances Notzon and Jennifer H. Madans provided helpful comments on this report.
References
- Martin JA, Hamilton BE, Sutton PD, et al. Births: Final data for 2006. National vital statistics reports, vol 57 no 7. Hyattsville, MD: National Center for Health Statistics. 2009.
- Mathews TJ, MacDorman MF. Infant mortality from the 2004 period linked birth/infant death data set. National vital statistics reports, vol 55 no 14. Hyattsville, MD: National Center for Health Statistics. 2007.
- Mathews TJ, MacDorman MF. Infant mortality from the 2005 period linked birth/infant death data set. National vital statistics reports, vol 57 no 3. Hyattsville, MD: National Center for Health Statistics. 2008.
- EURO-PERISTAT Project, with SCPE, EUROCAT, EURONEOSTAT. European Perinatal Health Reportexternal icon. 2008.
- National Center for Health Statistics. Health United States, 2008 with special feature on the health of young adults. Hyattsville, MD: National Center for Health Statistics. 2009.
- MacDorman MF, Mathews TJ. Recent trends in infant mortality in the United States. NCHS data brief, no 9. Hyattsville, MD: National Center for Health Statistics. 2008.
- Graafmans WC, Richardus JH, Macfarlane A, et al. Comparability of published perinatal mortality rates in Western Europe: The qualitative impact of differences in gestational age and birthweight criteria. BJOG 108:1237-45.
- Kramer MS, Platt RW, Yang H, et al. Registration artifacts in international comparisons of infant mortality. Paediatr Perinat Epidemiol 16:16-22. 2002.
- Singh J, Fanaroff J, Andrews B, et al. Resuscitation in the “gray zone” of viability: Determining physician preferences and predicting infant outcomes. Pediatrics 120:519-26. 2007.
- Shryock HS, Siegel JS, Stockwell EG. The methods and materials of demography. Orlando, Florida: Academic Press. 1976.
- Lack N, Zeitlin J, Krebs L, Kunzel W, Alexander S. Methodological difficulties in the comparison of indicators of perinatal health across Europe. Eur J Obstet Gynecol 111:S33-S44. 2003.
- Blondel B, Morin I, Platt RW, Kramer MS, et al. Algorithms for combining menstrual and ultrasound estimates of gestational age: Consequences for rates of preterm and postterm birth BJOG 109:718-20. 2002.
- Wingate MS, Alexander GR, Buekens P, Vahratian A. Comparison of gestational age classifications: Date of last menstrual period vs. clinical estimate. Ann Epidemiol 17:425-430. 2007.
Suggested citation
MacDorman MF, Mathews TJ. Behind international rankings of infant mortality: How the United States compares with Europe. NCHS data brief, no 23. Hyattsville, MD: National Center for Health Statistics. 2009.
Copyright information
All material appearing in this report is in the public domain and may be reproduced or copied without permission; citation as to source, however, is appreciated.
National Center for Health
Statistics
Edward J. Sondik, Ph.D., Director
Jennifer H. Madans, Ph.D., Associate
Director for Science
Division of Vital Statistics
Charles J. Rothwell, M.S., Director