Caloric Intake From Fast Food Among Children and Adolescents in the United States, 2011–2012
- Key findings
- What percentage of children and adolescents consumed fast food on a given day?
- Did the percentage of calories consumed from fast food differ by sex or age?
- Did the percentage of calories consumed from fast food differ by race and Hispanic origin?
- Did the percentage of calories consumed from fast food differ by poverty status?
- Did the percentage of calories consumed from fast food differ by weight status?
- Summary
- Definitions
- Data source and methods
- About the authors
- References
- Suggested citation
NCHS Data Brief No. 213, September 2015
PDF Versionpdf icon (414 KB)
Sundeep Vikraman, M.D., M.P.H.; Cheryl D. Fryar, M.S.P.H.; and Cynthia L. Ogden, Ph.D.
Key findings
Data from the National Health and Nutrition Examination Survey
- In 2011–2012, just over one-third of children and adolescents consumed fast food on a given day.
- In 2011–2012, children and adolescents consumed on average 12.4% of their daily calories from fast food restaurants.
- Caloric intake from fast foods was higher in adolescents aged 12–19 years than in children aged 2–11 years.
- Non-Hispanic Asian children had significantly lower caloric intake from fast food compared with non-Hispanic white, non-Hispanic black, and Hispanic children.
- No significant differences in caloric intake from fast food were noted by sex, poverty status, or weight status.
Consumption of fast food has been linked to weight gain in adults (1). Fast food has also been associated with higher caloric intake and poorer diet quality in children and adolescents (2). From 1994 through 2006, caloric intake from fast food increased from 10% to 13% among children aged 2–18 years (3). This report presents the most recent data on the percentage of calories consumed from fast food among U.S. children by sex, age group, race and Hispanic origin, poverty status, and weight status.
Keywords: pediatric, diet, calories, National Health and Nutrition Examination Survey
What percentage of children and adolescents consumed fast food on a given day?
In 2011–2012, 34.3% of all children and adolescents aged 2–19 consumed fast food on a given day (Figure 1). Almost 12% (11.6%) of children and adolescents obtained fewer than 25% of their daily calories from fast food, 10.7% obtained 25%–40% of their daily calories from fast food, and 12.1% obtained more than 40% of their daily calories from fast food.
Figure 1. Percentage of children and adolescents aged 2–19 years who consumed fast food on a given day, by calories consumed: United States, 2011–2012
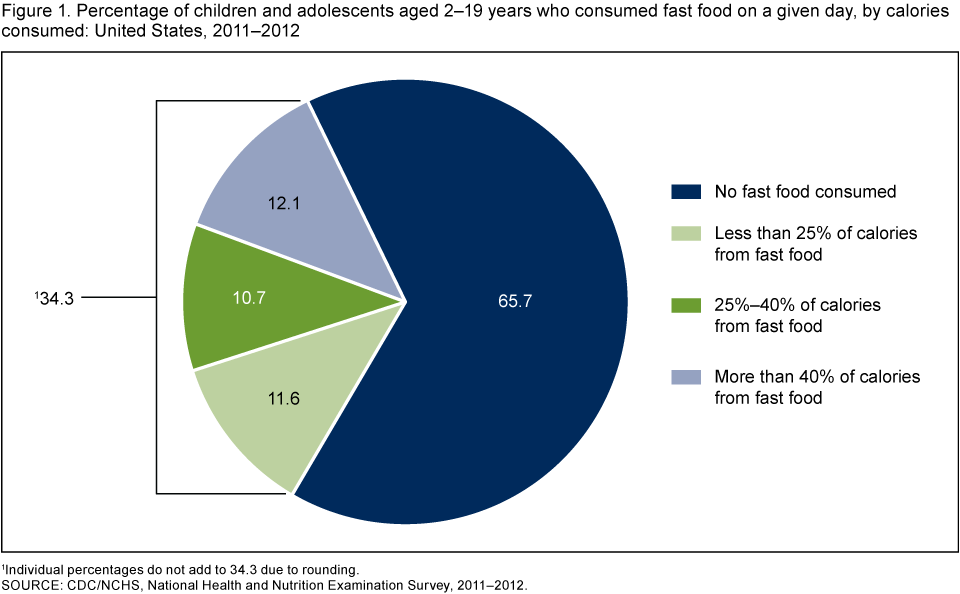
1Individual percentages do not add to 34.3 due to rounding.
SOURCE: CDC/NCHS, National Health and Nutrition Examination Survey, 2011–2012.
Did the percentage of calories consumed from fast food differ by sex or age?
In 2011–2012, children and adolescents aged 2–19 consumed on average 12.4% of their daily calories from fast food, and there was no significant difference between boys and girls overall or in any age group (Figure 2). The percentage of calories consumed from fast food increased with age. In children aged 2–11, the average percentage of calories consumed from fast food was 8.7%, while in adolescents aged 12–19, the average percentage of calories consumed was 16.9%. This difference was seen among both boys and girls.
Figure 2. Mean percentage of calories from fast food among children and adolescents aged 2–19 years, by sex and age: United States, 2011–2012
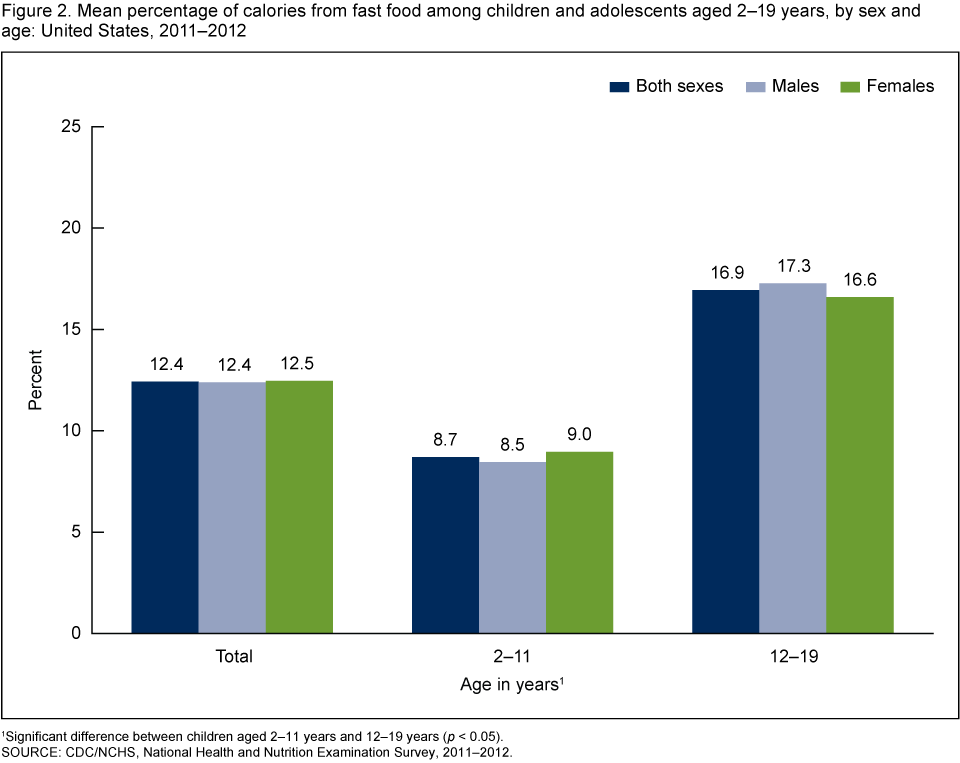
1Significant difference between children aged 2–11 years and 12–19 years (p < 0.05).
SOURCE: CDC/NCHS, National Health and Nutrition Examination Survey, 2011–2012.
Did the percentage of calories consumed from fast food differ by race and Hispanic origin?
Non-Hispanic Asian children and adolescents aged 2–19 consumed significantly fewer daily calories (8.0%) from fast food compared with non-Hispanic white (13.1%), non-Hispanic black (13.9%), and Hispanic (11.2%) children and adolescents (Figure 3). Among children aged 2–11, non-Hispanic Asian children consumed an average of 5.0% of their daily calories from fast food compared with non-Hispanic white (9.1%), non-Hispanic black (9.8%), and Hispanic (8.4%) children. Among adolescents aged 12–19, non-Hispanic Asian adolescents consumed a lower daily percentage of calories (11.9%) from fast food than non-Hispanic white (17.8%) and non-Hispanic black (18.8%) adolescents. However, the observed difference in average daily calories consumed from fast food between non-Hispanic Asian and Hispanic adolescents was not significant.
Figure 3. Mean percentage of calories from fast food among children and adolescents aged 2–19 years, by race and Hispanic origin and age: United States, 2011–2012
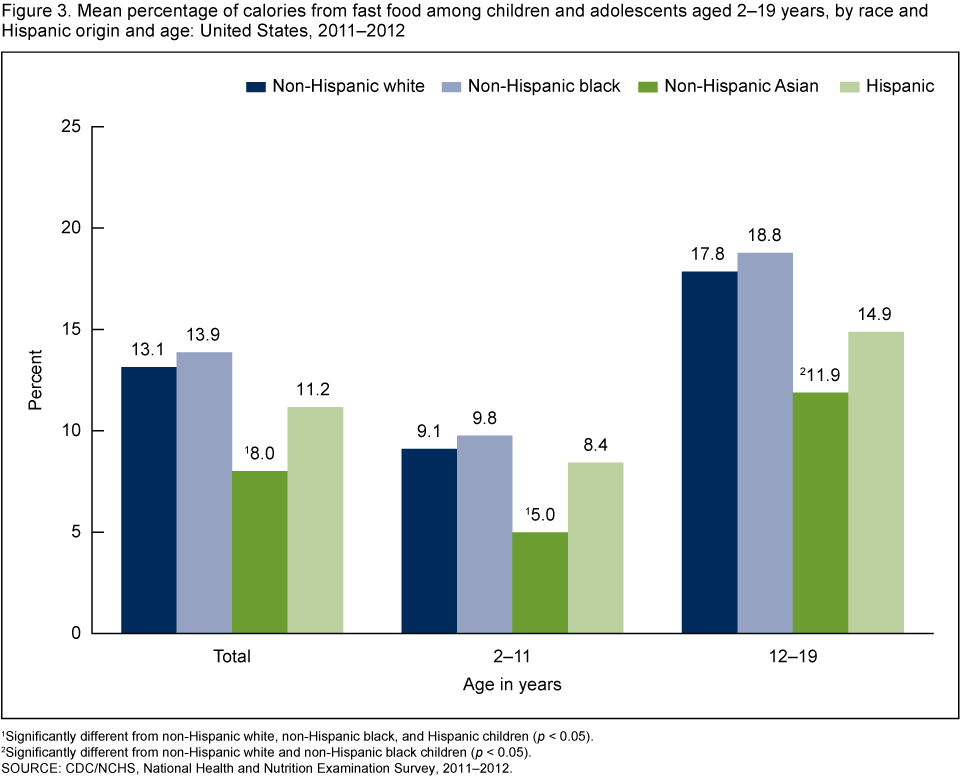
1Significantly different from non-Hispanic white, non-Hispanic black, and Hispanic children (p < 0.05).
2Significantly different from non-Hispanic white and non-Hispanic black children (p < 0.05).
SOURCE: CDC/NCHS, National Health and Nutrition Examination Survey, 2011–2012.
Did the percentage of calories consumed from fast food differ by poverty status?
No significant difference was seen by poverty status in the average daily percentage of calories consumed from fast food among children and adolescents aged 2–19 (Figure 4). There were no differences by poverty status among either younger children (aged 2–11) or adolescents (aged 12–19).
Figure 4. Mean percentage of calories from fast food among children and adolescents aged 2–19 years, by poverty status and age: United States, 2011–2012
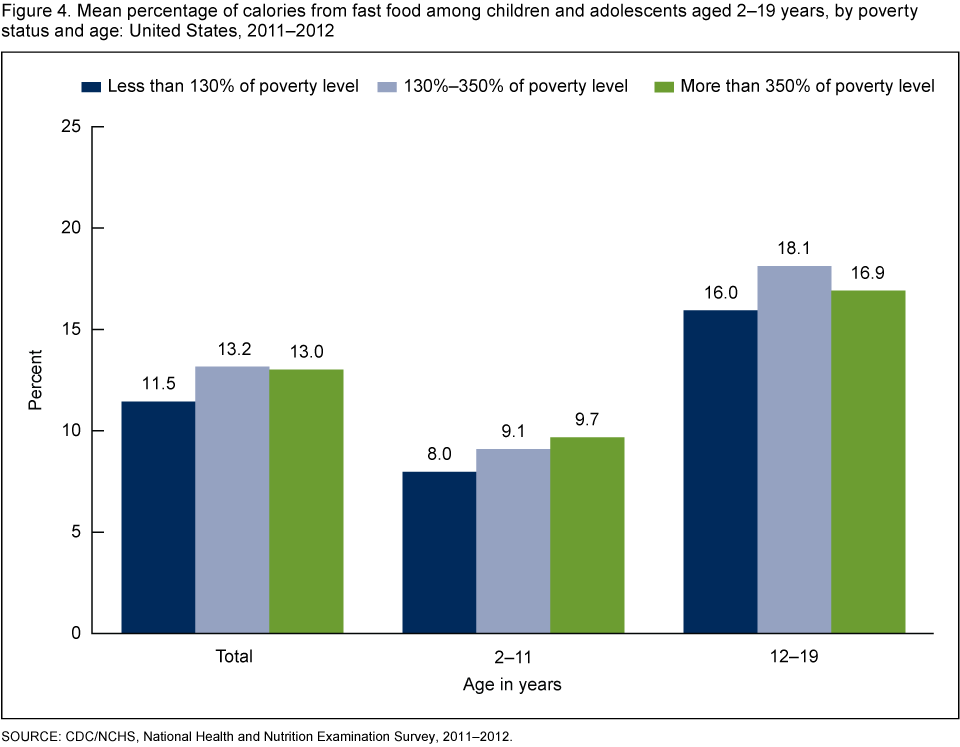
SOURCE: CDC/NCHS, National Health and Nutrition Examination Survey, 2011–2012.
Did the percentage of calories consumed from fast food differ by weight status?
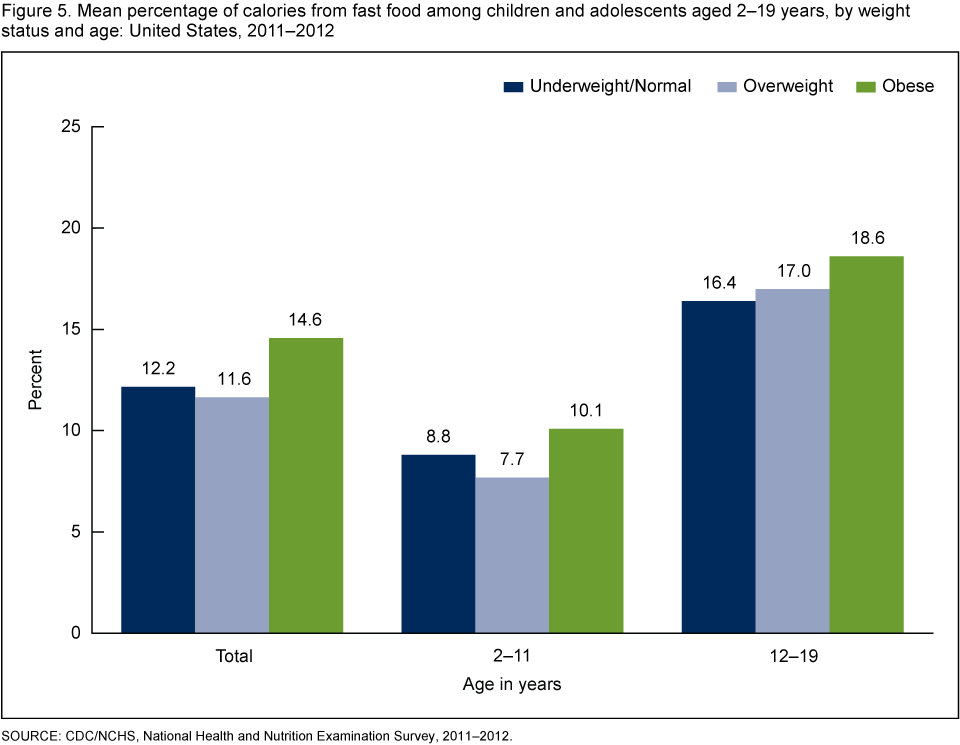
Among children and adolescents aged 2–19, the average daily percentage of calories consumed from fast food did not vary significantly by weight status (Figure 5). There was no significant difference by weight status for children aged 2–11 or for adolescents aged 12–19.
Figure 5. Mean percentage of calories from fast food among children and adolescents aged 2–19 years, by weight status and age: United States, 2011–2012
SOURCE: CDC/NCHS, National Health and Nutrition Examination Survey, 2011–2012.
Summary
In 2011–2012, children and adolescents aged 2–19 consumed an average 12.4% of their daily calories from fast food. Adolescents aged 12–19 consumed twice the average daily percentage of calories from fast food than did younger children. The percentage of calories from fast food differed by age and race and Hispanic origin. Overall, non-Hispanic Asian children and adolescents consumed a lower percentage of calories from fast food compared with the other race and Hispanic groups. Previous studies have reported that acculturation to the U.S. lifestyle plays an important role in the adoption of unhealthy behaviors, such as fast food consumption, in Asian-American and other immigrant groups (4,5). In 2011–2012, a greater percentage of non-Hispanic Asian children and adolescents were foreign-born (27.4%), compared with Hispanic (19.7%), non-Hispanic white (2.5%), and non-Hispanic black (1.9%) children and adolescents (data not shown). This analysis found no significant differences in fast food consumption by poverty status or weight status among children and adolescents.
Definitions
Fast-food consumption: Respondents were asked to report where they got each food that they reported in the 24-hour dietary recall. Food reported as “restaurant fast food/pizza” was selected as fast food for these analyses.
Poverty status: Based on an index representing the ratio of family income to poverty. The U.S. Department of Health and Human Services’ poverty guidelines were used as the poverty measure to calculate this index (6). The cut point for participation in the Supplemental Nutrition Assistance Program is 130% of the poverty level.
Weight status: Body mass index (BMI) is calculated as weight in kilograms divided by height in meters squared (kg/m2) rounded to one decimal point. Underweight/Normal weight is BMI below the 85th percentile on sex-specific CDC BMI-for-age growth charts; overweight is between the 85th and 95th percentiles; and obese is BMI at or above the 95th percentile.
Data source and methods
Data from the 2011–2012 National Health and Nutrition Examination Survey (NHANES) were used for these analyses (7). NHANES is a cross-sectional survey designed to monitor the health and nutritional status of the civilian noninstitutionalized U.S. population. The survey consists of interviews conducted in participants’ homes and standardized physical examinations in mobile examination centers (MECs). Dietary information was obtained via an in-person 24-hour dietary recall interview in the MEC. Dietary recalls cover intake for the 24-hour period prior to the interview (midnight to midnight).
The NHANES sample is selected through a complex, multistage design that includes selection of primary sampling units (counties), household segments within the counties, and, finally, sample persons from selected households. The sample design includes oversampling to obtain reliable estimates of health and nutritional measures for population subgroups. African-American persons, Hispanic persons, non-Hispanic Asian persons, persons with low income, and persons aged 80 and over were oversampled during 2011–2012. NHANES public-use data files are released in 2-year cycles. Day 1 dietary sample weights—which account for the differential probabilities of selection, nonresponse, and noncoverage—as well as day of the week of dietary recall and nonresponse to the dietary interview, were incorporated into the estimation process.
All differences reported are statistically significant unless otherwise indicated. Statistical analyses were conducted using SAS version 9.3 (SAS Institute, Cary, N.C.) and SUDAAN version 11.0 (RTI International, Research Triangle Park, N.C.).
About the authors
Sundeep Vikraman was a student volunteer with CDC’s National Center for Health Statistics, Division of Health and Nutrition Examination Surveys and a graduate student at the George Washington University Milken Institute School of Public Health during the analysis and writing of this report. Cheryl D. Fryar and Cynthia L. Ogden are also with the Division of Health and Nutrition Examination Surveys.
References
- Fryar CD, Ervin RB. Caloric intake from fast food among adults: United States, 2007–2010. NCHS data brief, no 114. Hyattsville, MD: National Center for Health Statistics. 2013.
- Powell LM, Nguyen BT. Fast-food and full-service restaurant consumption among children and adolescents: Effect on energy, beverage, and nutrient intake. JAMA Pediatr 167(1):14–20. 2013.
- Poti JM, Popkin BM. Trends in energy intake among US children by eating location and food source, 1977–2006. J Am Diet Assoc 111(8):1156–64. 2011.
- Unger JB, Reynolds K, Shakib S, Spruijt-Metz D, Sun P, Johnson CA. Acculturation, physical activity, and fast-food consumption among Asian-American and Hispanic adolescents. J Community Health 29(6):467–81. 2004.
- Wang S, Quan J, Kanaya AM, Fernandez A. Asian Americans and obesity in California: A protective effect of biculturalism. J Immigr Minor Health 13(2):276–83. 2011.
- HHS. Poverty guidelines, research, and measurementexternal icon. 2011.
- NCHS. National Health and Nutrition Examination Survey: Questionnaires, datasets, and related documentation.
Suggested citation
Vikraman S, Fryar CD, Ogden CL. Caloric intake from fast food among children and adolescents in the United States, 2011–2012. NCHS data brief, no 213. Hyattsville, MD: National Center for Health Statistics. 2015.
Copyright information
All material appearing in this report is in the public domain and may be reproduced or copied without permission; citation as to source, however, is appreciated.
National Center for Health Statistics
Charles J. Rothwell, M.S., M.B.A., Director
Nathaniel Schenker, Ph.D., Deputy Director
Jennifer H. Madans, Ph.D., Associate Director for Science
Division of Health and Nutrition Examination Surveys
Kathryn S. Porter, M.D., M.S., Director