Drug Poisoning Mortality, by State and by Race and Ethnicity: United States, 2019
by Arialdi M. Miniño, M.P.H., and Holly Hedegaard, M.D.
PDF Versionpdf icon (406 KB)
In 2019, 70,630 deaths from the toxic effects of drug poisoning (drug overdose) occurred in the United States (1), a 4.8% increase compared with 2018 and the highest recorded number in recent history. Drug overdose deaths remain a persistent and urgent public health problem in the United States. This NCHS Health E-Stat provides information on drug overdose mortality by state (and the District of Columbia) and by race and ethnicity, and adds to findings from a recently published Data Brief on drug overdose death rates (1).
The age-adjusted rate for drug overdose deaths in the United States for 2019 was 21.6 per 100,000 standard population (Figure 1, Table). The five states with the highest rates were West Virginia (52.8), Delaware (48.0), District of Columbia (43.2), Ohio (38.3), and Maryland (38.2). The five states with the lowest rates were Nebraska (8.7), South Dakota (10.5), Texas (10.8), North Dakota (11.4), and Iowa (11.5).
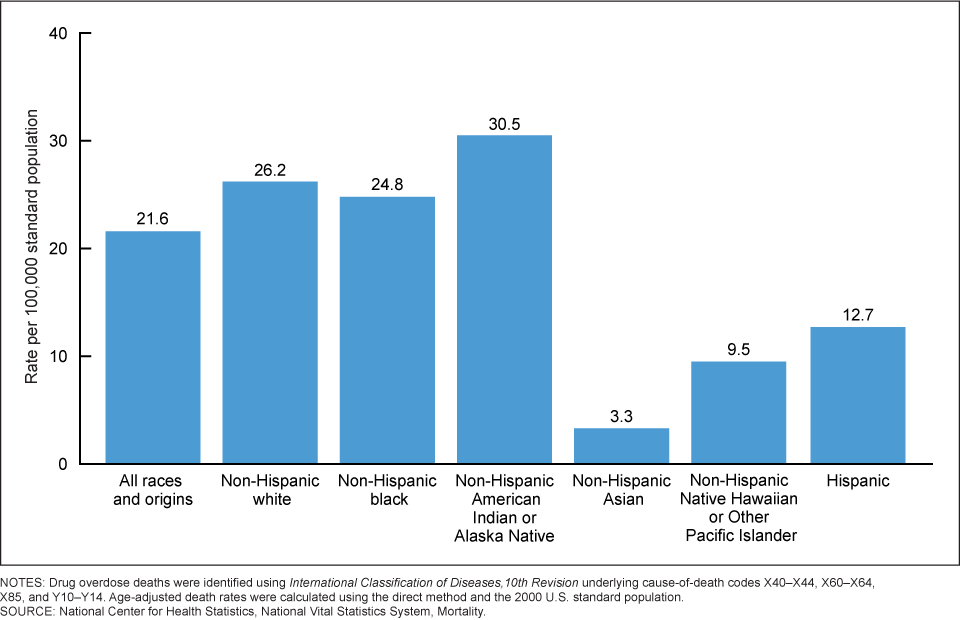
The age-adjusted drug overdose death rate for the non-Hispanic white population in 2019 (26.2 per 100,000 standard population) was 21.3% higher than the national rate (Figure 2). The rate for the non-Hispanic black population (24.8) was 14.8% higher than the national rate. The rate for the non-Hispanic American Indian or Alaska Native population (30.5) was 41.2% higher than the national rate. The rate for the non-Hispanic Asian population (3.3) was 84.7% lower than the national rate. The rate for the non-Hispanic Native Hawaiian or Other Pacific Islander population (9.5) was 56.0% lower than the national rate. The rate for the Hispanic population (12.7) was 41.2% lower than the national rate.
Data source and methods
Data are from the National Vital Statistics System Multiple Cause-of-death file for 2019. Deaths and death rates were produced using the Centers for Disease Control and Prevention’s WONDER online database (2). Drug overdose deaths were classified using International Statistical Classification of Diseases, 10th Revision underlying cause-of-death codes X40–X44, X60–X64, X85, and Y10–Y14.
Starting with 2018 data, the National Vital Statistics System has presented mortality statistics by race using the Office of Management and Budget’s (OMB) 1997 standards for collecting, tabulating, and reporting race and ethnicity in the United States (3). Estimates for prior years were produced according to the 1977 OMB standards (4). Single-race estimates based on the 1997 OMB standards may not be comparable to estimates for earlier years that were produced by bridging multiple-race choices back to a single-race category. This lack of comparability applies particularly to the race categories with smaller populations (5).
Death rates for non-Hispanic Asian or Pacific Islander, non-Hispanic American Indian or Alaska Native, and Hispanic persons may be underestimated and should be interpreted with caution (6).
Age-adjusted death rates were calculated using the direct method and the 2000 U.S. standard population. Vintage 2019 population data were single-race postcensal estimates of the July 1 resident population produced by the U.S. Census Bureau and released on June 25, 2020. The statistical significance of differences between the national rate and those computed for the race and Hispanic-origin populations was assessed using a z test. Any differences mentioned (higher than, lower than) were significant at the 0.05 level. State-specific rates were ranked and classified according to the percentile distribution of all the values. Statistical significance was not assessed to compare the state-specific death rates.
References
- Hedegaard H, Miniño AM, Warner M. Drug overdose deaths in the United States, 1999–2019. NCHS Data Brief, no. 394. Hyattsville, MD: National Center for Health Statistics. 2020.
- Centers for Disease Control and Prevention. 2018–2019 underlying cause of death by single-race categories on CDC WONDER. 2020.
- Office of Management and Budget. Revisions to the standards for the classification of federal data on race and ethnicitypdf iconexternal icon. Fed Regist 62(210):58782–90. 1997.
- Office of Management and Budget. Racial and ethnic standards for federal statistics and administrative reportingexternal icon. Statistical Policy Directive no. 15. 1977.
- Murphy SL, Xu JQ, Kochanek KD, Arias E, Tejada-Vera B. Deaths: Final data for 2018. National Vital Statistics Reports; vol 69 no 13. Hyattsville, MD: National Center for Health Statistics. 2020.
- Arias E, Heron M, Hakes JK. The validity of race and Hispanic-origin reporting on death certificates in the United States: An update. National Center for Health Statistics. Vital Health Stat 2(172). 2016.
Suggested citation
Miniño AM, Hedegaard H. Drug poisoning mortality, by state and by race and ethnicity:
United States, 2019. NCHS Health E-Stats. 2021. DOI: https://doi.org/10.15620/cdc:103967external icon.
Figures
Figure 1. Age-adjusted drug overdose death reates, by state: United States, 2019
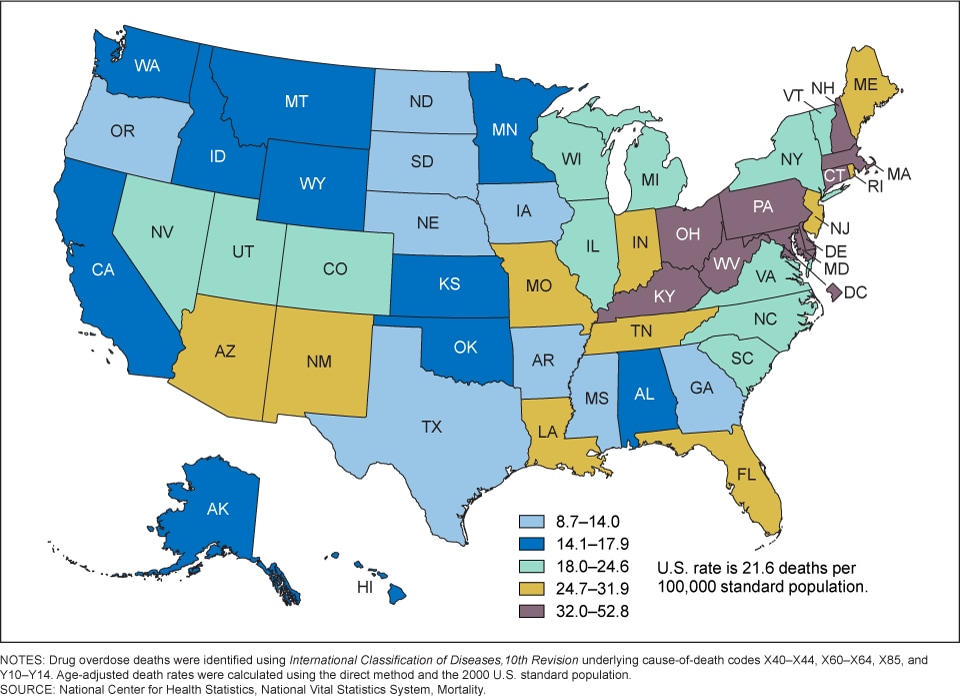
Figure 2. Age-adjusted drug overdose death rates, by race and Hispanic origin: United States, 2019
Table
Table. Number and age-adjusted rates of drug overdose deaths, by state: United States, 2019
| Area | Number | Deaths per 100,000 |
|---|---|---|
| United States | 70,630 | 21.6 |
| Alabama | 768 | 16.3 |
| Alaska | 132 | 17.8 |
| Arizona | 1,907 | 26.8 |
| Arkansas | 388 | 13.5 |
| California | 6,198 | 15.0 |
| Colorado | 1,079 | 18.0 |
| Connecticut | 1,214 | 34.7 |
| Delaware | 435 | 48.0 |
| District of Columbia | 311 | 43.2 |
| Florida | 5,268 | 25.5 |
| Georgia | 1,408 | 13.1 |
| Hawaii | 242 | 15.9 |
| Idaho | 265 | 15.1 |
| Illinois | 2,790 | 21.9 |
| Indiana | 1,699 | 26.6 |
| Iowa | 352 | 11.5 |
| Kansas | 403 | 14.3 |
| Kentucky | 1,380 | 32.5 |
| Louisiana | 1,267 | 28.3 |
| Maine | 371 | 29.9 |
| Maryland | 2,369 | 38.2 |
| Massachusetts | 2,210 | 32.1 |
| Michigan | 2,385 | 24.4 |
| Minnesota | 792 | 14.2 |
| Mississippi | 394 | 13.6 |
| Missouri | 1,583 | 26.9 |
| Montana | 143 | 14.1 |
| Nebraska | 161 | 8.7 |
| Nevada | 647 | 20.1 |
| New Hampshire | 407 | 32.0 |
| New Jersey | 2,805 | 31.7 |
| New Mexico | 599 | 30.2 |
| New York | 3,617 | 18.2 |
| North Carolina | 2,266 | 22.3 |
| North Dakota | 82 | 11.4 |
| Ohio | 4,251 | 38.3 |
| Oklahoma | 645 | 16.7 |
| Oregon | 615 | 14.0 |
| Pennsylvania | 4,377 | 35.6 |
| Rhode Island | 307 | 29.5 |
| South Carolina | 1,127 | 22.7 |
| South Dakota | 86 | 10.5 |
| Tennessee | 2,089 | 31.2 |
| Texas | 3,136 | 10.8 |
| Utah | 571 | 18.9 |
| Vermont | 133 | 23.8 |
| Virginia | 1,547 | 18.3 |
| Washington | 1,259 | 15.8 |
| West Virginia | 870 | 52.8 |
| Wisconsin | 1,201 | 21.1 |
| Wyoming | 79 | 14.1 |
NOTES: Drug overdose deaths were identified using International Classification of Diseases,10th Revision underlying cause-of-death codes X40–X44, X60–X64, X85, and Y10–Y14. Age-adjusted death rates were calculated using the direct method and the 2000 U.S. standard population.
SOURCE: National Center for Health Statistics, National Vital Statistics System, Mortality.