Board of Scientific Counselors – Presentations
September 17-18, 2007
Back to September 2007 Presentations
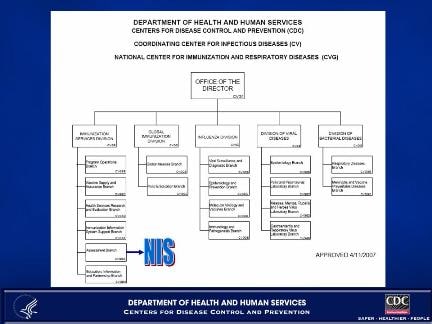
NIS & SLAITS Program Overview: National Immunization Survey
PowerPoint Presentation [PDF – 13 MB]
Slide 1
NIS & SLAITS Program Overview:
National Immunization Survey
NCHS BSC Meeting
September 17, 2007
James A. Singleton, M.S.
Chief, Assessment Branch
Immunization Services Division
NCIRD/CDC
Slide 2
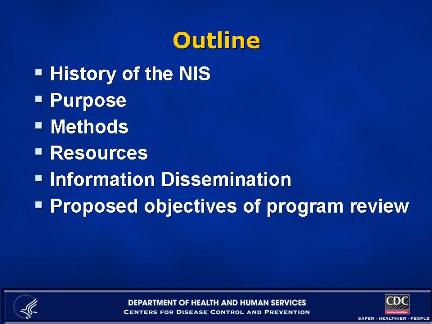
Outline
- History of the NIS
- Purpose
- Methods
- Resources
- Information Dissemination
- Proposed objectives of program review
Slide 3
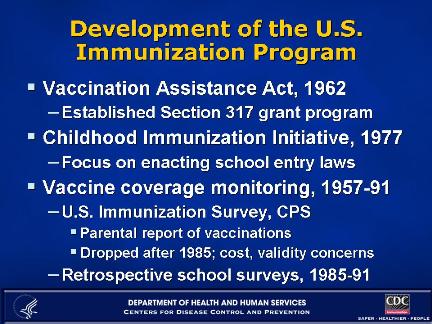
Development of the U.S. Immunization Program
- Vaccination Assistance Act, 1962
- Established Section 317 grant program
- Childhood Immunization Initiative, 1977
- Focus on enacting school entry laws
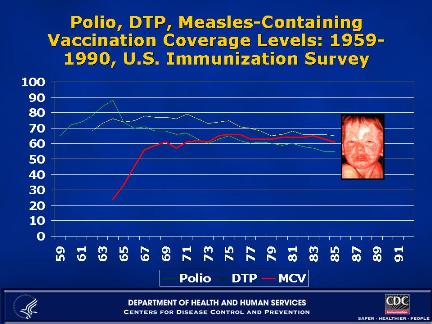
- Vaccine coverage monitoring, 1957-91
- U.S. Immunization Survey, CPS
- Parental report of vaccinations
- Dropped after 1985; cost, validity concerns
- Retrospective school surveys, 1985-91
- U.S. Immunization Survey, CPS
Slide 4
Polio, DTP, Measles-Containing Vaccination Coverage Levels: 1959-1990, U.S. Immunization Survey
Slide 5
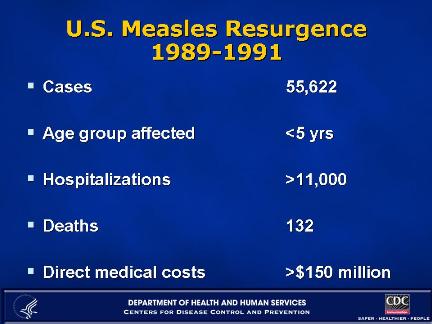
U.S. Measles Resurgence
1989-1991
- Cases 55,622
- Age group affected < 5 yrs
- Hospitalizations > 11,000
- Deaths 132
- Direct medical costs > $150 million
Slide 6
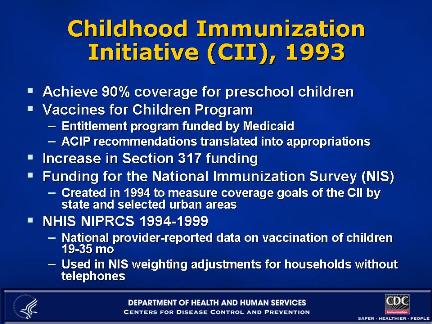
Childhood Immunization Initiative (CII), 1993
- Achieve 90% coverage for preschool children
- Vaccines for Children Program
- Entitlement program funded by Medicaid
- ACIP recommendations translated into appropriations
- Increase in Section 317 funding
- Funding for the National Immunization Survey (NIS)
- Created in 1994 to measure coverage goals of the CII by state and selected urban areas
- NHIS NIPRCS 1994-1999
- National provider-reported data on vaccination of children 19-35 mo
- Used in NIS weighting adjustments for households without telephones
Slide 7
Mission
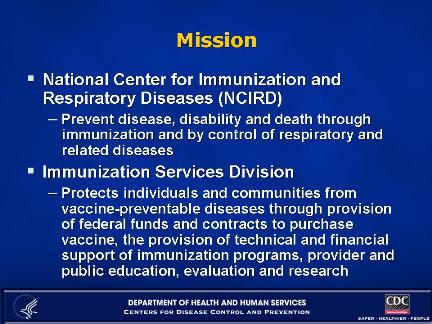
- National Center for Immunization and Respiratory Diseases (NCIRD)
- Prevent disease, disability and death through immunization and by control of respiratory and related diseases
- Immunization Services Division
- Protects individuals and communities from vaccine-preventable diseases through provision of federal funds and contracts to purchase vaccine, the provision of technical and financial support of immunization programs, provider and public education, evaluation and research
Slide 8
Slide 9
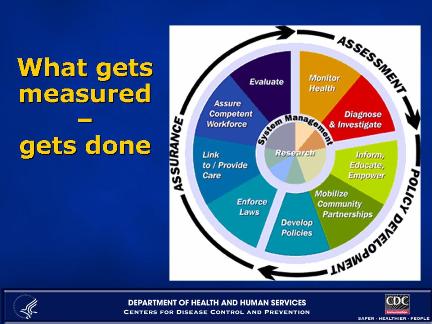
What gets measured – gets done
Notes: The National Commission on Prevention Priorities guided an update to 2001 ranking of clinical preventive services. Rankings were based on two measures: clinically preventable burden and cost-effectiveness. The top three ranked preventive services included the childhood immunization series.
Slide 10
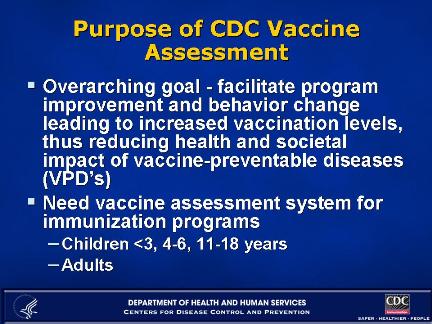
Purpose of CDC Vaccine Assessment
- Overarching goal – facilitate program improvement and behavior change leading to increased vaccination levels, thus reducing health and societal impact of vaccine-preventable diseases (VPD’s)
- Need vaccine assessment system for immunization programs
- Children < 3, 4-6, 11-18 years
- Adults
Slide 11
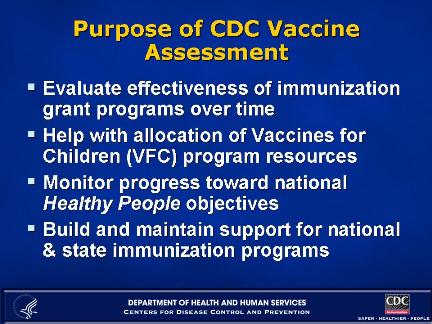
Purpose of CDC Vaccine Assessment
- Evaluate effectiveness of immunization grant programs over time
- Help with allocation of Vaccines for Children (VFC) program resources
- Monitor progress toward national Healthy People objectives
- Build and maintain support for national & state immunization programs
Slide 12
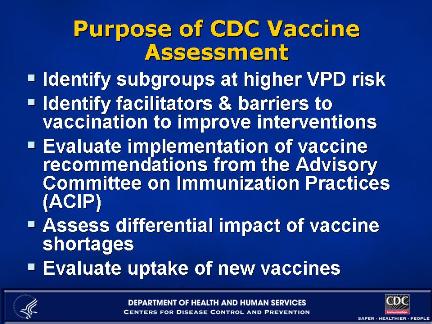
Purpose of CDC Vaccine Assessment
- Identify subgroups at higher VPD risk
- Identify facilitators & barriers to vaccination to improve interventions
- Evaluate implementation of vaccine recommendations from the Advisory Committee on Immunization Practices (ACIP)
- Assess differential impact of vaccine shortages
- Evaluate uptake of new vaccines
Slide 13
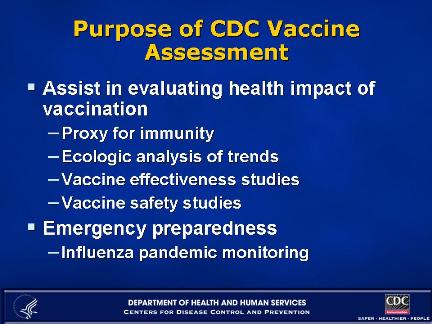
Purpose of CDC Vaccine Assessment
- Assist in evaluating health impact of vaccination
- Proxy for immunity
- Ecologic analysis of trends
- Vaccine effectiveness studies
- Vaccine safety studies
- Emergency preparedness
- Influenza pandemic monitoring
Slide 14
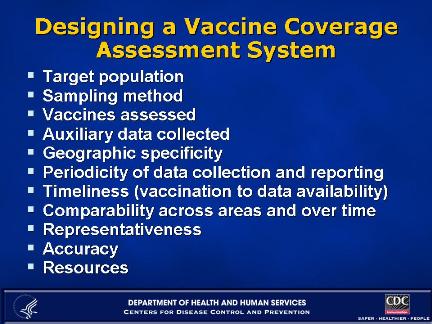
Designing a Vaccine Coverage Assessment System
- Target population
- Sampling method
- Vaccines assessed
- Auxiliary data collected
- Geographic specificity
- Periodicity of data collection and reporting
- Timeliness (vaccination to data availability)
- Comparability across areas and over time
- Representativeness
- Accuracy
- Resources
Slide 15
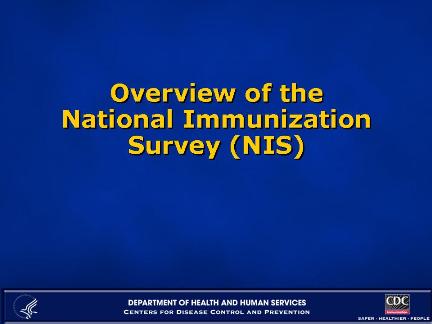
Overview of the National Immunization Survey (NIS)
Slide 16
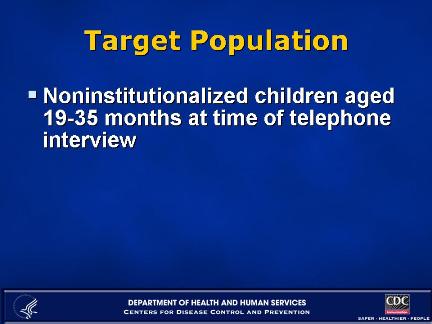
Target Population
- Noninstitutionalized children aged 19-35 months at time of telephone interview
Slide 17
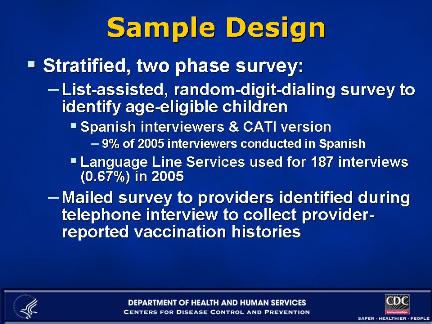
Sample Design
- Stratified, two phase survey:
- List-assisted, random-digit-dialing survey to identify age-eligible children
- Spanish interviewers & CATI version
- 9% of 2005 interviewers conducted in Spanish
- Language Line Services used for 187 interviews (0.67%) in 2005
- Spanish interviewers & CATI version
- Mailed survey to providers identified during telephone interview to collect provider-reported vaccination histories
- List-assisted, random-digit-dialing survey to identify age-eligible children
Slide 18
Slide 19
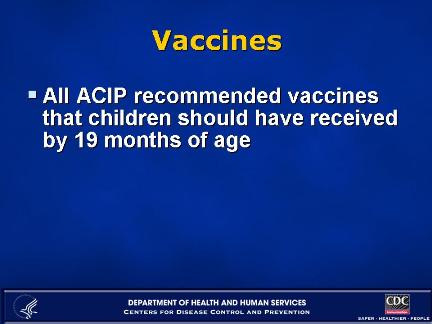
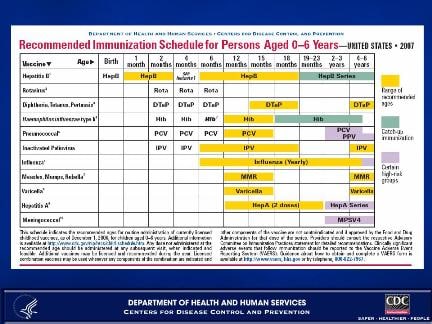
Vaccines
- All ACIP recommended vaccines that children should have received by 19 months of age
Slide 20
Slide 21
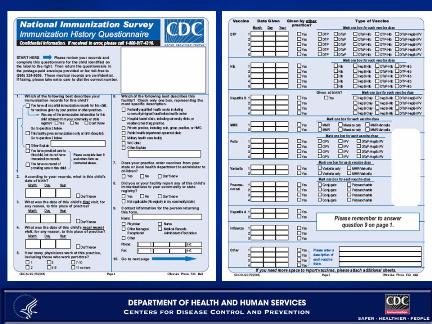
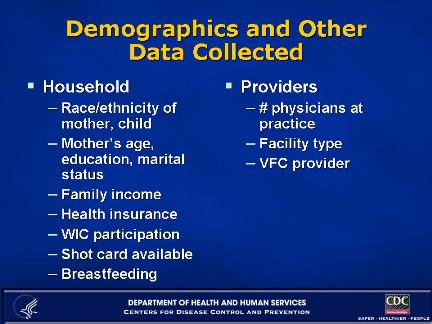
Demographics and Other Data Collected
- Household
- Race/ethnicity of mother, child
- Mother’s age, education, marital status
- Family income
- Health insurance
- WIC participation
- Shot card available
- Breastfeeding
- Providers
- # physicians at practice
- Facility type
- VFC provider
Slide 22
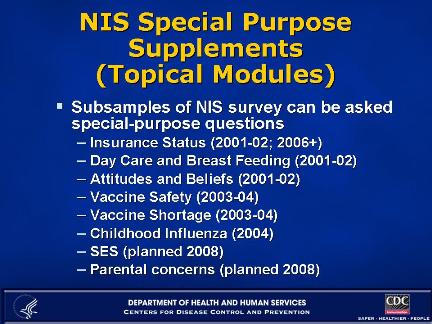
NIS Special Purpose Supplements (Topical Modules)
- Subsamples of NIS survey can be asked special-purpose questions
- Insurance Status (2001-02; 2006+)
- Day Care and Breast Feeding (2001-02)
- Attitudes and Beliefs (2001-02)
- Vaccine Safety (2003-04)
- Vaccine Shortage (2003-04)
- Childhood Influenza (2004)
- SES (planned 2008)
- Parental concerns (planned 2008)
Slide 23
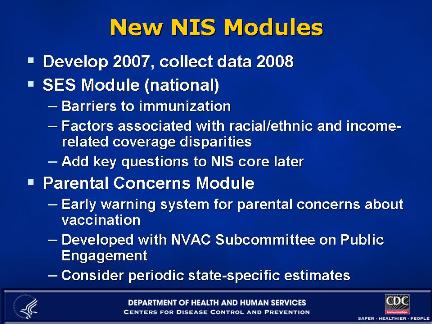
New NIS Modules
- Develop 2007, collect data 2008
- SES Module (national)
- Barriers to immunization
- Factors associated with racial/ethnic and income-related coverage disparities
- Add key questions to NIS core later
- Parental Concerns Module
- Early warning system for parental concerns about vaccination
- Developed with NVAC Subcommittee on Public Engagement
- Consider periodic state-specific estimates
Notes: Past NIS modules have addressed parent safety concerns, deferral of vaccination in a shortage, influenza vaccination of young children. We are also interested in ideas for future modules for the 2009 NIS.
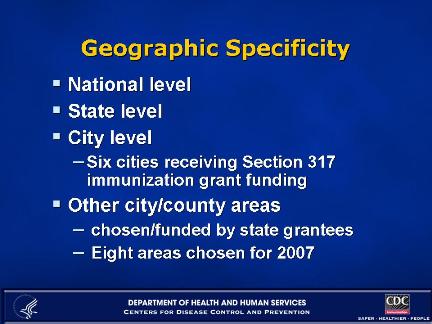
Slide 24
Geographic Specificity
- National level
- State level
- City level
- Six cities receiving Section 317 immunization grant funding
- Other city/county areas
- chosen/funded by state grantees
- Eight areas chosen for 2007
Slide 25
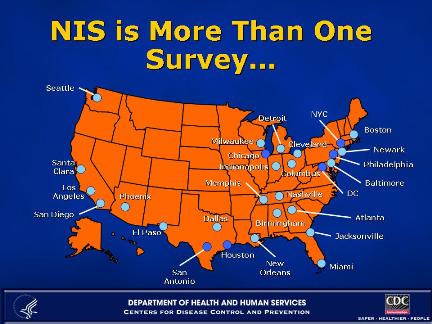
NIS is More Than One Survey…
Slide 26
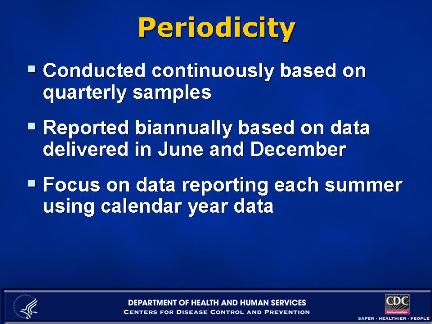
Periodicity
- Conducted continuously based on quarterly samples
- Reported biannually based on data delivered in June and December
- Focus on data reporting each summer using calendar year data
Slide 27
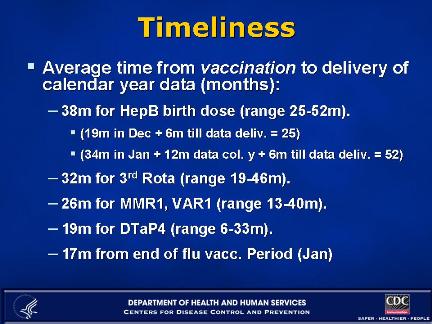
Timeliness
- Average time from vaccination to delivery of calendar year data (months):
- 38m for HepB birth dose (range 25-52m).
- (19m in Dec + 6m till data deliv. = 25)
- (34m in Jan + 12m data col. y + 6m till data deliv. = 52)
- 32m for 3rd Rota (range 19-46m).
- 26m for MMR1, VAR1 (range 13-40m).
- 19m for DTaP4 (range 6-33m).
- 17m from end of flu vacc. Period (Jan)
- 38m for HepB birth dose (range 25-52m).
Slide 28
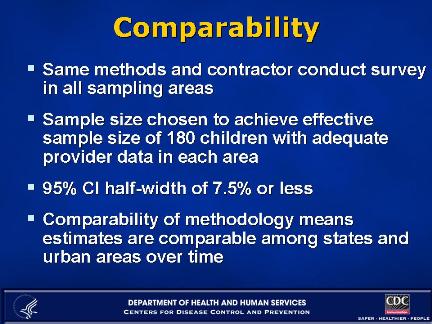
Comparability
- Same methods and contractor conduct survey in all sampling areas
- Sample size chosen to achieve effective sample size of 180 children with adequate provider data in each area
- 95% CI half-width of 7.5% or less
- Comparability of methodology means estimates are comparable among states and urban areas over time
Slide 29
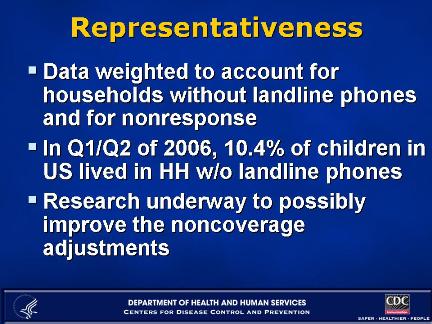
Representativeness
- Data weighted to account for households without landline phones and for nonresponse
- In Q1/Q2 of 2006, 10.4% of children in US lived in HH w/o landline phones
- Research underway to possibly improve the noncoverage adjustments
Slide 30
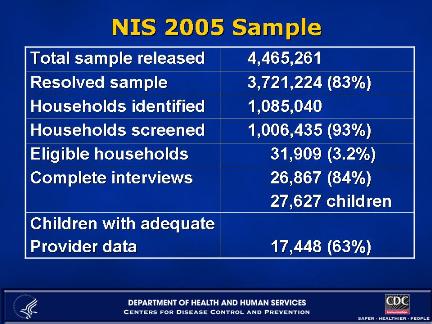
NIS 2005 Sample
Total sample released – 4,465,261
Resolved sample – 3,721,224 (83%)
Households identified – 1,085,040
Households screened – 1,006,435 (93%)
Eligible households – 31,909 (3.2%)
Complete interviews – 26,867 (84%) 27,627 children
Children with adequate Provider data – 17,448 (63%)
Slide 31
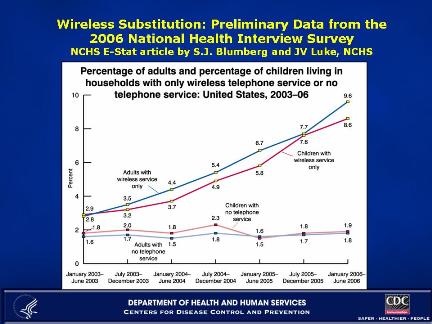
Wireless Substitution: Preliminary Data from the 2006 National Health Interview Survey
Slide 32
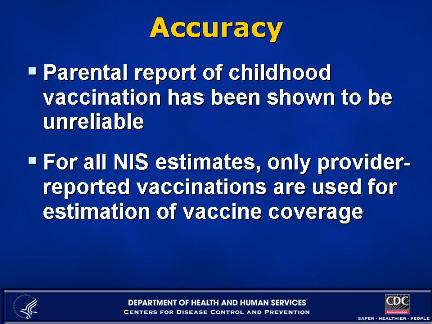
Accuracy
- Parental report of childhood vaccination has been shown to be unreliable
- For all NIS estimates, only provider-reported vaccinations are used for estimation of vaccine coverage
Slide 33
Slide 34
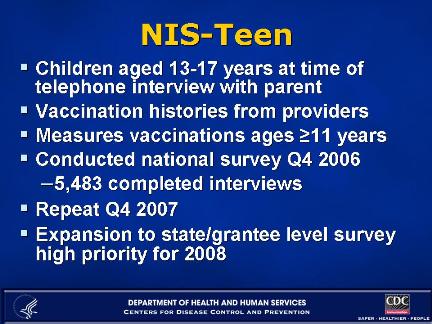
NIS-Teen
- Children aged 13-17 years at time of telephone interview with parent
- Vaccination histories from providers
- Measures vaccinations ages > = 11 years
- Conducted national survey Q4 2006
- 5,483 completed interviews
- Repeat Q4 2007
- Expansion to state/grantee level survey high priority for 2008
Slide 35
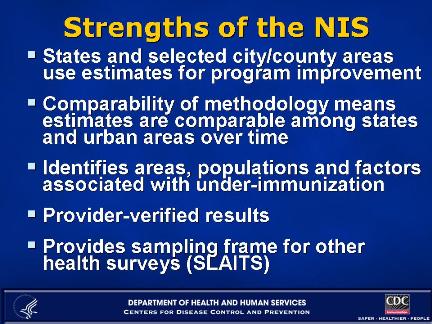
Strengths of the NIS
- States and selected city/county areas use estimates for program improvement
- Comparability of methodology means estimates are comparable among states and urban areas over time
- Identifies areas, populations and factors associated with under-immunization
- Provider-verified results
- Provides sampling frame for other health surveys (SLAITS)
Slide 36
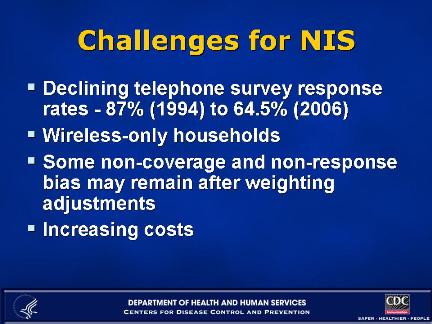
Challenges for NIS
- Declining telephone survey response rates – 87% (1994) to 64.5% (2006)
- Wireless-only households
- Some non-coverage and non-response bias may remain after weighting adjustments
- Increasing costs
Slide 37
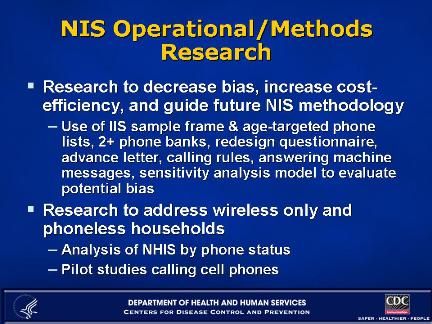
NIS Operational/Methods Research
- Research to decrease bias, increase cost-efficiency, and guide future NIS methodology
- Use of IIS sample frame & age-targeted phone lists, 2+ phone banks, redesign questionnaire, advance letter, calling rules, answering machine messages, sensitivity analysis model to evaluate potential bias
- Research to address wireless only and phoneless households
- Analysis of NHIS by phone status
- Pilot studies calling cell phones
Slide 38
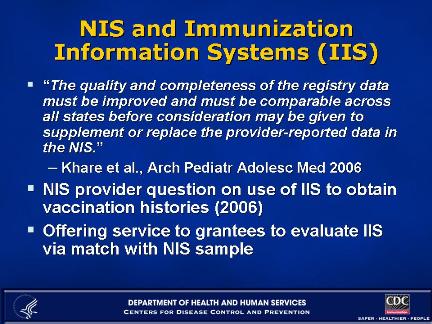
NIS and Immunization Information Systems (IIS)
- “The quality and completeness of the registry data must be improved and must be comparable across all states before consideration may be given to supplement or replace the provider-reported data in the NIS.”
– Khare et al., Arch Pediatr Adolesc Med 2006 - NIS provider question on use of IIS to obtain vaccination histories (2006)
- Offering service to grantees to evaluate IIS via match with NIS sample
Slide 39
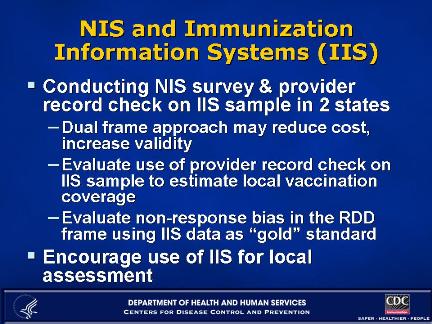
NIS and Immunization Information Systems (IIS)
- Conducting NIS survey & provider record check on IIS sample in 2 states
- Dual frame approach may reduce cost, increase validity
- Evaluate use of provider record check on IIS sample to estimate local vaccination coverage
- Evaluate non-response bias in the RDD frame using IIS data as “gold” standard
- Encourage use of IIS for local assessment
Slide 40
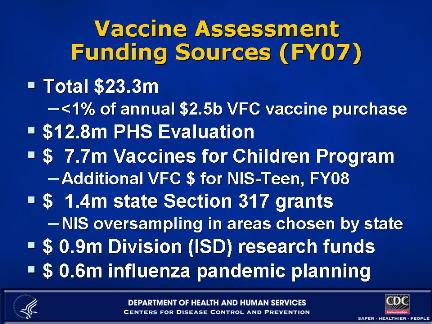
Vaccine Assessment Funding Sources (FY07)
- Total $23.3m
- < 1% of annual $2.5b VFC vaccine purchase
- $12.8m PHS Evaluation
- $ 7.7m Vaccines for Children Program
- Additional VFC $ for NIS-Teen, FY08
- $ 1.4m state Section 317 grants
- NIS oversampling in areas chosen by state
- $ 0.9m Division (ISD) research funds
- $ 0.6m influenza pandemic planning
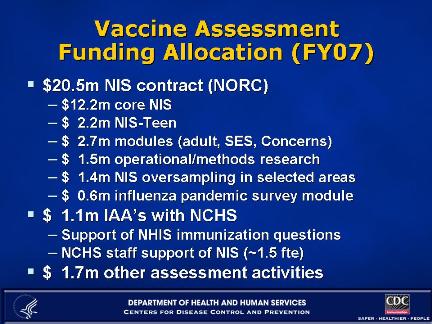
Slide 41
Vaccine Assessment Funding Allocation (FY07)
- $20.5m NIS contract (NORC)
- $12.2m core NIS
- $ 2.2m NIS-Teen
- $ 2.7m modules (adult, SES, Concerns)
- $ 1.5m operational/methods research
- $ 1.4m NIS oversampling in selected areas
- $ 0.6m influenza pandemic survey module
- $ 1.1m IAA’s with NCHS
- Support of NHIS immunization questions
- NCHS staff support of NIS (~1.5 fte)
- $ 1.7m other assessment activities
Slide 42
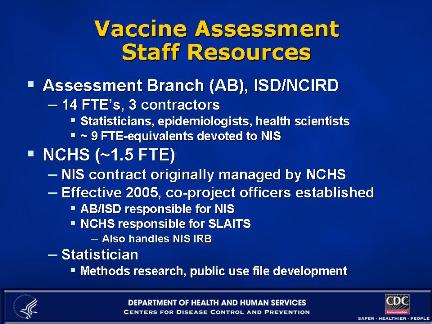
Vaccine Assessment Staff Resources
- Assessment Branch (AB), ISD/NCIRD
- 14 FTE’s, 3 contractors
- Statisticians, epidemiologists, health scientists
- ~ 9 FTE-equivalents devoted to NIS
- 14 FTE’s, 3 contractors
- NCHS (~1.5 FTE)
- NIS contract originally managed by NCHS
- Effective 2005, co-project officers established
- AB/ISD responsible for NIS
- NCHS responsible for SLAITS
- Also handles NIS IRB
- Statistician
- Methods research, public use file development
Slide 43
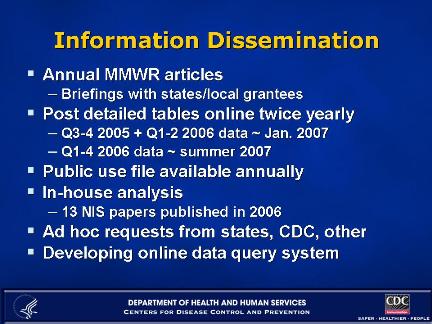
Information Dissemination
- Annual MMWR articles
- Briefings with states/local grantees
- Post detailed tables online twice yearly
- Q3-4 2005 + Q1-2 2006 data ~ Jan. 2007
- Q1-4 2006 data ~ summer 2007
- Public use file available annually
- In-house analysis
- 13 NIS papers published in 2006
- Ad hoc requests from states, CDC, other
- Developing online data query system
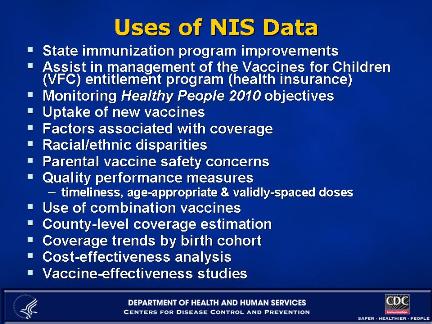
Slide 44
Uses of NIS Data
- State immunization program improvements
- Assist in management of the Vaccines for Children (VFC) entitlement program (health insurance)
- Monitoring Healthy People 2010 objectives
- Uptake of new vaccines
- Factors associated with coverage
- Racial/ethnic disparities
- Parental vaccine safety concerns
- Quality performance measures
- timeliness, age-appropriate & validly-spaced doses
- Use of combination vaccines
- County-level coverage estimation
- Coverage trends by birth cohort
- Cost-effectiveness analysis
- Vaccine-effectiveness studies
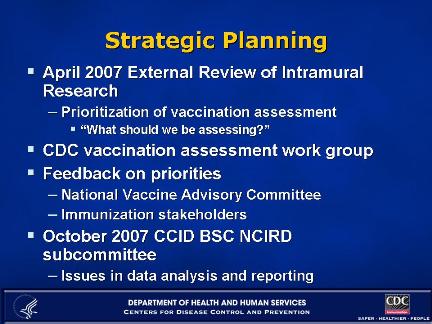
Slide 45
Strategic Planning
- April 2007 External Review of Intramural Research
- Prioritization of vaccination assessment
- “What should we be assessing?”
- Prioritization of vaccination assessment
- CDC vaccination assessment work group
- Feedback on priorities
- National Vaccine Advisory Committee
- Immunization stakeholders
- October 2007 CCID BSC NCIRD subcommittee
- Issues in data analysis and reporting
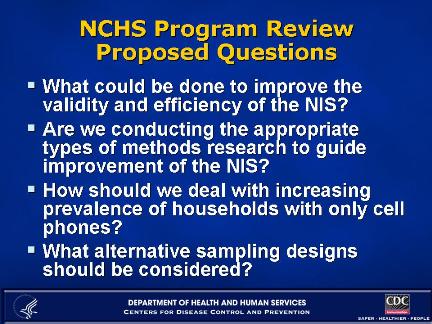
Slide 46
NCHS Program Review Proposed Questions
- What could be done to improve the validity and efficiency of the NIS?
- Are we conducting the appropriate types of methods research to guide improvement of the NIS?
- How should we deal with increasing prevalence of households with only cell phones?
- What alternative sampling designs should be considered?
Slide 47
Additional Slides
Slide 48
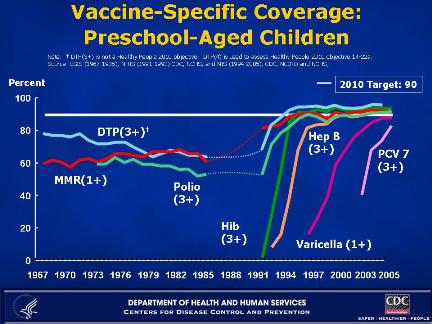
Vaccine-Specific Coverage: Preschool-Aged Children
Slide 49
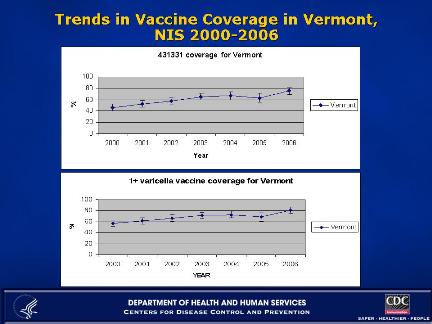
Trends in Vaccine Coverage in Vermont, NIS 2000-2006
Slide 50
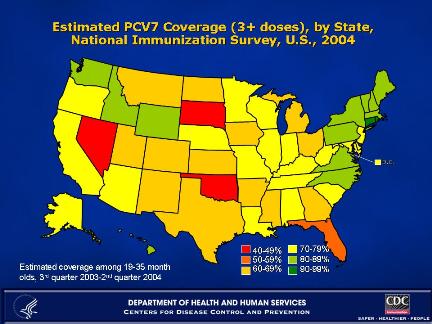
Estimated PCV7 Coverage (3+ doses), by State, National Immunization Survey, U.S., 2004
Slide 51
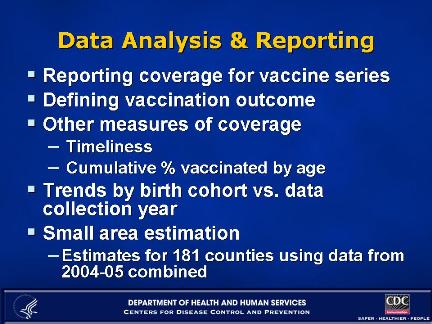
Data Analysis & Reporting
- Reporting coverage for vaccine series
- Defining vaccination outcome
- Other measures of coverage
- Timeliness
- Cumulative % vaccinated by age
- Trends by birth cohort vs. data collection year
- Small area estimation
- Estimates for 181 counties using data from 2004-05 combined