1 in 5 people in the U.S. have a sexually transmitted infection
January 25, 2021 – 2018 data provide clearest picture to date of how costly and common STIs are in the U.S.
New data published by the CDC estimate that on any given day in 2018, 1 in 5 people in the U.S. had a sexually transmitted infection (STI). CDC analyses, published in the journal Sexually Transmitted Diseases, show the burden of diagnosed and undiagnosed STIs in the U.S., and the estimated medical costs associated with STIs.
Graphics:
These high-resolution, public domain images are ready to download and print in your publication. Click on a graphic to see it in high-resolution. These images are in the public domain and are thus free of any copyright restrictions. As a matter of courtesy, we ask that the content provider be credited and notified of any public or private usage of an image.

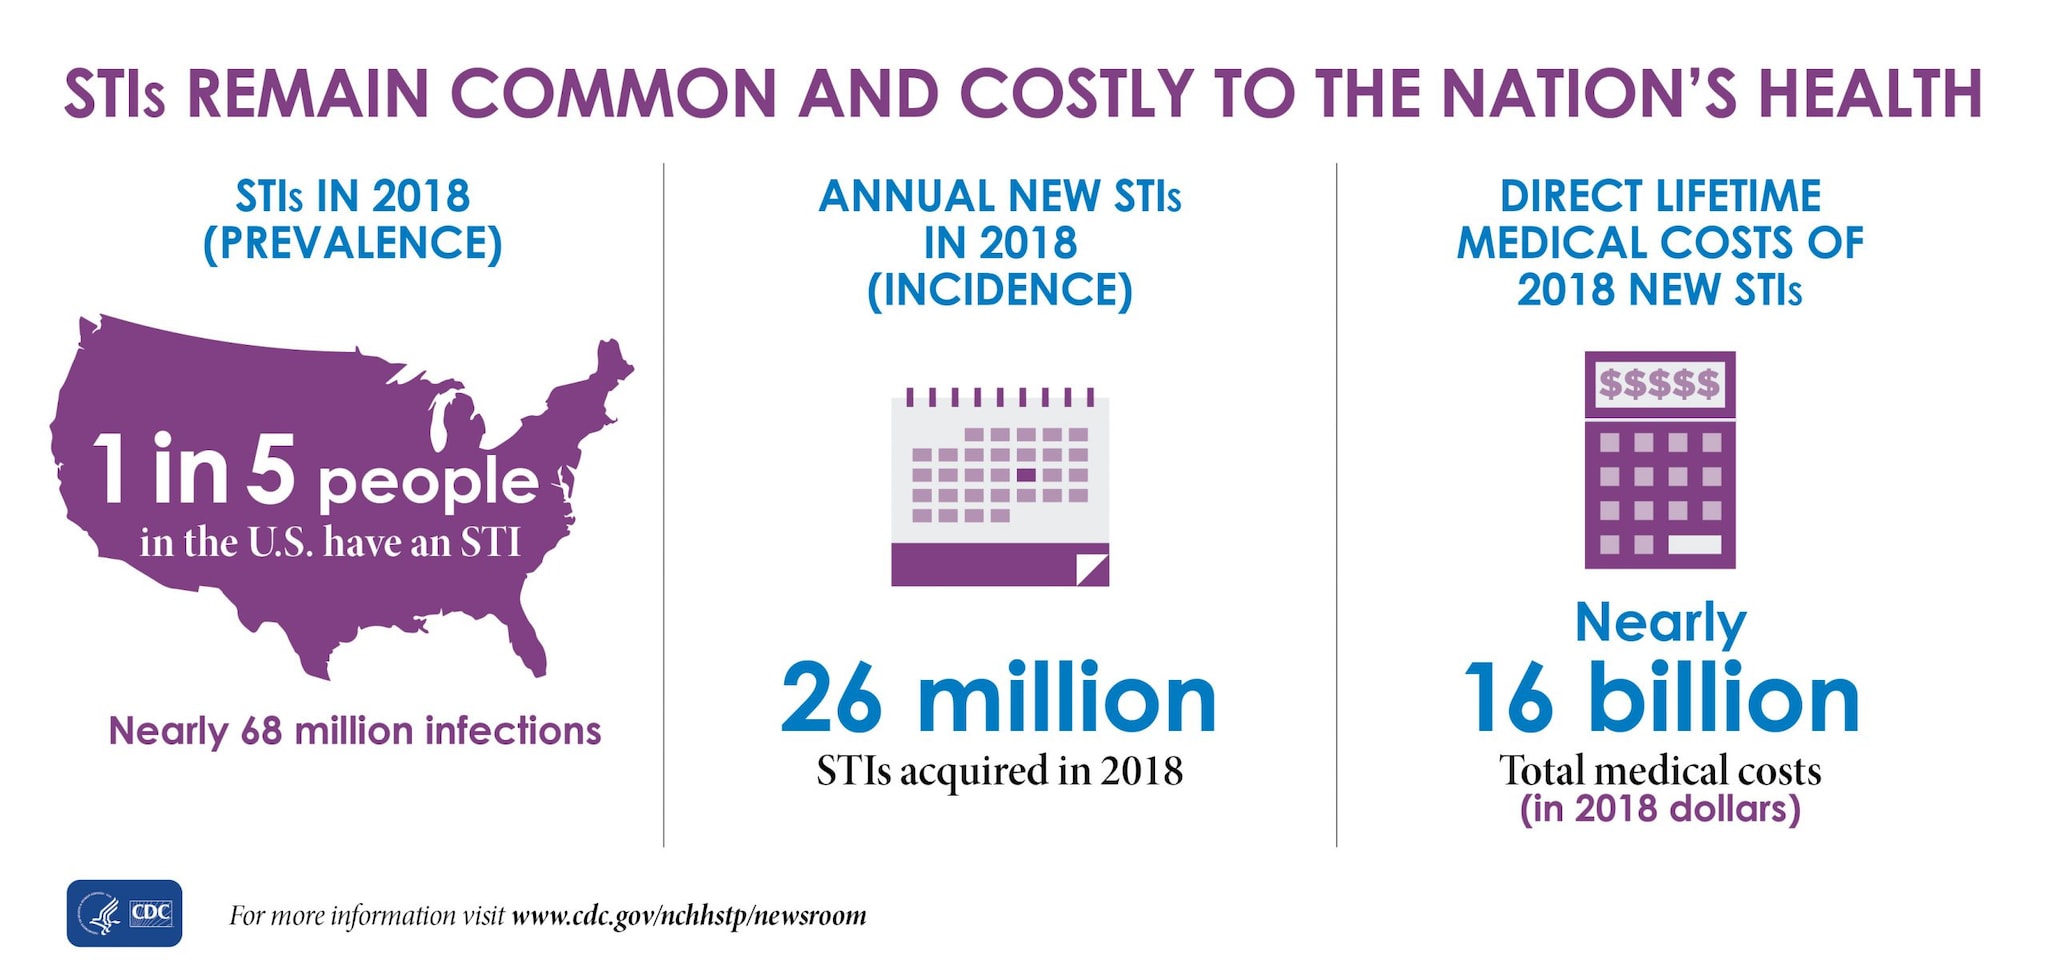
The graphic shows there were nearly 68 million infections in 2018 (prevalence), and that 1 in 5 people in the U.S. have an STI.
The graphic also shows that there were 26 million STIs acquired in 2018 (incidence).
And, the graphic shows that the direct lifetime medical costs of new STIs in 2018 totaled nearly $16 billion (in 2018 dollars).
")
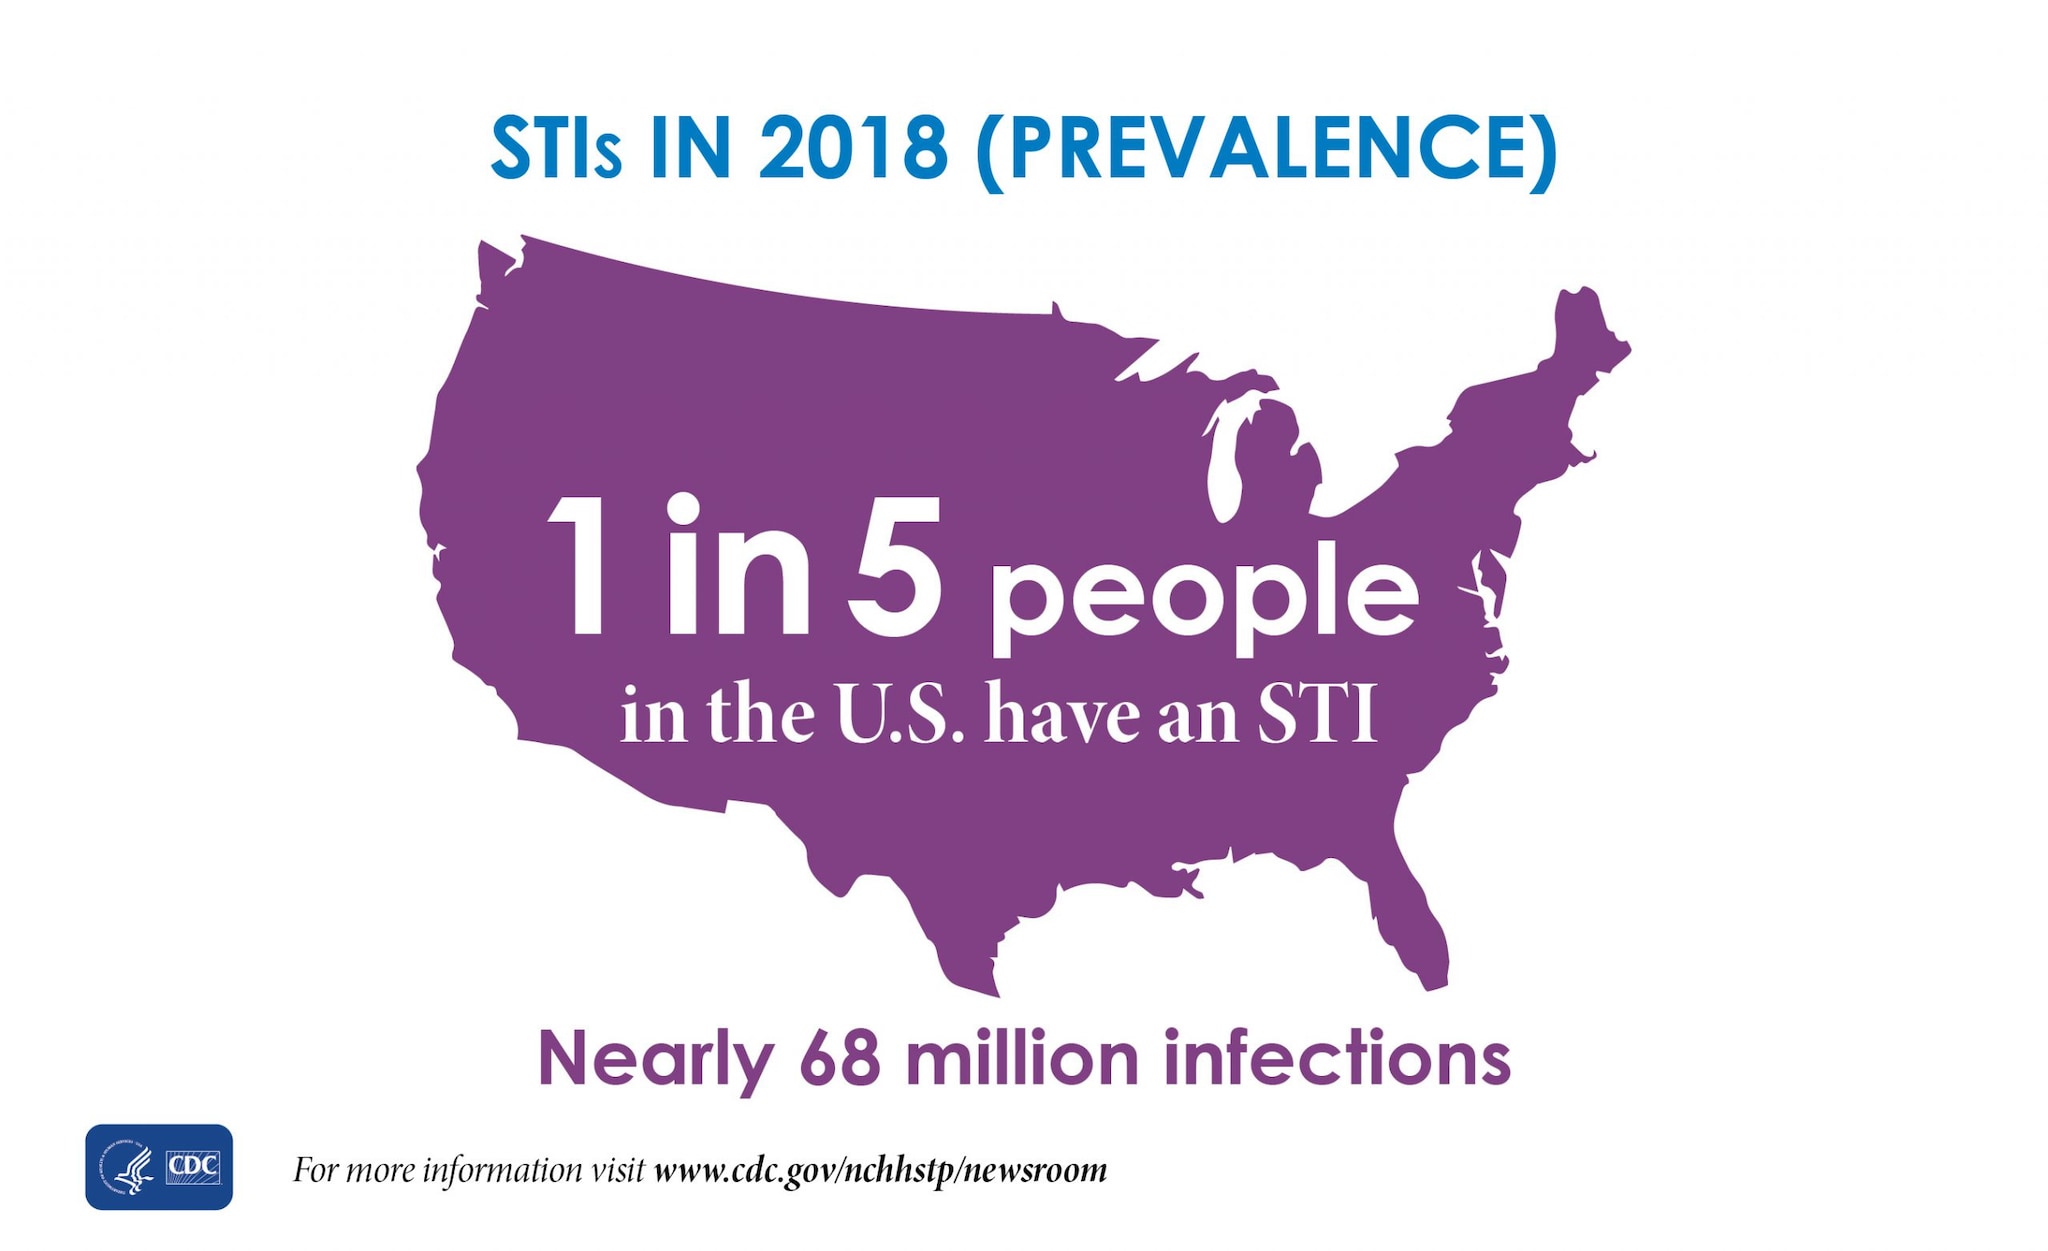
The graphic shows there were nearly 68 million infections in 2018 (prevalence), and that 1 in 5 people in the U.S. have an STI.


This bar graph shows the estimated number of new (incident) and existing (prevalent) sexually transmitted infections in 2018.
This graph shows there were 42.5 million prevalent and 13 million incident HPV infections; 18.6 million prevalent and 572,000 incident HSV-2 infections; 2.6 million prevalent and 6.9 incident trichomoniasis infections; 2.4 million prevalent and 4 million incident chlamydia infections; 209,000 prevalent and 1.6 million incident gonorrhea infections; 984,000 prevalent and 32,600 incident HIV infections in people ages 13 and older; 103,000 prevalent and 8,300 incident HBV infections; and 156,000 prevalent and 146,000 incident syphilis infections.
This graph notes that HIV data was collected from the National HIV Surveillance System and includes HIV infections for persons aged 13 and older. HIV and HBV data represent only sexually acquired infections.

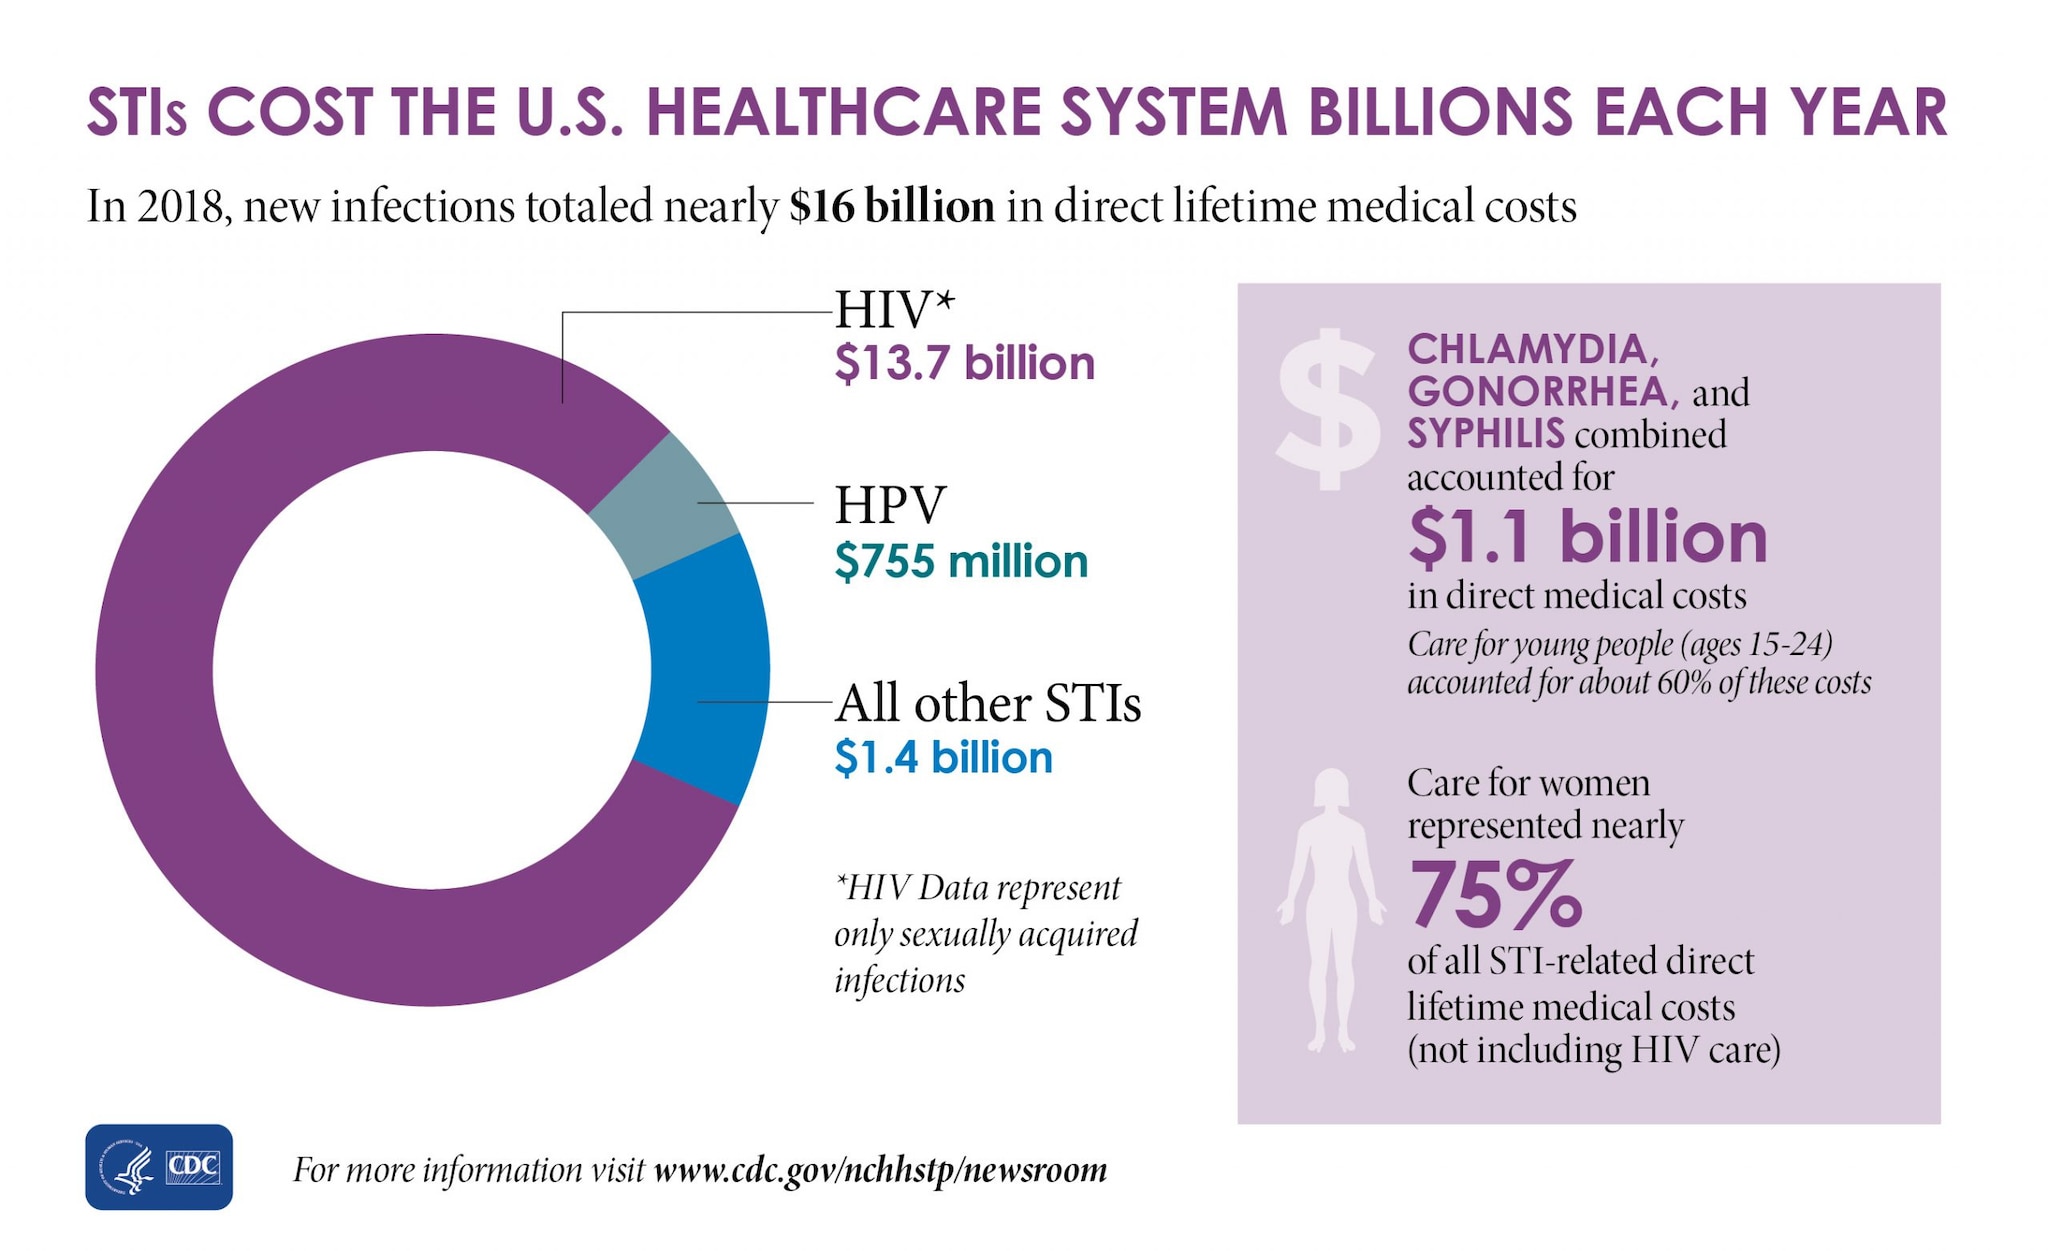
This graphic shows that in 2018, new HIV infections cost $13.7 billion in direct lifetime medical costs, new HPV infections cost $755 million in direct lifetime medical costs, and all other STIs cost $1.4 billion in direct lifetime medical costs.
This graphic shows that chlamydia, gonorrhea, and syphilis combined accounted for $1.1 billion in direct medical costs, and that care for young people (ages 15-24) accounted for about 60% of these costs.
This graphic shows that care for women represented nearly 75% of all STI-related direct lifetime medical costs (not including HIV care).
This graphic shows that HIV data represent only sexually acquired infections.

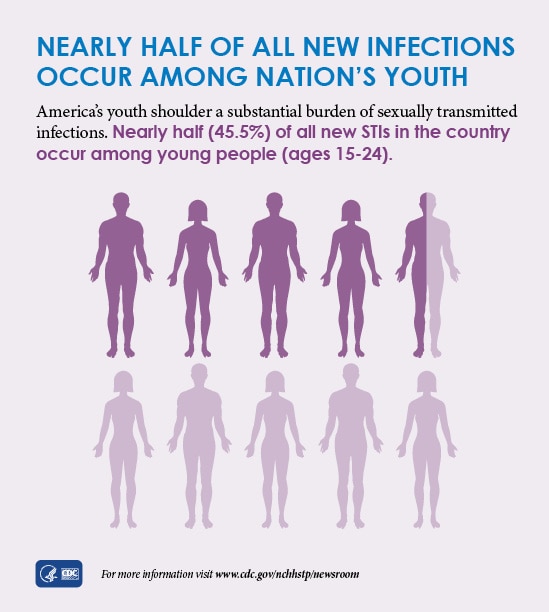
This graphic shows latest CDC data indicate that nearly half of all new STI infections occur among nation’s youth, with 45.5% of all new STIs were among young people ages 15-24 in 2018.