International AIDS Conference 2014 - Youth Risk Behavior Survey
July 17, 2014 – International AIDS Conference 2014
The 20th International AIDS Conference, in Melbourne, Australia, will take place July 20-July 25. This conference is the premier gathering for those working in the field of HIV, as well as policy makers, persons living with HIV and other individuals committed to ending the pandemic. It is a chance to assess where we are, evaluate recent scientific developments and lessons learned, and collectively chart a course forward.
For your coverage of the conference, please find below materials on key CDC conference presentations, including the latest data on HIV- and STD-related sexual risk behaviors among U.S. high school students.
- Press Release: Progress on sexual risk behaviors among students differs by race and gender
- Fact Sheet: Sexual Risk Behaviors among U.S. High School StudentsCdc-pdf
Graphics: Trends Among High School Students from CDC’s National Youth Risk Behavior Survey (YRBS), 1991-2013
The following images and graphics highlight major findings from the report. These high-resolution, public domain images are ready to download and print in your publication. Click on a graphic to see it in high-resolution.
These images are in the public domain and are thus free of any copyright restrictions. As a matter of courtesy, we ask that the content provider be credited and notified of any public or private usage of an image.
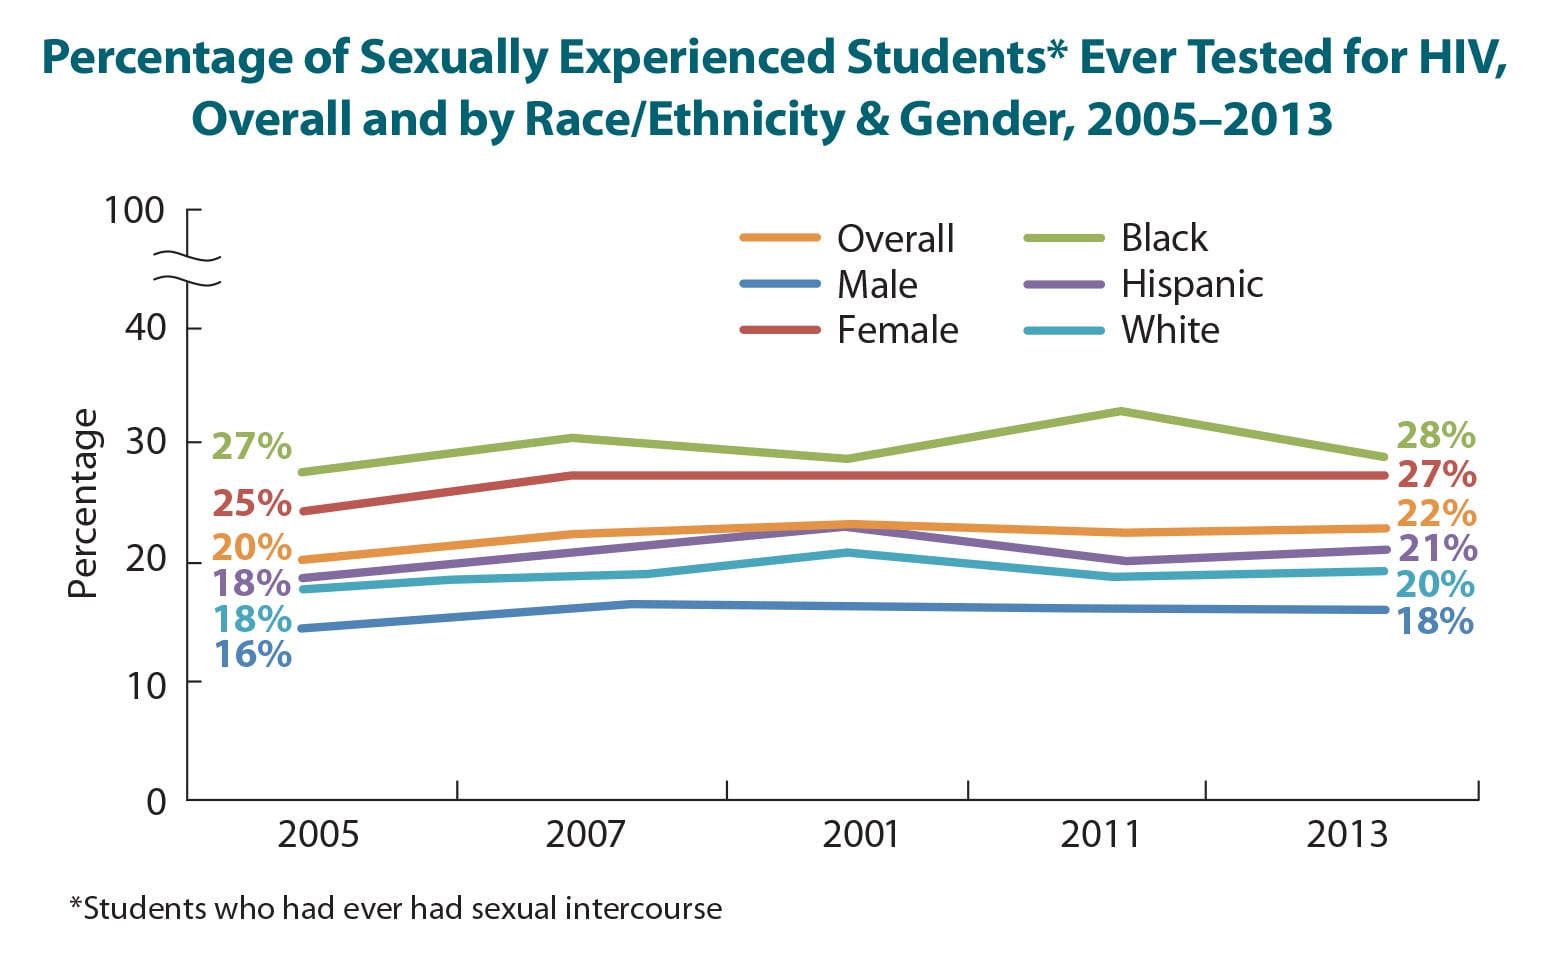 Percentage of Sexually Experienced Students Ever Tested for HIV, Overall and by Race/Ethnicity & Gender, 2005–2013
View High Resolution Version
HIV testing remains low among sexually experienced youth. Overall, the percentage of sexually experienced students who had been tested for HIV has remained unchanged for eight years – (22 percent in 2013).
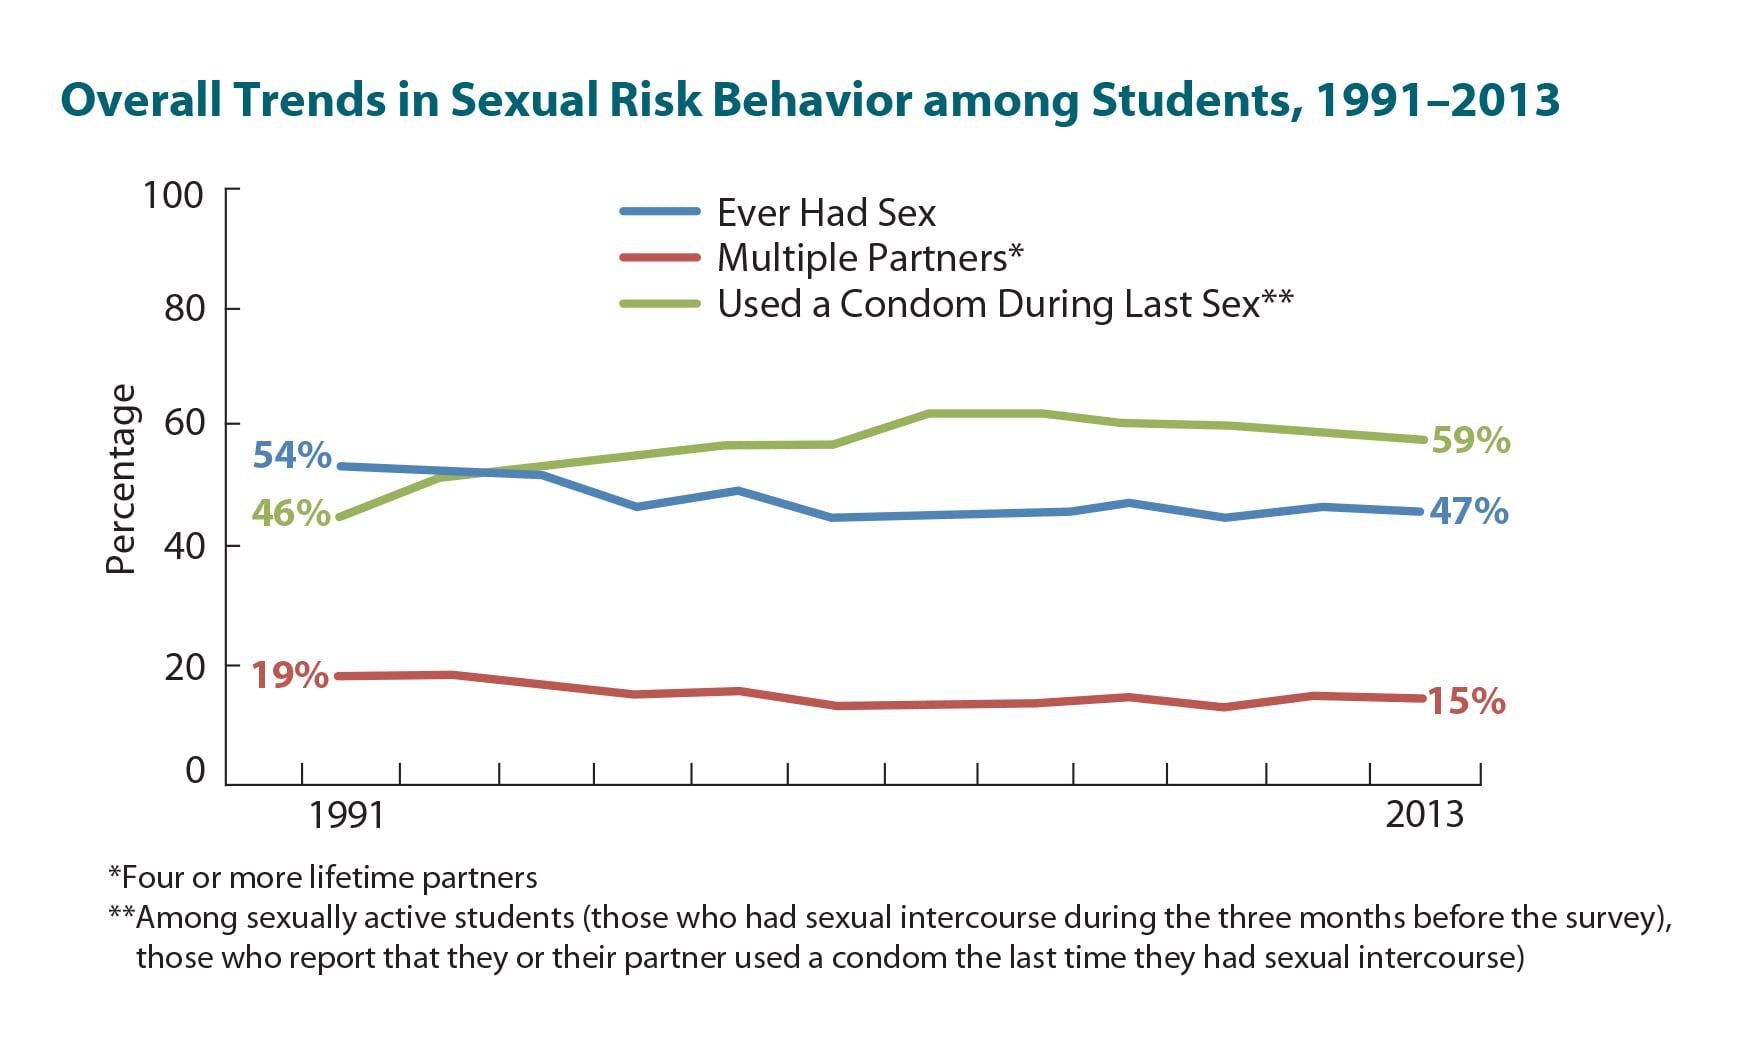 Overall Trends in Sexual Risk Behavior, 1991-2013
View High Resolution Version
Overall progress in sexual risk behavior has stalled. After initial declines in sexual risk behaviors among high school students overall through the early 2000s, the number who ever had sex and who had multiple partners has remained stable in recent years. Condom use among sexually active students has decreased in recent years.
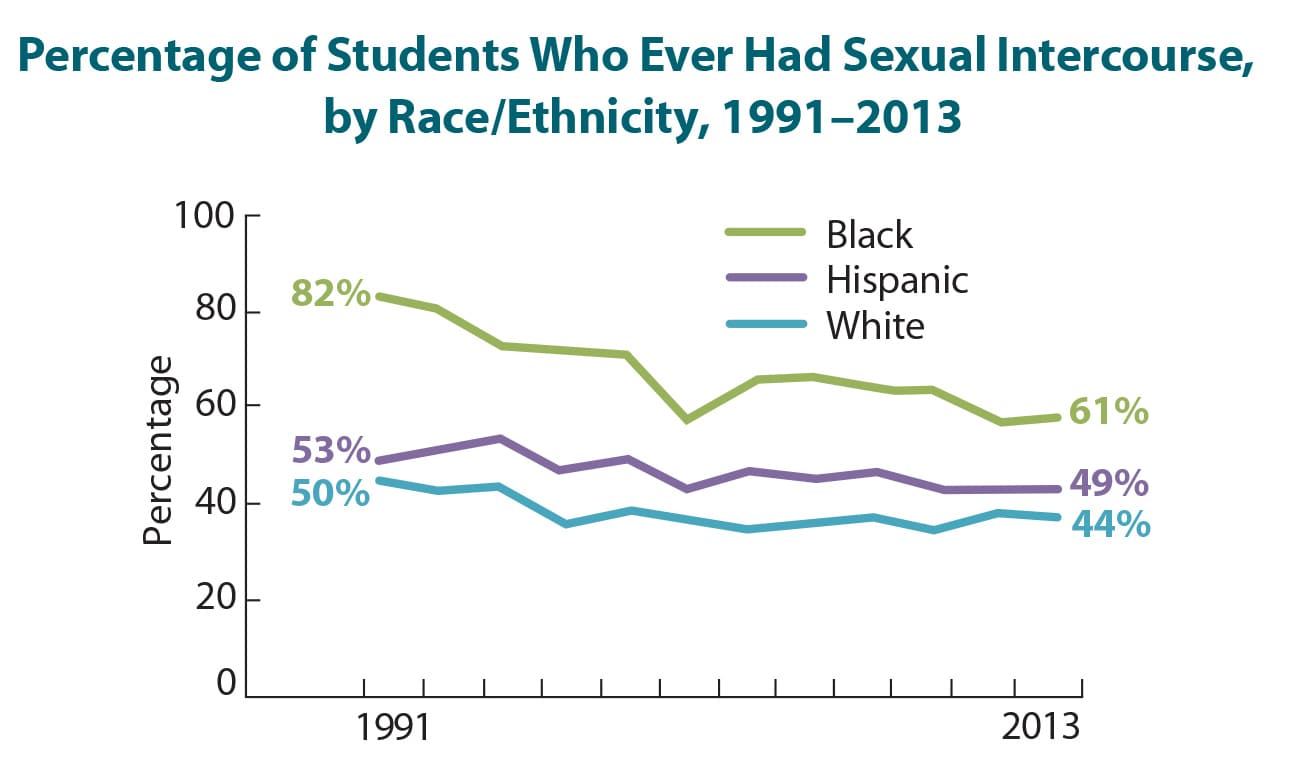 Percentage of Students Who Ever Had Sexual Intercourse, by Race/Ethnicity, 1991–2013
View High Resolution Version
YRBS data indicate progress in sexual risk behaviors differs by race/ethnicity. Data indicate declines throughout the period of analysis in the percentage of black, and Hispanic students who ever had sexual intercourse, but stability in recent years among white students.
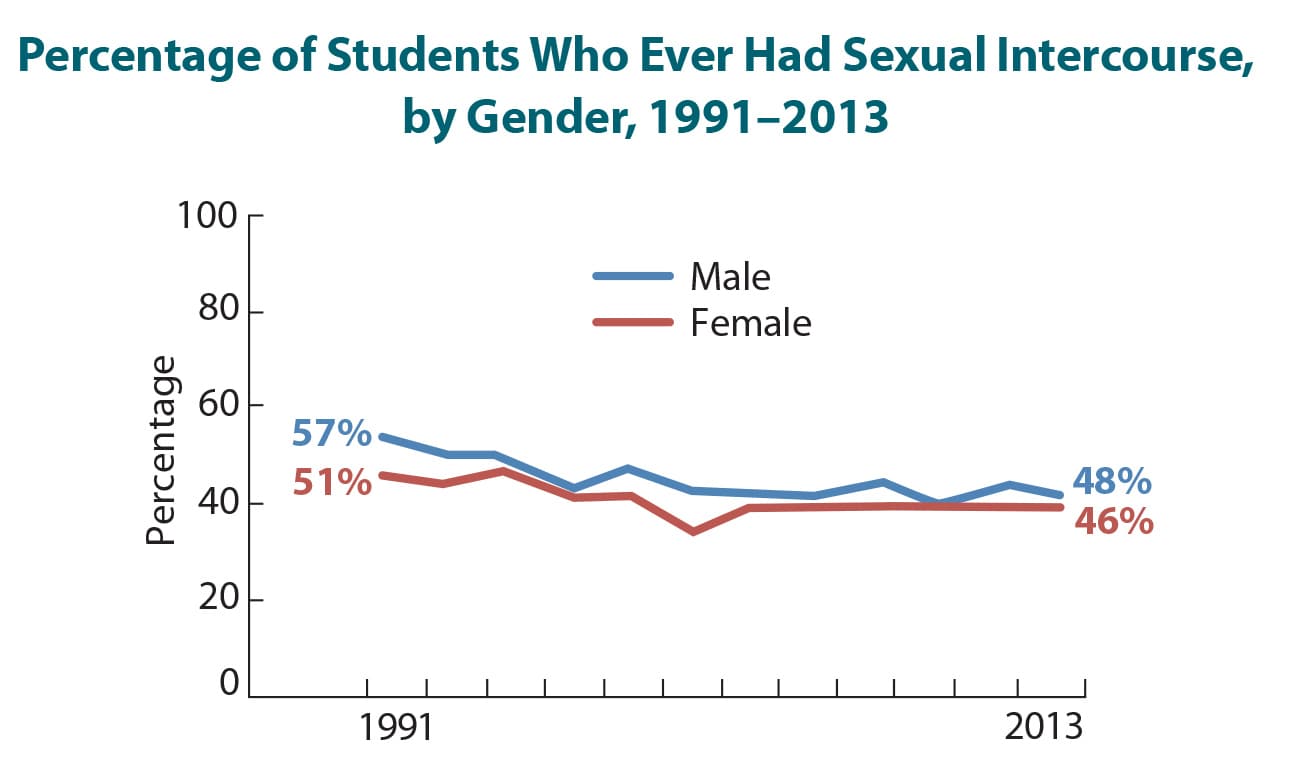 Percentage of Students Who Ever Had Sexual Intercourse, by Gender, 1991–2013
View High Resolution Version
Again, YRBS data indicate progress in sexual risk behaviors differs by gender. Data indicate declines throughout the period of analysis in the percentage of female students who ever had sexual intercourse, but stability in recent years among male students.
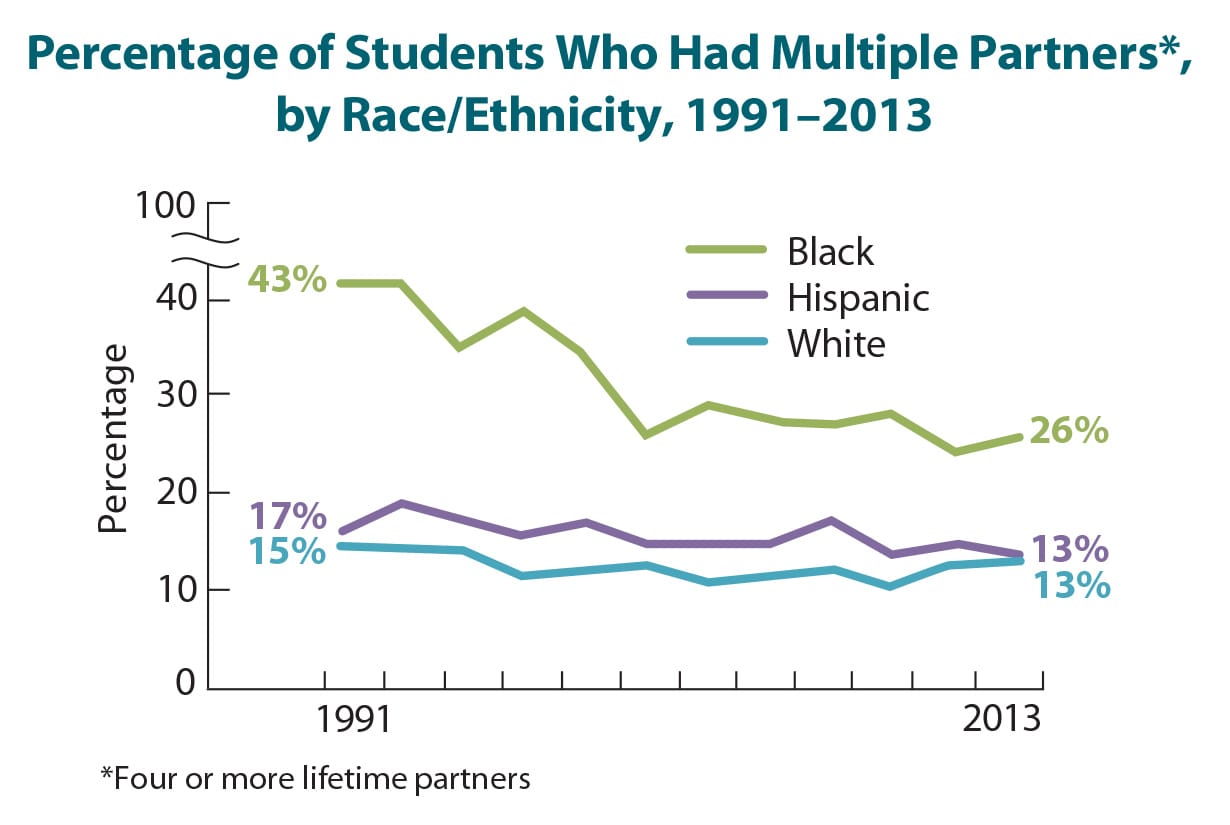 Percentage of Students Who Had Multiple Partners, by Race/Ethnicity, 1991–2013
View High Resolution Version
Data indicate declines throughout the period of analysis in the percentage of black, and Hispanic students who had multiple partners, but concerning increases among white students.
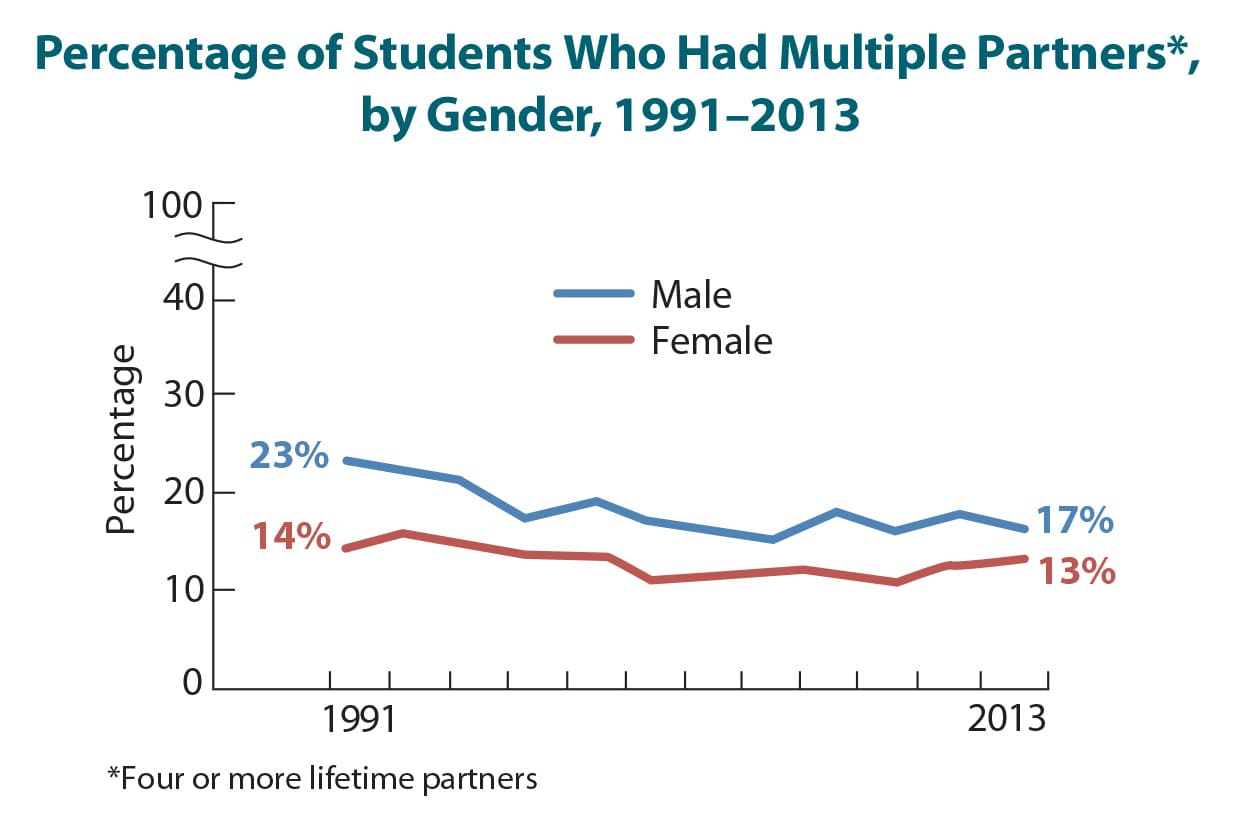 Percentage of Students Who Had Multiple Partners, by Gender, 1991–2013
View High Resolution Version
Additional data indicate declines throughout the period of analysis in the percentage of female students who had multiple partners, but stability in recent years among male students.
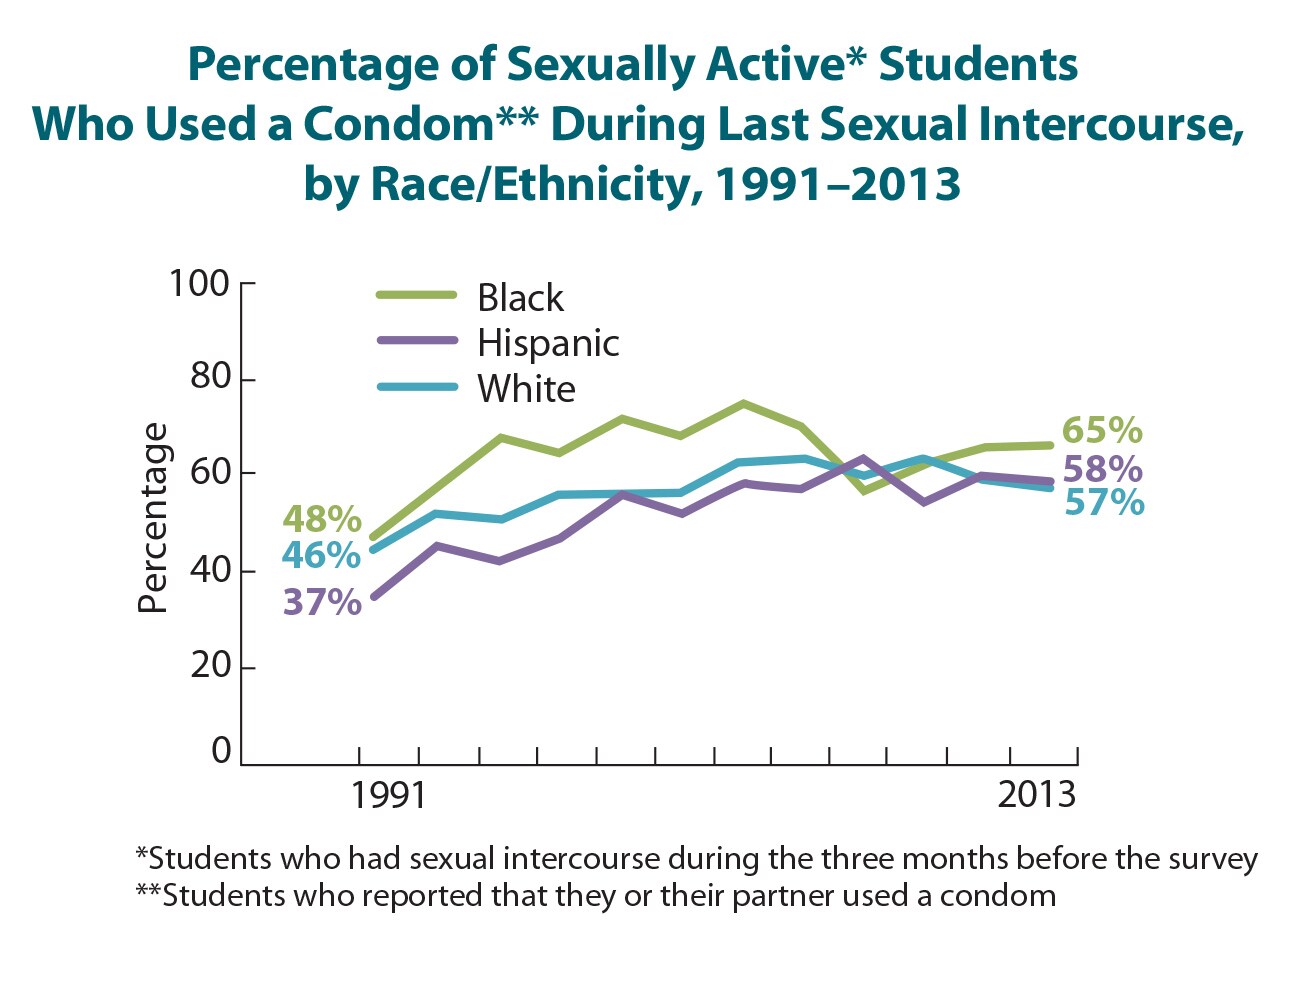 Percentage of Sexually Active Students Who Used a Condom During Last Sexual Intercourse, by Race/Ethnicity, 1991–2013
View High Resolution Version
Data indicate stability in recent years in the percentage of sexually active Hispanic, and white students who used a condom the last time they had sexual intercourse, but concerning declines in condom use among black students.
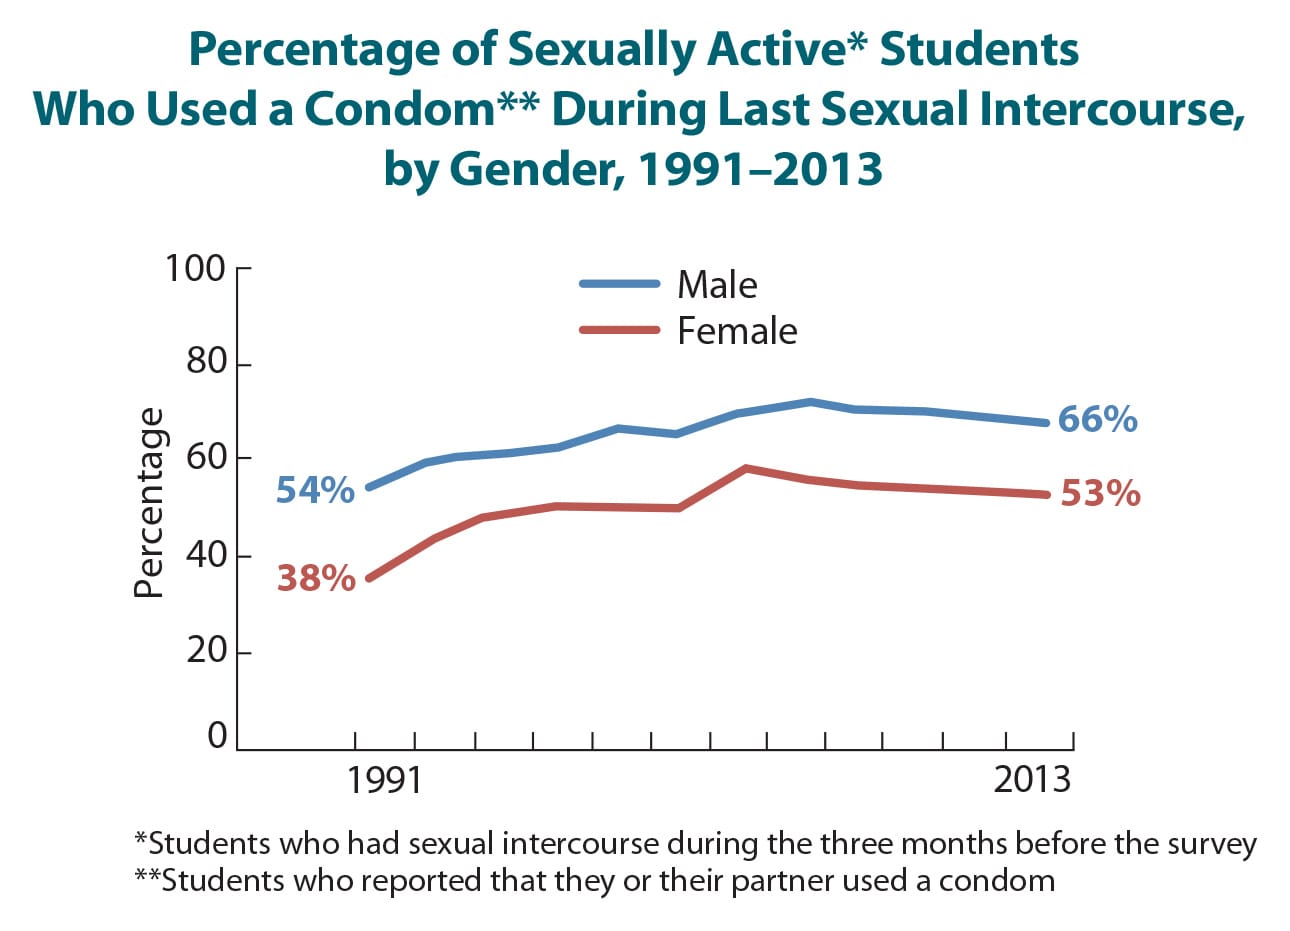 Percentage of Sexually Active Students Who Used a Condom During Last Sexual Intercourse, by Gender, 1991–2013
View High Resolution Version
Data indicate stability in recent years in the percentage of sexually active male students who used a condom the last time they had sexual intercourse, but concerning declines in condom use among female students.
###