World AIDS Day 2011
High-resolution, downloadable graphics
Click on a graphic to see it in high-resolution.
Images and graphics highlighting the most current new HIV infection data among men who have sex with men (MSM) are available for download. These high-resolution, public domain images are ready to print in your publication.
These images are in the public domain and are thus free of any copyright restrictions. As a matter of courtesy, we request that the content provider be credited and notified of any public or private usage of an image.

African American and Gay and Bisexual Related Graphics
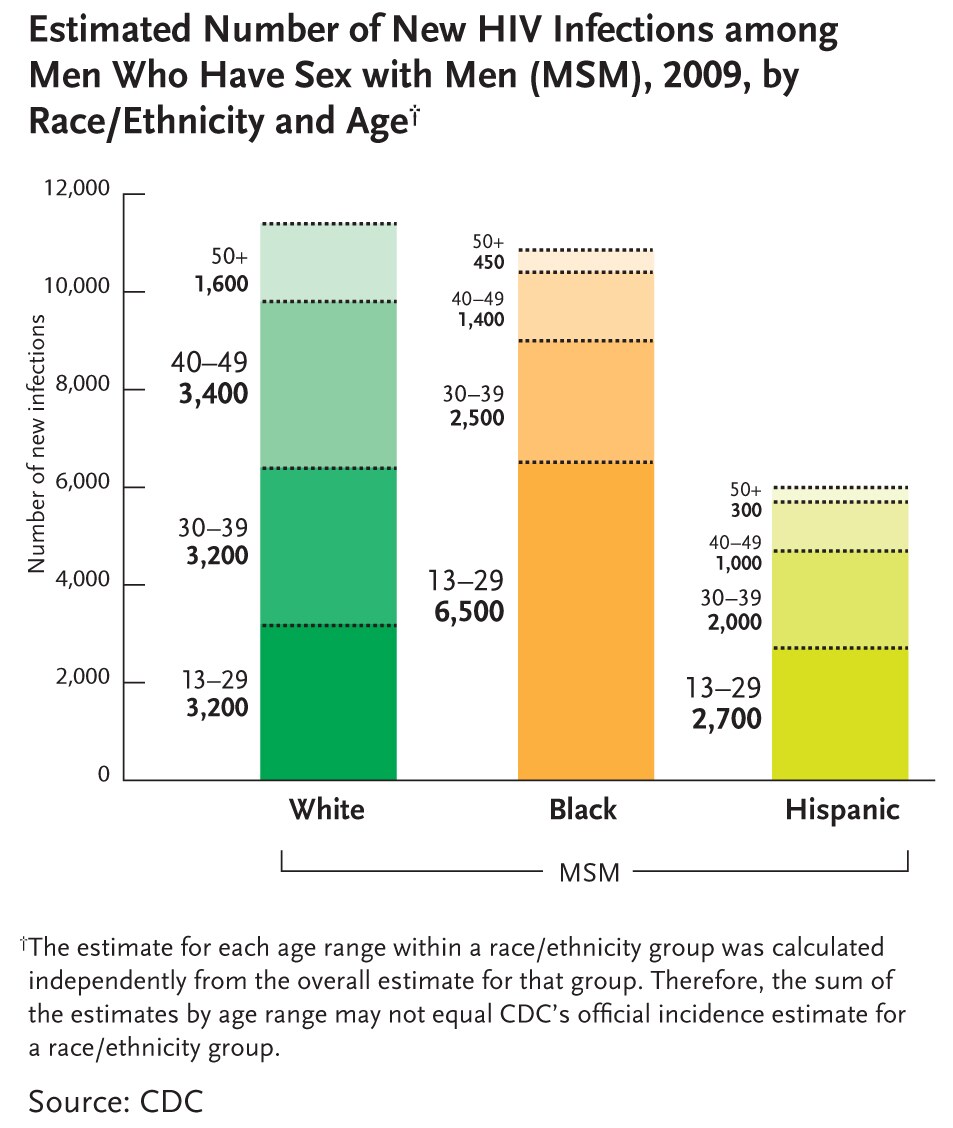
Estimated Number of New HIV Infections among Men Who Have Sex with Men (MSM), 2009, by Race/Ethnicity and Age
View High Resolution Versionimage icon
This chart breaks down the number of new HIV infections among men who have sex with men in the U.S. in 2009 by race/ethnicity and age, showing: among white men who have sex with men, most new infections occurred among those aged 40-49 (3,400 new infections), followed by those aged 13-29 and 30-29 (3,200 each). 1,600 infections occurred among white men who have sex with men aged 50+. Among black men who have sex with men, most new infections occurred among those aged 13-29 (6,500), followed by those aged 30-39 (2,500), then those aged 40-49 (1,400). 450 new infections occurred among black men who have sex with men aged 50+. Among Hispanic men who have sex with men, most new infections occurred among those aged 13-29 (2,700), followed by those aged 30-39 (2,000) and those aged 40-49 (1,000). 300 new infections occurred among Hispanic men who have sex with men aged 50+. (Note: The estimate for each age range within a race/ethnicity group was calculated independently from the overall estimate for that group. Therefore, the sum of the estimates by age range may not equal CDC’s official incidence estimate for a race/ethnicity group.)
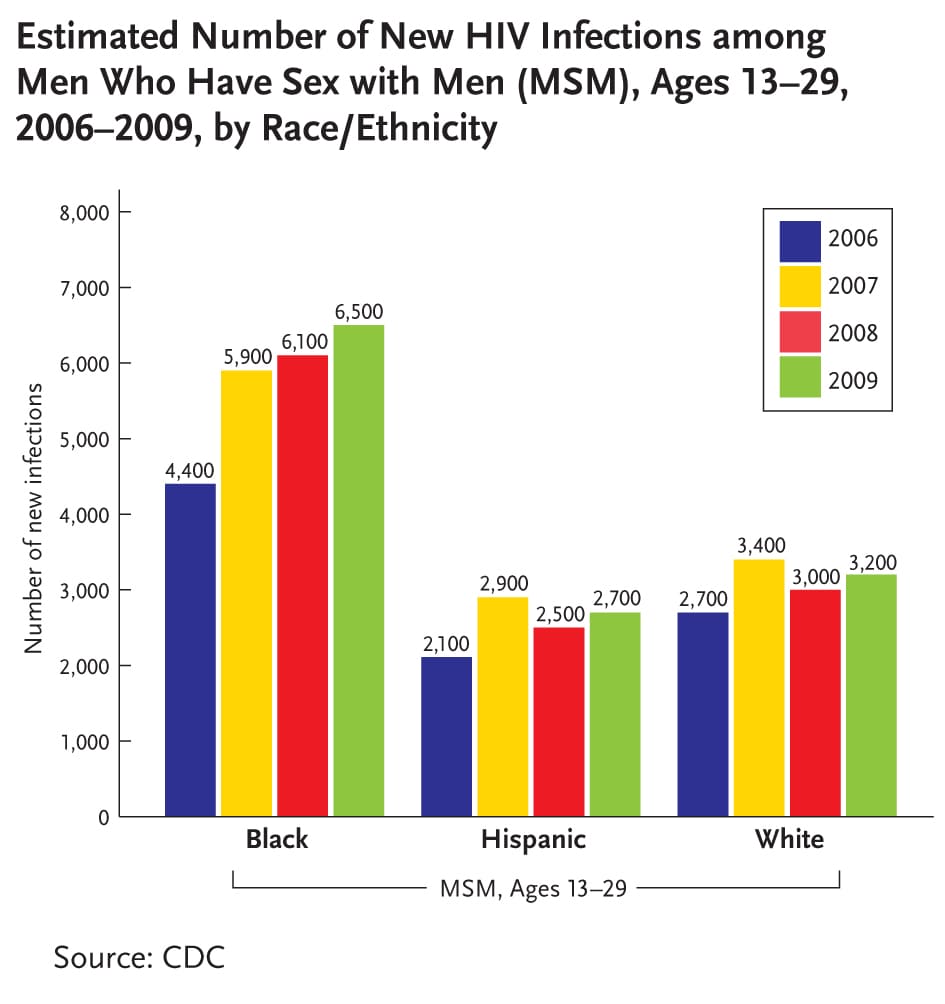
Estimated Number of New HIV Infections among Men Who Have Sex with Men (MSM), Ages 13-19, 2006-2009, by Race/Ethnicity
View High Resolution Versionimage icon
This bar chart shows the number of new infections among men who have sex with men aged 13-29 in the U.S. broken down by age and by year of infection between 2006 and 2009. In 2006, 4,400 new infections occurred among black men who have sex with men in this age group, 5,900 in 2007, 6,100 in 2008, and 6,500 in 2009. In 2006, 2,100 new infections occurred among Hispanic men who have sex with men in this age group, 2,900 in 2007, 2,500 in 2008, and 2,700 in 2009. In 2006, 2,700 new infections occurred among white men who have sex with men in this age group, 3,400 in 2007, 3,000 in 2008, and 3,200 in 2009.
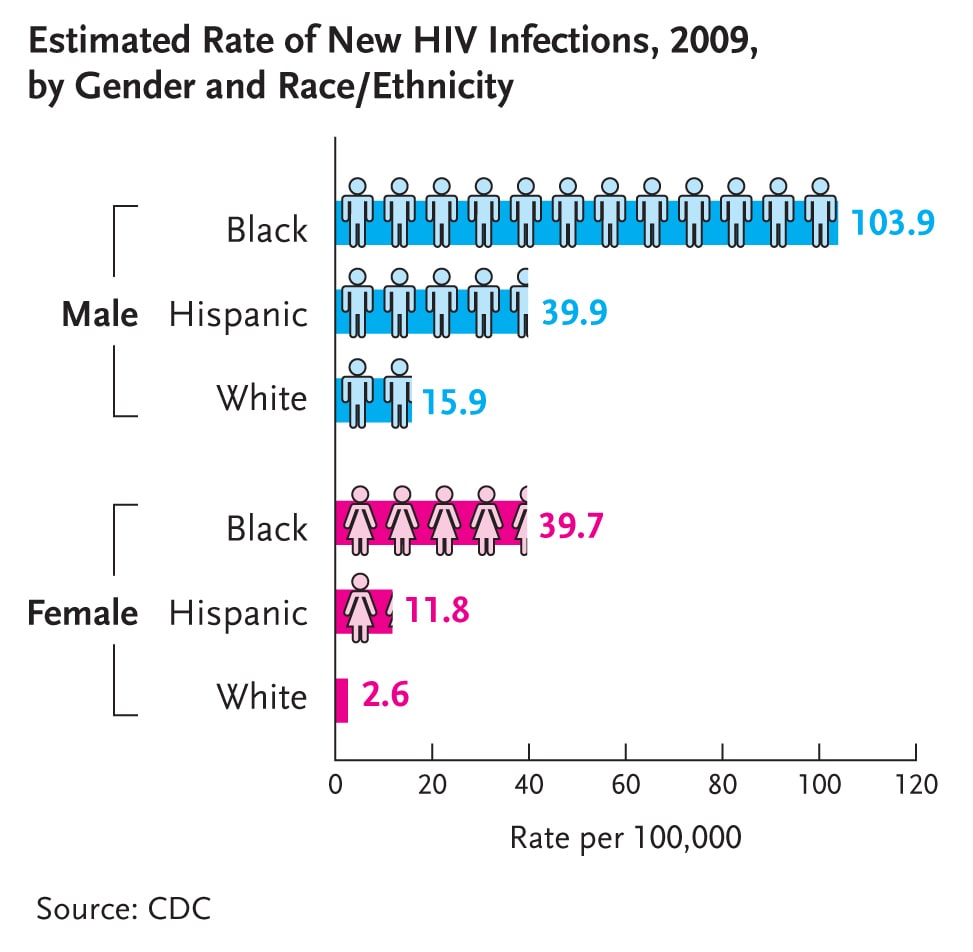
Estimated Rate of New HIV Infections, 2009, by Gender and Race/Ethnicity
View High Resolution Versionimage icon
This graph shows that in the US in 2009 the rate of new HIV infections among black males was 103.9 cases per 100,000 population, the rate for Hispanic males was 39.9 cases per 100,000 population, and the rate for white males was 15.9 cases per 100,000 population. The rate among black females was 39.7 cases per 100,000 population, the rate for Hispanic females was 11.8 cases per 100,000 population, and the rate among white women was 2.6 cases per 100,000 population.
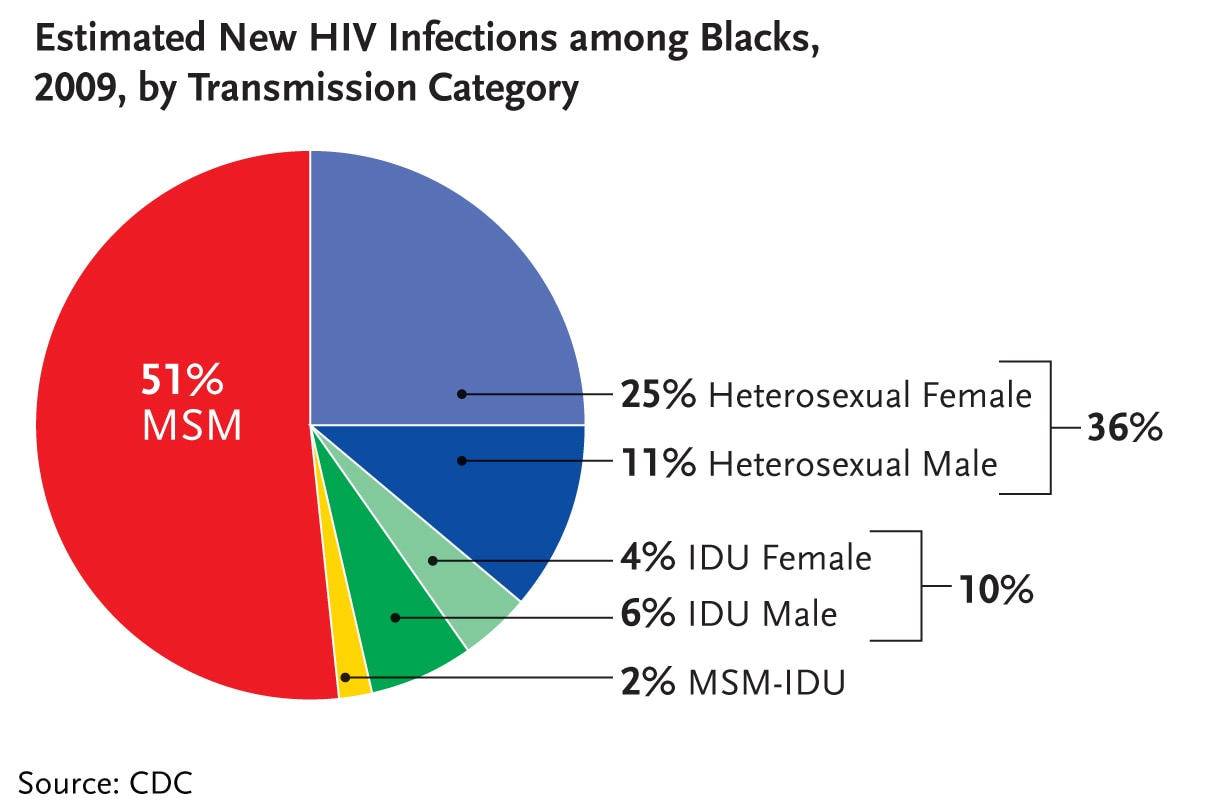
Estimated Number of New HIV Infections among Blacks, 2009, by Transmission Category
View High Resolution Versionimage icon
This pie chart shows the estimated new HIV infections among African Americans by transmission category for 2009. Men who have sex with men made up 51 percent of new HIV infections followed by heterosexuals who made up 36 percent of new HIV infections (25 percent for heterosexual females and 11 percent for heterosexual males), injection drug users who made up 10 percent of new HIV infections (4 percent for female IDU and 6 percent for male IDU), and MSM-IDU who made up 2 percent of new HIV infections.
Vital Signs
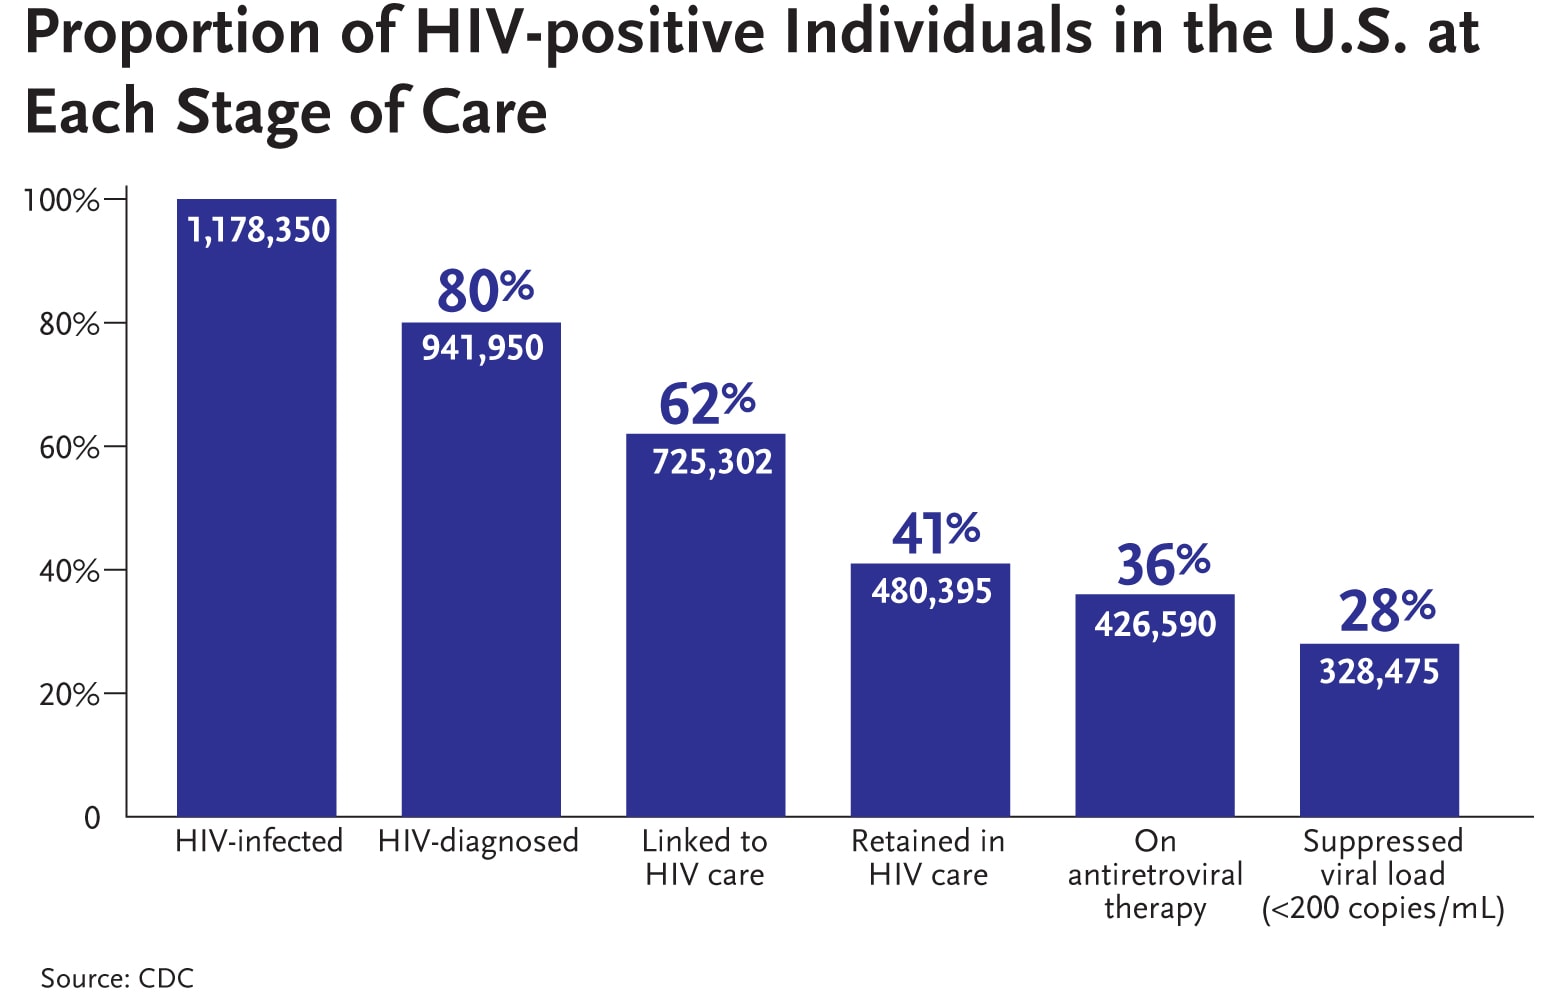
Proportion of HIV-positive individuals in the U.S. at each stage of care
View High Resolution Versionimage icon
This bar graph shows the proportion of HIV-positive individuals in the United States at each state of care. There are an estimated 1,178,350 HIV infected individuals in the U.S. Of those people 80 percent (941,950 people) have been HIV-diagnosed; 62 percent (725,302 people) have been linked to HIV care; 41 percent (480,395 people) have been retained in HIV care; 36 percent (426,590 people) are on Antiretroviral Therapy; and 28 percent (328,475 people) have a suppressed viral load.