30th Commemoration of HIV/AIDS
Historic picture of the U.S. HIV epidemic
This page offers a historic look at HIV in the U.S., using two important pieces of data: numbers of new HIV infections per year (also called HIV incidence) and the number of people living with HIV at a given point in time (also called HIV prevalence). (The most current year for which both of these data sets are available is 2006. For more information on each, please see our fact sheet outlining the 2006 HIV incidence estimatepdf icon and our fact sheet outlining the 2006 HIV prevalence estimatepdf icon.)
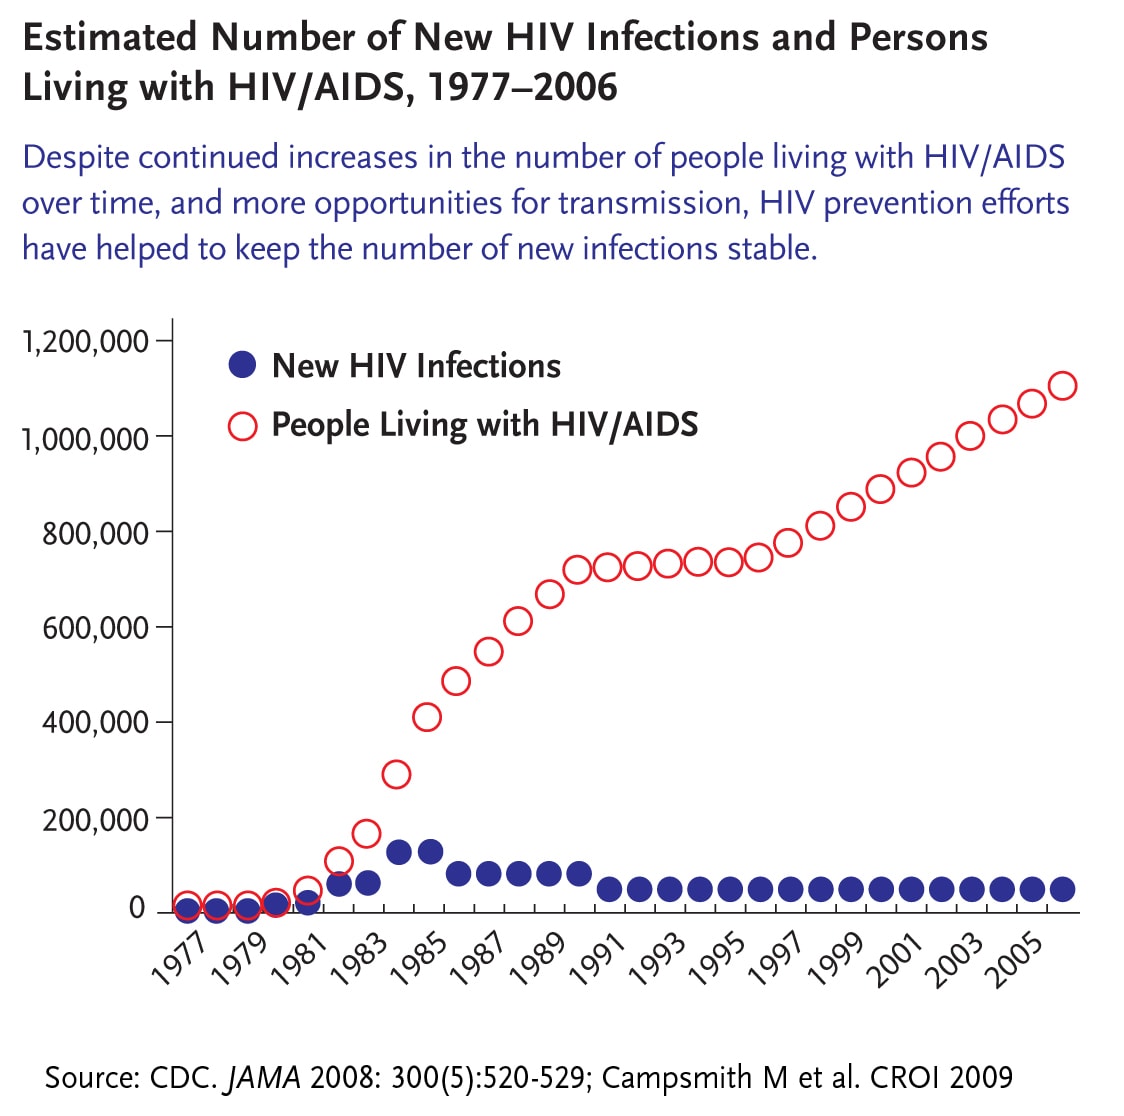
Despite continued increases in the number of people living with HIV/AIDS in the U.S. over time, and more opportunities for transmission, HIV prevention efforts have helped to keep the number of new HIV infections stable.
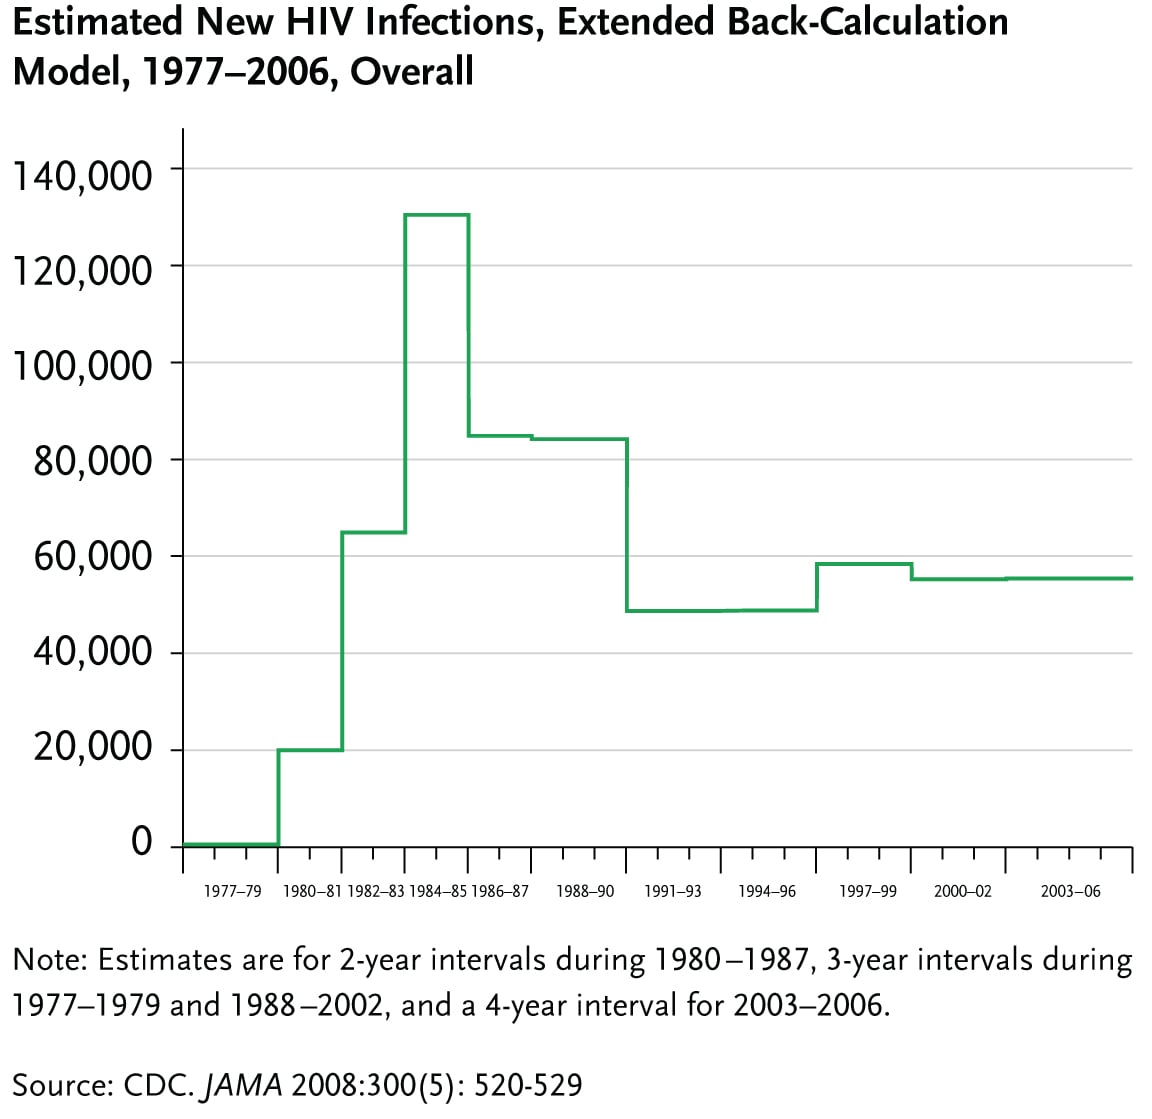
The annual number of new HIV infections in the U.S. has been roughly stable since the late 1990s.
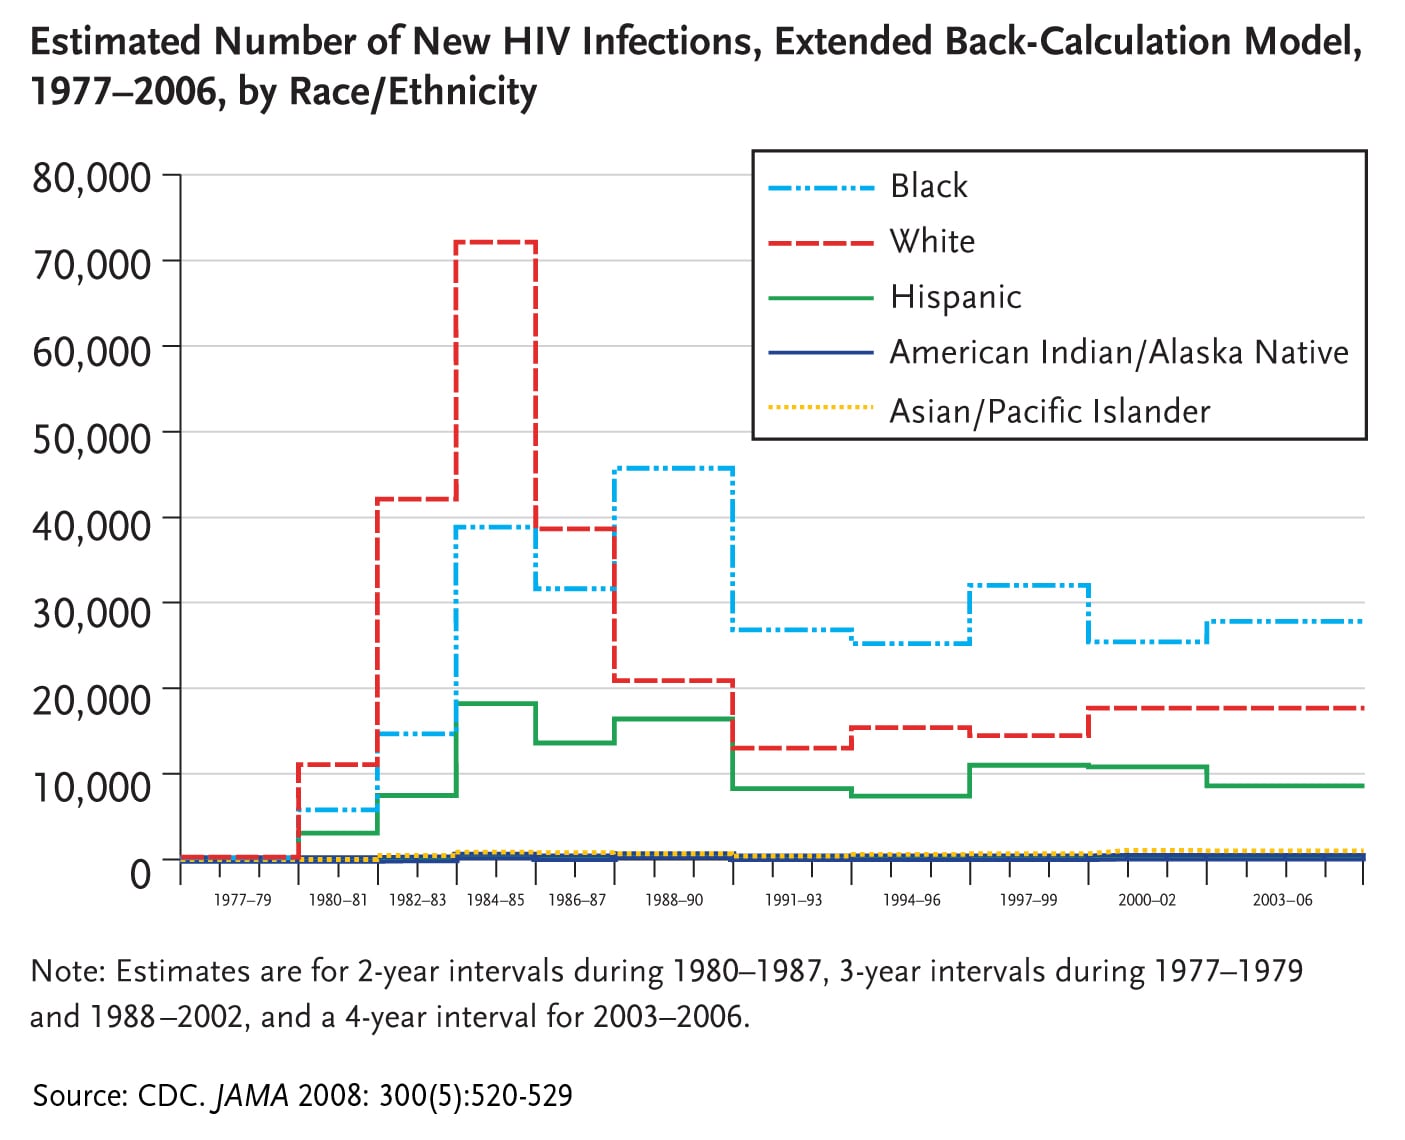
The number of new HIV infections peaked among blacks in the late 1980s and has exceeded the number of infections in whites since that time. The number of new infections among Hispanics has been lower than that for whites and blacks. Trends over time among Hispanics mirror those among blacks. For whites, the number of new infections declined significantly in the late 1980s, increased slightly during the 1990s and have remained stable since 2000.
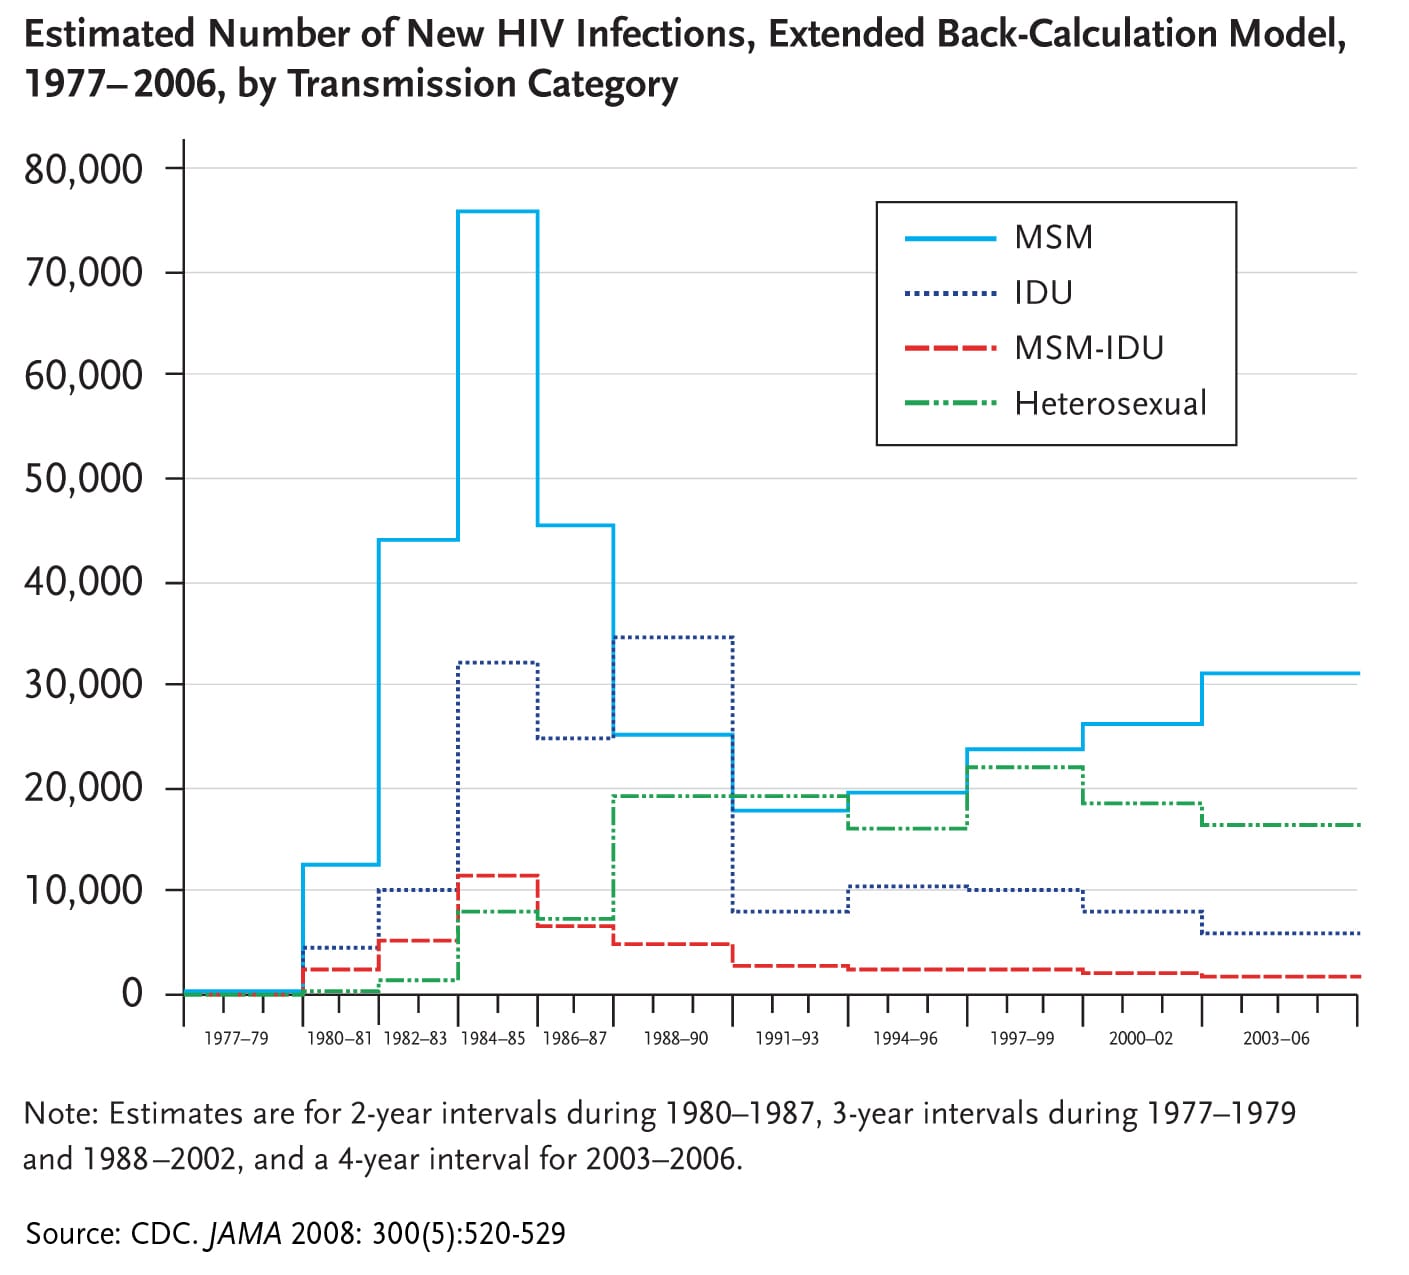
The number of new infections among gay and bisexual men has been increasing steadily since the early 1990s. The number of new infections among heterosexuals fluctuated somewhat through the 1990s and has declined in recent years. The number of new infections among injection drug users has declined dramatically over time.