Preventing and Controlling TB
Allocation Case Study 2
CDC provides financial and technical assistance to state, local, and territorial health and educational agencies to implement high-impact programs to prevent and control youth risk behaviors, HIV/AIDS, viral hepatitis, STDs, and tuberculosis (TB). One aspect of high-impact prevention (HIP) is to align resources to burden of disease. CDC reserves additional funds to assist state and local health departments with outbreaks that continue to occur every year in the United States.
Resource allocation planning is an example of a high-impact approach that has directed funding for TB elimination since 2005. The evolution of resource allocation for prevention and control of TB in health department funding reflects the changing epidemiology of TB, new treatment guidelines, and the emergence of indicators to monitor program performance—all taking place in the context of flat funding for TB programs.
Why Use a Funding Formula?
Prior to 2005, CDC’s method of allocation of TB funds to state and city health departments for prevention and control of TB was based on the burden of TB disease among jurisdictions that had experienced the largest increases in case counts during the TB resurgence that took place from 1985-1993. Over time, changes in U.S. TB epidemiology made this “legacy” funding model obsolete. Funding levels disproportionately favored programs that had largely recovered from the resurgence. However, in the absence of new funding, CDC could not increase support to jurisdictions that had begun to report larger numbers of cases. CDC needed to redistribute funding in a way that was equitable without causing large disruptions in program operations.
Beginning in 2005, CDC adopted an approach to apportion some of its TB program funding using a formula that reflected the needs of all of the recipient jurisdictions, based on the changing epidemiology of TB in the United States and no change in assistance funds available each year . The approach was based on average numbers of TB cases and weighted for risk factors that can make TB disease more complicated to treat, including TB among vulnerable populations (U.S.-born racial and ethnic minorities and non-U.S.-born persons, and TB cases among persons with HIV co-infection), multidrug-resistant TB strains, recent history of substance use disorders or homelessness, and the total number of persons arriving to the United States with certain overseas medical screening classifications that are followed up on by health departments. The number of persons with smear-positive pulmonary (more infectious) TB was added later. CDC phased in use of the TB funding formulas to allow TB programs to prepare for large changes in funding levels as their case burdens shifted.

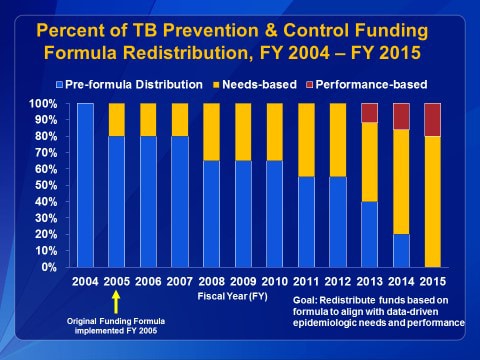
This graph illustrates how legacy funding (blue bars) was phased out gradually to maintain stability in local programs. Needs-based funding (yellow bars), implemented in 2005, continued. In 2015, 100% of all TB prevention, training, and laboratory services funding to TB programs was allocated by formula.
This graph illustrates how legacy funding (blue bars) was phased out gradually to maintain stability in local programs. Needs-based funding (yellow bars), implemented in 2005, continued. In 2015, 100% of all TB prevention, training, and laboratory services funding to TB programs was allocated by formula.
CDC solicits input from TB program and laboratory colleagues in high, medium, and low-burden jurisdictions on the funding allocation formulas prior to each funding cycle. The formulas are revised as needed to remain responsive to program needs. For example, the five-year average was changed to a three-year average so that funding levels can rapidly reflect changes in case burden.
CDC also began to award baseline funding amounts to jurisdictions with the lowest TB burdens to ensure that every jurisdiction has Federal funding to support the national TB program.
Adding Performance Indicators to the Prevention and Control Funding Formula
In 2013, CDC realigned the funding formula to include progress on performance indicators in addition to the local needs-based TB burden. CDC had developed the National Tuberculous Indicator Project (NTIP) to help programs use surveillance data to prioritize specific TB prevention activities within their available state and federal resources. By adding performance indicators to the prevention and control funding formula, CDC gave programs a financial incentive to improve two important performance indicators:
- The number of TB patients who complete treatment within 12 months of treatment start, and
- The number of culture-positive TB patients who have TB isolates tested for drug susceptibility.
Next Steps
CDC, with input from partners, is currently evaluating funding formulas that will govern funding for the TB prevention, control, and laboratory services cooperative agreements that begin in 2020.


