Age
PAGE 8 of 18
‹View Table of Contents
The age distribution among participants in the Registry and the HTC PP were within a 1-5% difference of each other within each age category. Compared to the 2014 U.S. population, both the Registry and HTC PP participants were much younger. Fifty-one percent of the Registry participants were less than 20 years of age compared to 27% of the U.S. population. Nineteen percent of the Registry participants were 45 years or older compared to 40% of the U.S. population (Figure 3).
Figure 3: Ages of the Registry participants compared to Community Counts HTC Population Profile and the U.S. Census (2014 estimates)
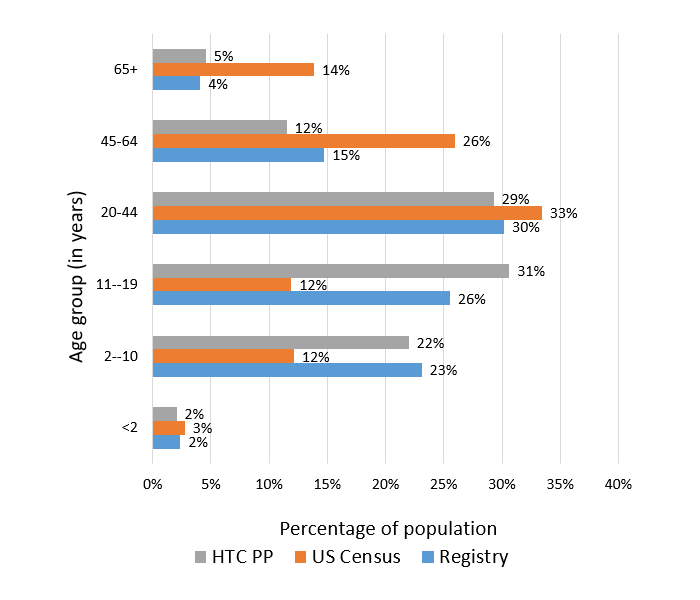
| Age | Registry | US Census | HTC PP | |||
|---|---|---|---|---|---|---|
| N | % | N | % | N | % | |
| <2 | 75 | 2% | 8880674 | 3% | 887 | 2% |
| 2–10 | 729 | 23% | 39234020 | 12% | 9564 | 22% |
| 11–19 | 805 | 26% | 38535025 | 12% | 13329 | 31% |
| 20-44 | 943 | 30% | 108142164 | 33% | 12747 | 29% |
| 45-64 | 465 | 15% | 83911085 | 26% | 5009 | 12% |
| 65+ | 128 | 4% | 44849801 | 14% | 1986 | 5% |
Pages in this Report
- Highlights & Acknowledgements
- Background
- Methods
- Geographic Distribution of Registry Participants
- Registry Characteristics 2014
- Diagnosis
- Sex
- ›Age
- Race/Ethnicity
- Education
- Weight Status
- Health Insurance Coverage
- Health Insurance Coverage by Age
- Viral and Vaccination Status
- Use of Healthcare Services and Absenteeism
- Chronic Diseases, Conditions, or Surgical Procedures
- Technical Notes
- Participating HTCs