Short Sleep Duration Among Middle School and High School Students — United States, 2015
Weekly / January 26, 2018 / 67(3);85–90
Anne G. Wheaton, PhD1; Sherry Everett Jones, PhD2; Adina C. Cooper, MA, MEd1; Janet B. Croft, PhD1 (View author affiliations)
View suggested citationSummary
What is already known about this topic?
Insufficient sleep among children and adolescents is associated with an increased risk for obesity, diabetes, injuries, poor mental health, attention and behavior problems, and poor academic performance. Nationwide, approximately two thirds of U.S. high school students report sleeping <8 hours per night on school nights.
What is added by this report?
This is the first report to provide state-level estimates of short sleep duration among middle school and high school students using age-specific recommendations from the American Academy of Sleep Medicine. A majority of both middle school and high school students in states and large urban school districts included in this report get less than the recommended amount of sleep, putting them at an increased risk for several chronic conditions.
What are the implications for public health practice?
The finding that a large percentage of middle school and high school students who do not get enough sleep on school nights provides an opportunity for promoting sleep health in schools, including addition of sleep health to curricula and delaying school start times to permit students adequate time for sleep.

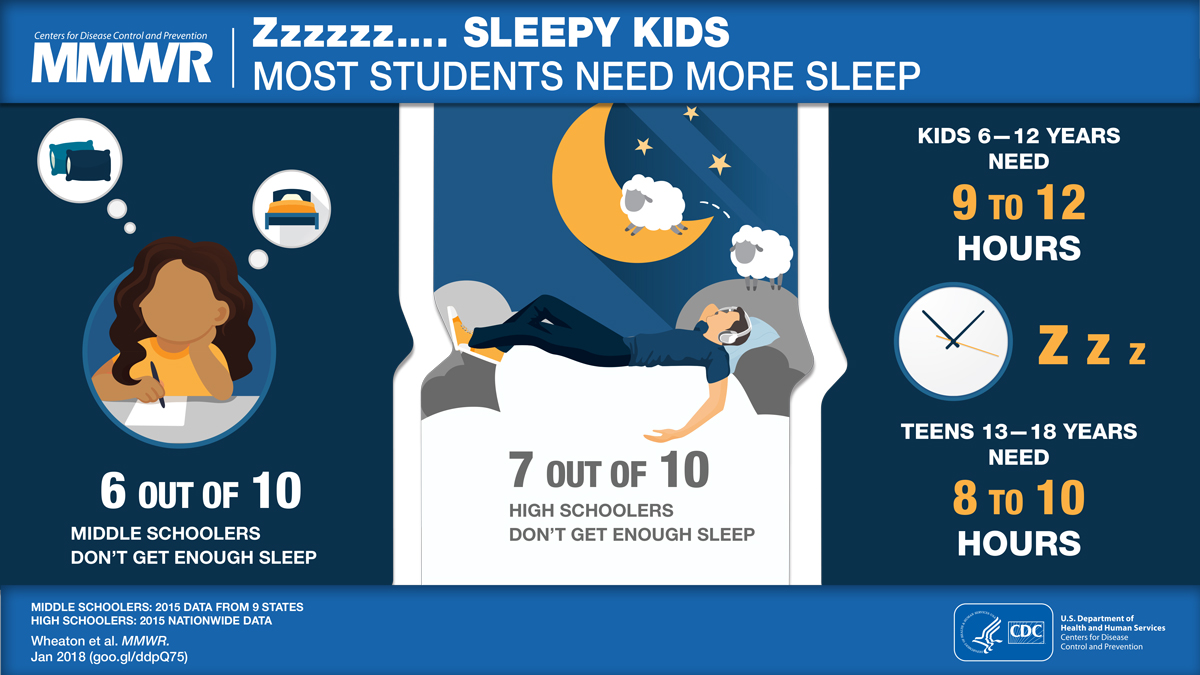
Insufficient sleep among children and adolescents is associated with increased risk for obesity, diabetes, injuries, poor mental health, attention and behavior problems, and poor academic performance (1–4). The American Academy of Sleep Medicine has recommended that, for optimal health, children aged 6–12 years should regularly sleep 9–12 hours per 24 hours and teens aged 13–18 years should sleep 8–10 hours per 24 hours (1). CDC analyzed data from the 2015 national, state, and large urban school district Youth Risk Behavior Surveys (YRBSs) to determine the prevalence of short sleep duration (<9 hours for children aged 6–12 years and <8 hours for teens aged 13–18 years) on school nights among middle school and high school students in the United States. In nine states that conducted the middle school YRBS and included a question about sleep duration in their questionnaire, the prevalence of short sleep duration among middle school students was 57.8%, with state-level estimates ranging from 50.2% (New Mexico) to 64.7% (Kentucky). The prevalence of short sleep duration among high school students in the national YRBS was 72.7%. State-level estimates of short sleep duration for the 30 states that conducted the high school YRBS and included a question about sleep duration in their questionnaire ranged from 61.8% (South Dakota) to 82.5% (West Virginia). The large percentage of middle school and high school students who do not get enough sleep on school nights suggests a need for promoting sleep health in schools and at home and delaying school start times to permit students adequate time for sleep.
The Youth Risk Behavior Surveillance System was designed to estimate the prevalence of health risk behaviors among students that contribute to the leading causes of death and disability in the United States at the national, state, territorial, tribal, and large urban school district levels.* Students complete an anonymous, voluntary, school-based paper-and-pencil questionnaire during a regular class period after the school obtains parental permission according to local procedures. The national high school YRBS is conducted by CDC. It uses a three-stage cluster sample design to obtain a nationally representative sample of students in public and private schools in grades 9–12 (5). In 2015, the student sample size was 15,624.† The school and student response rates were 69% and 86%, respectively, resulting in an overall response rate of 60%.§
State and large urban school district high school and middle school surveys are conducted by health and education departments using a two-stage cluster sample designed to produce representative samples of students in each jurisdiction (5). These surveys are independent of CDC’s national YRBS and, unlike the national YRBS, are representative of only public school students, except in one state. To be included in this report, states and large urban school districts had to 1) have at least a 60% overall response rate, 2) include a question on sleep duration, and 3) provide permission for CDC to include their data. Thirty states and 16 large urban school districts administered a high school YRBS and met these criteria. Across these states, the student sample sizes ranged from 1,313 (South Dakota) to 55,596 (Maryland).¶ The median overall response rate was 66.5% and ranged from 60% (Indiana and North Carolina) to 84% (Virginia). Across these large urban school districts, the high school student sample sizes ranged from 1,413 (Broward County, Florida) to 10,419 (District of Columbia). The median overall response rate was 76.5% and ranged from 64% (District of Columbia) to 88% (San Diego, California).
Nine states and seven large urban school districts administered a middle school YRBS and met these criteria. Across these states, the student sample sizes ranged from 1,640 (Kentucky) to 27,104 (Maryland). The median overall response rate was 76% and ranged from 68% (Maine) to 85% (Hawaii and Virginia). Across these large urban school districts, the middle school student sample sizes ranged from 1,333 (Los Angeles, California) to 4,533 (Duval County, Florida). The median overall response rate was 81% and ranged from 68% (San Francisco, California) to 86% (Orange County, Florida). All data sets were weighted to be representative of students in the jurisdiction.
All students in the national, state, and large urban school district surveys were asked to respond to this question about sleep duration: “On an average school night, how many hours of sleep do you get?” Possible responses were 4 or less hours, 5 hours, 6 hours, 7 hours, 8 hours, 9 hours, and 10 or more hours. Short sleep duration was defined as <9 hours for students aged 6–12 years and <8 hours for those aged 13–18 years. The analytic samples were composed of students who responded to both the sleep duration question and the age question.**
Prevalences and 95% confidence intervals (CIs) of short sleep duration on an average school night were calculated overall and by sex, grade, and race/ethnicity for the national high school YRBS and for a combined data set composed of data from the nine states that included the sleep duration question in a middle school YRBS. This combined data set is not nationally representative. The overall prevalence and 95% CI of short sleep duration also were calculated separately for each state and large urban school district at both middle school and high school levels. Pairwise differences in short sleep duration prevalence among sex, grade, and race/ethnicity subgroups were determined using t-tests; differences among estimates were considered statistically significant if the t-test p-value was <0.05. Analyses accounted for the weighting of the data and for the complex sampling designs.
The overall prevalence of short sleep duration among middle school students in the nine states combined was 57.8% (Table 1). The distribution of sleep duration was 5.9% for ≤4 hours, 6.0% for 5 hours, 11.0% for 6 hours, 20.0% for 7 hours, 29.9% for 8 hours, 17.2% for 9 hours, and 10.0% for ≥10 hours. The prevalence of short sleep duration in this combined sample was higher among female students (59.6%) than among male students (56.0%). The prevalence of short sleep duration also was highest among students in grade 6 (61.3%), lowest among students in grade 8 (53.1%), and higher among black (61.1%) and Native Hawaiian/Pacific Islander (64.2%) students than among white (56.6%), Hispanic (57.3%), and Asian (55.5%) students. State-specific estimates of short sleep duration ranged from 50.2% (New Mexico) to 64.7% (Kentucky). Prevalence estimates for the seven large urban school districts ranged from 50.2% (San Francisco, California) to 61.8% (Miami-Dade County, Florida).
At the high school level, nationwide, the prevalence of short sleep duration was 72.7% (Table 2). The distribution of sleep duration was 7.5% for ≤4 hours, 12.6% for 5 hours, 22.9% for 6 hours, 29.7% for 7 hours, 20.6% for 8 hours, 5.0% for 9 hours, and 1.7% for ≥10 hours. The prevalence of short sleep duration was higher among female students (75.6%) than among male students (69.9%), lower among students in grade 9 (65.6%) than in other grades (71.7%–77.6%), and higher among black (76.5%) and Asian (79.3%) students than white (72.0%) and Hispanic (70.2%) students. State-level estimates of short sleep duration for the 30 states ranged from 61.8% (South Dakota) to 82.5% (West Virginia) (Table 2) (Figure). Prevalence estimates for the 16 large urban school districts ranged from 69.9% (Los Angeles, California) to 85.6% (Broward County, Florida).
Discussion
Children and adolescents who do not get the recommended amount of sleep for their age are at increased risk for chronic conditions such as diabetes, obesity, and poor mental health, as well as injuries, attention and behavioral problems, and poor academic performance (1–4). In addition, short sleep duration has been found to be associated with engaging in health- and injury-related risk behaviors among high school students (6,7). The national high school YRBS has included a question about sleep duration since 2007, and it is used to track the progress of the Healthy People 2020 sleep objective for this population (Sleep Health Objective 3: Increase the proportion of students in grades 9 through 12 who get sufficient sleep).†† Nationally, no progress has been made toward this objective: the percentage of high school students who get sufficient sleep has substantially decreased from 30.9% in 2009, the baseline year for this objective, to 27.3% in 2015, the latest year of available data.§§ A question about sleep duration was included for the first time in 2015 in the standard middle school and high school YRBS questionnaires used as the starting point for the state and large urban school district YRBS questionnaires. As a result, evidence now exists that short sleep duration is prevalent among middle school students as well as high school students. In addition, at both middle and high school levels, in every state and large urban school district with YRBS data about sleep duration, a majority of students reported getting less than the recommended amount of sleep.
The findings in this report are subject to at least four limitations. First, sleep duration was obtained by self-report and was not verified by objective measures such as actigraphy (sensor measurement of motor activity) or polysomnography (sleep study). Second, a national YRBS is not conducted among middle school students. The middle school findings from the combined data set cannot be generalized to the entire United States. Third, at both middle and high school levels, state-level data are not available for states that did not administer the YRBS, did not include a question about sleep duration on their YRBS, or did not achieve a high enough overall response rate to obtain weighted data. Finally, YRBS data are representative only of students enrolled in school; in 2015, less than 5% of children aged 7–17 years were not enrolled in school.¶¶
To ensure their children get enough sleep, parents can support the practice of good sleep habits. One important habit is maintaining a consistent sleep schedule during the school week and weekends. Parent-set bedtimes have been linked to getting enough sleep among adolescents (8). Evening light exposure and technology use are also associated with less sleep among adolescents (9). Parents can limit children’s permitted use of electronic devices in terms of time (e.g., only before a specific time, sometimes referred to as a “media curfew”) and place (e.g., not in their child’s bedroom) Other tips for better sleep are available at https://www.cdc.gov/sleep/about_sleep/sleep_hygiene.html. One meta-analysis of school-based sleep education programs found that they produced significantly longer weekday and weekend total sleep time immediately after completion, but that these improvements were not maintained at follow-up (10). Researchers designing such programs might consider incorporating refresher sessions to maintain improvements in sleep duration and sleep hygiene (i.e., habits that support good sleep). School districts can also support adequate sleep among students by implementing delayed school start times as recommended by the American Academy of Pediatrics,*** the American Medical Association,††† and the American Academy of Sleep Medicine.§§§
Conflict of Interest
No conflicts of interest were reported.
Corresponding author: Anne G. Wheaton, awheaton@cdc.gov, 770-488-5362.
1Division of Population Health, National Center for Chronic Disease Prevention and Health Promotion, CDC; 2Division of Adolescent and School Health, National Center for HIV/AIDS, Viral Hepatitis, STD, and TB Prevention, CDC.
* https://www.cdc.gov/healthyyouth/data/yrbs/overview.htm.
† https://www.cdc.gov/healthyyouth/data/yrbs/pdf/2015/ss6506_updated.pdf.
§ Overall response rate = school response rate x student response rate ([number of participating schools/number of eligible sampled schools] x [number of usable questionnaires/number of eligible students sampled]).
¶ https://www.cdc.gov/healthyyouth/data/yrbs/pdf/2015/ss6506_updated.pdf.
** In response to the question “How old are you?” middle school students could select from “10 years old or younger, 11 years old, 12 years old, 13 years old, 14 years old, 15 years old, or 16 years old or older”; high school students could select from “12 years old or younger, 13 years old, 14 years old, 15 years old, 16 years old, 17 years old, or 18 years old or older.” High school students who reported being “18 years old or older” were considered to have a short sleep duration if they reported <8 hours of sleep on an average school night.
†† https://www.healthypeople.gov/2020/topics-objectives/topic/sleep-health/objectives.
§§ https://www.healthypeople.gov/2020/data/Chart/5260?category=1&by=Total&fips=-1.
¶¶ https://nces.ed.gov/programs/digest/d16/tables/dt16_103.20.asp.
*** http://pediatrics.aappublications.org/content/early/2014/08/19/peds.2014-1697.
††† https://www.ama-assn.org/ama-supports-delayed-school-start-times-improve-adolescent-wellness.
References
- Paruthi S, Brooks LJ, D’Ambrosio C, et al. Consensus statement of the American Academy of Sleep Medicine on the recommended amount of sleep for healthy children: methodology and discussion. J Clin Sleep Med 2016;12:1549–61. CrossRef PubMed
- Owens J; Adolescent Sleep Working Group; Committee on Adolescence. Insufficient sleep in adolescents and young adults: an update on causes and consequences. Pediatrics 2014;134:e921–32. CrossRef PubMed
- Lowry R, Eaton DK, Foti K, McKnight-Eily L, Perry G, Galuska DA. Association of sleep duration with obesity among US high school students. J Obes 2012;2012:476914. CrossRef PubMed
- Fitzgerald CT, Messias E, Buysse DJ. Teen sleep and suicidality: results from the youth risk behavior surveys of 2007 and 2009. J Clin Sleep Med 2011;7:351–6. PubMed
- Brener ND, Kann L, Shanklin S, et al. Methodology of the Youth Risk Behavior Surveillance System—2013. MMWR Recomm Rep 2013;62(No. RR-01). PubMed
- McKnight-Eily LR, Eaton DK, Lowry R, Croft JB, Presley-Cantrell L, Perry GS. Relationships between hours of sleep and health-risk behaviors in US adolescent students. Prev Med 2011;53:271–3. CrossRef PubMed
- Wheaton AG, Olsen EO, Miller GF, Croft JB. Sleep duration and injury-related risk behaviors among high school students—United States, 2007–2013. MMWR Morb Mortal Wkly Rep 2016;65:337–41. CrossRef PubMed
- Short MA, Gradisar M, Lack LC, et al. A cross-cultural comparison of sleep duration between US and Australian adolescents: the effect of school start time, parent-set bedtimes, and extracurricular load. Health Educ Behav 2013;40:323–30. CrossRef PubMed
- Bartel KA, Gradisar M, Williamson P. Protective and risk factors for adolescent sleep: a meta-analytic review. Sleep Med Rev 2015;21:72–85. CrossRef PubMed
- Chung K-F, Chan M-S, Lam Y-Y, Lai CS-Y, Yeung W-F. School-based sleep education programs for short sleep duration in adolescents: a systematic review and meta-analysis. J Sch Health 2017;87:401–8. CrossRef PubMed
Abbreviation: CI = confidence interval.
* Short sleep duration defined as <9 hours for students aged 6–12 years and <8 hours for students aged 13–18 years.
† Unweighted number of survey respondents. Categories might not sum to sample total because of missing responses.
§ A combined data set using data from nine state surveys (Delaware, Florida, Hawaii, Kentucky, Maine, Maryland, New Mexico, Virginia, and West Virginia) that is not nationally representative.
¶ Significantly different by sex (p<0.05).
** Significantly different from grade 7 (p<0.05).
†† Significantly different from grade 8 (p<0.05).
§§ Significantly different from grade 6 (p<0.05).
¶¶ Non-Hispanic.
*** Significantly different from black students (p<0.05).
††† Significantly different from Native Hawaiian/Pacific Islander students (p<0.05).
§§§ Significantly different from white students (p<0.05).
¶¶¶ Significantly different from Hispanic students (p<0.05).
**** Significantly different from Asian students (p<0.05).
Abbreviation: CI = confidence interval.
* Short sleep duration defined as <9 hours for students aged 6–12 years and <8 hours for students aged 13–18 years.
† Unweighted number of survey respondents. Categories might not sum to sample total because of missing responses.
§ Significantly different by sex (p<0.05).
¶ Significantly different from grade 10 (p<0.05).
** Significantly different from grade 11 (p<0.05).
†† Significantly different from grade 12 (p<0.05).
§§ Significantly different from grade 9 (p<0.05).
¶¶ Non-Hispanic.
*** Significantly different from black students (p<0.05).
††† Significantly different from Asian students (p<0.05).
§§§ Significantly different from white students (p<0.05).
¶¶¶ Significantly different from Hispanic students (p<0.05).
**** Unreliable estimate. Denominator <100 students.
 FIGURE. Prevalence of short sleep duration* on an average school night among high school students, by state — Youth Risk Behavior Survey, 2015

* Short sleep duration defined as <9 hours for students aged 6–12 years and <8 hours for students aged 13–18 years.
The figure above is a U.S. map showing prevalence of short sleep duration on an average school night among high school students, by state, based on data from the 2015 Youth Risk Behavior Survey.
Suggested citation for this article: Wheaton AG, Jones SE, Cooper AC, Croft JB. Short Sleep Duration Among Middle School and High School Students — United States, 2015. MMWR Morb Mortal Wkly Rep 2018;67:85–90. DOI: http://dx.doi.org/10.15585/mmwr.mm6703a1.
MMWR and Morbidity and Mortality Weekly Report are service marks of the U.S. Department of Health and Human Services.
Use of trade names and commercial sources is for identification only and does not imply endorsement by the U.S. Department of
Health and Human Services.
References to non-CDC sites on the Internet are
provided as a service to MMWR readers and do not constitute or imply
endorsement of these organizations or their programs by CDC or the U.S.
Department of Health and Human Services. CDC is not responsible for the content
of pages found at these sites. URL addresses listed in MMWR were current as of
the date of publication.
All HTML versions of MMWR articles are generated from final proofs through an automated process. This conversion might result in character translation or format errors in the HTML version. Users are referred to the electronic PDF version (https://www.cdc.gov/mmwr) and/or the original MMWR paper copy for printable versions of official text, figures, and tables.
Questions or messages regarding errors in formatting should be addressed to mmwrq@cdc.gov.