 |
|
|
|
|
|
|
| ||||||||||
|
|
|
|
|
|
|
||||
| ||||||||||
|
|
|
|
|
Persons using assistive technology might not be able to fully access information in this file. For assistance, please send e-mail to: mmwrq@cdc.gov. Type 508 Accommodation and the title of the report in the subject line of e-mail. National Surveillance for Asthma --- United States, 1980--2004Jeanne E. Moorman, MS,1 Rose Anne Rudd,
MSPH,1 Carol A. Johnson, MPH,1
Michael King, PhD,1 Patrick Minor,
MSPH,1, 2 Cathy Bailey, MS,1
Marissa R. Scalia, MPH,1, 3 Lara J. Akinbami,
MD4
1Division of Environmental Hazards and Health Effects, National Center for Environmental Health, CDC
Corresponding author: Jeanne E. Moorman, MS, Division of Environmental Hazards and Health Effects, National Center for Environmental Health, 1600 Clifton Road, N.E., MS E-17, Atlanta, GA 30333, Telephone: 404-498-1000; Fax: 404-498-1088; E-mail: zva9@cdc.gov. AbstractProblem/Condition: Asthma, a chronic respiratory disease with episodic symptoms, increased in prevalence during 1980--1996 in the United States. Asthma has been the focus of numerous provider interventions (e.g., improving adherence to asthma guidelines) and public health interventions during recent years. Although the etiology of asthma is unknown, adherence to medical treatment regimen and environmental management should reduce the occurrence of exacerbations and lessen the hardship of this disease. CDC has outlined a public health approach to asthma that includes comprehensive analyses of national surveillance data on prevalence, health-care use and mortality, and a strategy to improve the timeliness and geographic specificity of asthma surveillance data. Reporting Period Covered: This report presents national data on asthma for self-reported prevalence (1980--1996 and 2001--2004); self-reported attacks (1997--2004); visits to physicians' offices (1980--2004), hospital outpatient departments (1992--2004), and emergency departments (1992--2004); hospitalizations (1980--2004); and deaths (1980--2004). Description of Systems: The National Health Interview Survey includes questions about asthma prevalence and asthma attacks. Physicians' office visit data are collected in the National Ambulatory Medical Care Survey, emergency department and hospital outpatient data in the National Hospital Ambulatory Medical Care Survey, hospitalization data in the National Hospital Discharge Survey, and death data in the Mortality component of the National Vital Statistics System. Results: From 1980 to 1996, 12-month asthma prevalence increased both in counts and rates, but no discernable change was identified in asthma attack estimates since 1997 or in current asthma prevalence from 2001 to 2004. During the period of increasing prevalence, patient encounters (office visits, emergency department visits, outpatient visits, and hospitalizations) for asthma increased. However, rates for these encounters, when based on the population with asthma, did not increase. Although the rate of asthma deaths increased during 1980--1995, the rate of deaths has decreased each year since 2000. During 2001--2003, current asthma prevalence was higher in children (8.5%) compared with adults (6.7%), females (8.1%) compared with males (6.2%), blacks (9.2%) compared with whites (6.9%), those of Puerto Rican descent (14.5%) compared with those of Mexican descent (3.9%), those below the federal poverty level (10.3%) compared with those at or above the federal poverty level (6.4% to 7.9%), and those residing in the Northeast (8.1%) compared with those residing in other regions (6.7% to 7.5%). Among persons with current asthma, whites and blacks were equally likely to report an attack during the preceding 12 months. Women with current asthma were more likely to report asthma attacks than men, and children were more likely than adults. The rate for asthma health-care encounters, regardless of place (physician office, emergency department, outpatient department, or hospital), when based on the population with asthma, did not differ by race. However, whites with current asthma had higher rates for physician offices, and blacks had higher rates for hospital-based sites (e.g., outpatient clinics and emergency departments). Interpretation: The findings in this report suggest that from 1980 through the mid-1990s, increases in asthma prevalence played a substantial role in the increases in patient encounter measures used in asthma surveillance. Because no primary strategies for preventing asthma have been identified, efforts to control asthma exacerbations through interventions that promote adhering to proper medical regimens and reducing exposures to causes of asthma exacerbations should continue to be pursued. IntroductionAsthma is a chronic inflammatory disorder of the airways characterized by episodic and reversible airflow obstruction and airway hyperresponsiveness. Clinical manifestations include wheezing, coughing, and shortness of breath. Although the pathophysiology of asthma is fairly well understood, the exact etiology is not. Following medical management guidelines and avoiding exposure to environmental allergens and irritants that are known to exacerbate asthma are factors that can contribute to the long-term management of asthma. The specific measures used to assess asthma morbidity and mortality have changed since the 1960s; however, the findings of previous studies are consistent with an increase in asthma burden (1--3). Estimates of asthma 12-month period prevalence* indicated that approximately 3.0% of the population had asthma in 1970 (1). Estimates from CDC's 2002 Asthma Surveillance Summary indicated that asthma 12-month period prevalence was 5.5% in 1996 (3). Asthma mortality rates increased during 1979--1996, but not during 1996--1998. From 1979 through 1998, deaths were categorized using the International Classification of Diseases, Ninth Revision (ICD-9) (4). The tenth revision (ICD-10) was implemented in 1999 (5) after which asthma mortality rates declined. Part of the decline was a result of the coding change. Information on the burden of asthma is provided from self-reported asthma episodes or attacks, physician office visits or hospital outpatient visits, emergency department visits, and hospital inpatient stays. Expressed as population-based rates, each of the measures used in the 2002 Surveillance Summary indicated either increasing or stable asthma burden, at least through the 1990s (3). A 1987 report that included asthma surveillance data for 1965--1984 identified a disparate burden in certain demographic subgroups (age, sex, and race) (1). Subsequent asthma surveillance reports confirmed the disparities and documented their persistence over time (2,3). These reports indicated that population-based prevalence rates, emergency department rates, and hospitalization rates were higher in blacks than whites, higher in females than males, and higher in children than adults and that office visit rates were higher in females than males, higher in children than adults, but lower in blacks than in whites. The only measure for which adults exceeded children was asthma mortality rates (1--3). Previous reports also indicated that mortality rates were higher for blacks than whites and higher for women than men. Subsequently, more detailed analysis of ethnicity data demonstrated that among Hispanics, Puerto Ricans had higher prevalence and death rates than other Hispanics (e.g., Mexicans), non-Hispanic blacks, and non-Hispanic whites (6,7). Asthma is a key component in the respiratory disease chapter of the Healthy People 2010 (HP 2010) objectives (8). These objectives include reducing asthma deaths (objective 24-1), reducing hospitalizations for asthma (objective 24-2), reducing hospital emergency department visits for asthma (objective 24-3), reducing activity limitations among persons with asthma (objective 24-4), reducing the number of school or work days missed by persons with asthma because of asthma (objective 24-5), increasing the proportion of persons with asthma who receive formal patient education (objective 24-6), increasing the proportion of persons with asthma who receive appropriate asthma care according to the National Asthma Education and Prevention Program (NAEPP) guidelines (objective 24-7) (9,10), and establishing an asthma surveillance system in at least 25 states (objective 24-8). CDC's National Asthma Control Program (NACP), established by the National Center for Environmental Health (NCEH) in 1999, supports the goals and objectives of HP 2010 by providing funds to 35 states and territories and seven cities to implement asthma interventions that impact these goals and objectives. NACP supports a strategy for a comprehensive public health approach to asthma that includes interventions, partnerships, and surveillance (11). The surveillance component of the public health approach to asthma includes analyzing national data on prevalence, health-care use, and mortality and improving the detail and geographic specificity of asthma surveillance data. NCEH added asthma-specific questions to the Behavioral Risk Factor Surveillance System (BRFSS) in 1999 (12). NCEH also supports and promotes questions about asthma in the National Longitudinal Survey of Youth, the National Health Interview Survey (NHIS) Healthy People 2010 supplements, the National Survey of Children's Health (NSCH), and the Youth Risk Behavior Survey. In addition, NCEH developed a detailed asthma survey for state implementation originally piloted as the National Asthma Survey (NAS) through the State and Local Area Integrated Telephone Survey (SLAITS) in 2003 (13). Beginning in 2005, this detailed asthma survey has been administered through BRFSS as a follow-up survey. Respondents who indicate that they have ever had asthma are called back and asked additional questions about their asthma. In 2006, a total of 25 states conducted the Asthma Call-Back Survey, and 35 states are conducting the Asthma Call-Back Survey in 2007. Before NACP development and financing of asthma questions and surveys, no source for detailed state-level asthma data existed. However, state-level prevalence estimates from multiple years of data can be calculated from the national-level NHIS with technical assistance from the Research Data Center at the National Center for Health Statistics (NCHS). The state-level data obtained through these surveys can be used for planning and evaluating asthma programs and interventions at the state and local level. Timeliness has improved in national surveillance data. NCHS releases data from NHIS within 6 months of the end of the survey year. Early releases of asthma prevalence rates also are published quarterly (14). In addition, in 1999, 2002, and 2003, the NHIS included supplements that collected information about the management and control of asthma (15). Data and reports released subsequent to the preparation of this report are available from NCHS†. This report is the third in a series of national surveillance summaries on the burden of asthma (2,3). It includes estimates for recent years that are consistent with those presented in the 2002 Surveillance Summary.§ In this report, data about hospital outpatient visits for asthma are presented separately from ambulatory visits to physicians' offices. In addition, this report expands the content of previous surveillance summaries by providing information for demographic groups not previously included and introduces an at-risk--based rate to complement the population-based rates provided in earlier reports. Historically, outcome data for asthma were presented as population-based rates (the general population was the denominator of the rate). However, the population at risk for outcomes from asthma is persons who have asthma. The at-risk--based rates restrict the denominator of the rates to those with asthma. MethodsAsthma prevalence and morbidity data were obtained from national health surveys conducted by NCHS. Asthma prevalence data (1980--1996 and 2001--2004) and episode or attack data (1997--2004) were obtained from NHIS. Physician office visit data (1980--2004) were obtained from the National Ambulatory Medical Care Survey (NAMCS). Hospital outpatient visit data (1992--2004) and emergency department data (1992--2004) were obtained from the National Hospital Ambulatory Medical Care Survey (NHAMCS). Hospitalization data (1980--2004) were obtained from the National Hospital Discharge Survey (NHDS). Death data (1980--2004) were taken from the National Vital Statistics System (NVSS) mortality files. Details related to survey methodology, changes over time, and analytic procedures also are presented (Appendix). In this report, data are presented for selected individual years (1980, 1985, 1990, and 1995) and for each recent year (2000--2004). For emergency department and hospital outpatient visits, data are presented for 1992 because that was the first year those data were collected. Data are also presented for three combined years (2001--2003). These 3 years of survey data were aggregated to provide average annual estimates for detailed demographic subgroups. Combining 3 years of data provided more stable estimates by increasing the sample size and, consequently, reducing the standard errors. Because of time limitations related to differing data file release dates and the processing requirements for producing the combined year estimates, the tables that present the average annual estimates for the three combined years did not extend to 2004. However, tables that include 2004 are available at http://www.cdc.gov/asthma/asthmadata.htm#mmwr. Both counts and rates are provided in this report. The counts provide insight into the burden of the disease on the health-care system and society and provide perspective for the rates. The rates control for population size differences among the demographic groups and give additional insight into varying prevalence of the disease, its severity, management, and control. Rates were calculated using two methods. The denominator for the first rate (population-based) is the U.S. population appropriate to the particular data source. The denominator for the second rate (at-risk--based) is an estimate of persons with asthma. Rates based on the U.S. population were age-adjusted using the 2000 U.S. population distribution in 11 age categories (aged <1 year and 1--4, 5--14, 15--24, 25--34, 35--44, 45--54, 55--64, 65--74, 75--84, and >85 years) when sample size allowed. The at-risk--based rates provide additional understanding of changes over time in attacks, office visits, emergency department visits, hospitalizations, and deaths during a long period of increasing prevalence. These at-risk--based rates can be used to compare the risk for outcomes (e.g., hospitalizations or deaths) among the subgroup controlling for differing levels of prevalence. The race and ethnicity categories in this report follow the Office of Management and Budget's (OMB) standards for reporting race and ethnicity data to the extent possible. Data collected before 2000 followed OMB's 1977 Statistical Policy Directive No. 15, Race and Ethnic Standards for Federal Statistics and Administrative Reporting (16). Race groups were categorized as "white," "black," and "other." The "other" category included Asian, American Indian or Alaska Native (AIAN), Native Hawaiian or Other Pacific Islander (NHOPI), or an "other" race reported by the respondent. Data collected from 2000 and afterwards followed OMB's 1997 revision of Statistical Policy Directive No. 15 and, in this report, also were presented in the categories of "white," "black," and "other" (17,18). However, under the 1997 revision, the race categories of "white" and "black" include only the respondents who identified as single-race white or single-race black; "other" includes respondents who identified as multiple race, in addition to Asian, AIAN, NHOPI, or an "other" race reported by the respondent. The 1997 revision of Statistical Policy Directive No. 15 changed the ethnicity category from "Hispanic" to "Hispanic or Latino," but the definition of persons in that category remained the same. In this report, the ethnicity category includes only "Hispanic or Latino" and "Not Hispanic or Latino" because subgroups of Hispanic are not available for most data sources. However, for prevalence estimates from NHIS, Mexican and Puerto Rican subgroups are included. For the 3-year period 2001--2003, average annual asthma prevalence estimates by poverty status were provided; poverty information was only available for prevalence data. For each of the data sets, estimates also were provided for geographic regions as defined by the U.S. Bureau of the Census.¶ For all survey data, survey weights were used to calculate population-based estimates. Except for hospital discharge survey data for 1980 and 1985 and death record data, standard errors were calculated using SUDAAN (19) to account for each survey's complex sample design. Standard errors for hospital discharge survey estimates for 1980 and 1985 were calculated using approximation procedures provided by NCHS. Standard errors for the number of deaths were estimated by calculating the square root of the number of deaths, and standard errors for the crude death rates were estimated by dividing the rate by the square root of the number of deaths (20). Standard errors for the age-adjusted population-based rates were calculated as weighted linear combinations, assuming the population denominator was a constant (21). Standard errors for the at-risk--based rates, which used estimates of the number of persons with asthma in the denominator rather than a population constant, were calculated using the formula for ratios and assumed independent observations (covariance = 0) (22). Relative standard errors were calculated by dividing the standard errors by the estimates and multiplying by 100. Standard errors were used in significance tests, and relative standard errors were used to indicate unreliable estimates in the accompanying tables but otherwise were not included in this report. All stated comparisons (e.g., higher, lower, increased, and decreased) indicate that a nondirectional, 2-tailed z test was significant at the p<0.05 level. Only selected comparisons among the demographic groups were tested. For additional testing, standard error tables are available at http://www.cdc.gov/asthma/asthmadata.htm. For some comparisons, if a sufficient number of years of data were available, standard linear regression was used to evaluate trends over time. Although the tables provided show only 5-year intervals, data for the intervening years were included in the trend assessment. Prevalence and AttacksNHIS is conducted using a complex design probability sample of the civilian, noninstitutionalized U.S. population (23). The survey is administered by in-person interview in the sample household. Before 1997, asthma 12-month period prevalence was determined by an affirmative response to the question "During the past 12 months has anyone in the family had asthma?" Since 1997, three new asthma prevalence measures have been introduced, none of which is comparable to asthma 12-month prevalence. These include lifetime asthma prevalence, which is determined by an affirmative response to the question "Has a doctor or other health professional ever told you that you had asthma?" (added in 1997); asthma attack prevalence, which is determined by an affirmative response to the question "During the past 12 months, have you had an episode of asthma or an asthma attack?" (added in 1997); and current asthma prevalence, which is determined by a positive response to the question "Do you still have asthma?" (added in 2001). In this report, 12-month asthma period prevalence estimates are presented as counts and as a percent of the civilian, noninstitutionalized U.S. population for 5-year intervals during 1980--1995 (1980, 1985, 1990, and 1995). Current asthma prevalence estimates are expressed as average annual counts and as average annual percents of the civilian, noninstitutionalized population for the 3-year period 2001--2003 and as counts and as a percent of the civilian noninstitutionalized U.S. population for single years during 2001--2004. Asthma attack estimates are expressed as average annual counts of persons who had at least one asthma attack during the preceding 12 months, as average annual prevalence in the population, and as average annual percentages of those with current asthma for the 3-year period 2001--2003. Single-year estimates are provided during 1997--2004 for the number of persons reporting an asthma attack during the preceding 12 months, the percentage of the population reporting an asthma attack during the preceding 12 months, and the percentage of those with current asthma reporting an asthma attack during the preceding 12 months. Physician Office VisitsPhysician office visit data were collected through NAMCS during 1973--1981, in 1985, and annually since 1989 (24). NAMCS collects data on patient visits from a random sample of office-based physicians. In this report, average annual estimates of office visits with asthma coded as the first listed diagnosis are presented for detailed demographic groups for the 3-year period 2001--2003. Estimates for physician office visits are presented for 5-year intervals during 1980--1995 and for single years during 2000--2004. Hospital Outpatient Visits and Emergency Department VisitsNCHS collects both hospital outpatient and emergency department visit data using NHAMCS; this survey has been administered annually since 1992 (25). Information about patient visits is collected from a sample of nonfederal, general, and short-stay hospitals (including children's hospitals) with emergency or outpatient departments. In this report, average annual estimates are presented for the number of asthma visits by detailed demographic groups for the 3-year period 2001--2003. Estimates for asthma hospital outpatient visits and for emergency department visits are presented for 1992, 1995, and for single years during 2000--2004. Hospital DischargesNCHS has collected hospital discharge data through NHDS since 1965 (26). Data from discharge records for inpatient stays are collected from a sample of nonfederal, general, and short-stay specialty hospitals. Race information was not reported for a large proportion of hospital discharge records (5%--30%). Consequently, discharge records for which race was not reported were excluded from race-specific calculations but were included otherwise. A study of NHDS race data determined that hospitals that did not report race probably had a higher proportion of white discharges than hospitals that did report race (27). As a result, the differences between race groups might be smaller than the estimates in this report indicate. In this report, average annual estimates for hospital discharges for asthma by detailed demographic groups for the 3-year period 2001--2003 are presented. Estimates for asthma hospital discharges are shown for 5-year intervals during 1980--1995 and for single years during 2000--2004. MortalityDeath records for which asthma was recorded as the underlying cause of death were obtained from the mortality component of NVSS (21). Under ICD-9, which was used during 1979--1998, asthma was coded as 493 (4). Under ICD-10, which has been used since 1999, asthma is coded as J45 and J46 (5). Changes in ICD affected the comparability of data coded according to the different revisions. The asthma comparability ratio for the entire population was 0.89, which indicated that 11% of the decline in asthma mortality from 1998 to 1999 was a result of the ICD revision (28). In this report, average annual deaths and death rates for the 3-year period 2001--2003 with asthma as the underlying cause are presented for detailed demographic groups. Asthma deaths and death rates are shown for 5-year intervals during 1980--1995 and for single years during 2000--2004. ResultsAsthma Prevalence and AttacksFor the 3-year period 2001--2003, an average annual 20 million persons in the United States had asthma (Table 1). Of these, approximately 6.2 million were children (aged <18 years) and 13.8 million were adults. Approximately 2 million persons were aged >65 years. Current asthma prevalence was higher in children (8.5%) than in adults (6.7%) and higher in females (8.1%) than in males (6.2%) (Table 2). Male children (9.6%) had higher prevalence than female children (7.4%), but male adults (4.9%) had lower prevalence than female adults (8.4%). The difference in prevalence between blacks and whites was greater for children (12.5% versus 7.7%) than for adults (7.6% versus 6.7%). In general, Hispanics (5.4%) had lower current asthma prevalence than non-Hispanics (7.4%); however, Hispanics of Puerto Rican ancestry (14.5%) had higher prevalence than Hispanics of Mexican ancestry (3.9%). Asthma prevalence rates were higher in the Northeast (8.1%) than in the other three regions and higher in the Midwest (7.5%) than in the South (6.7%) or West (6.8%). Asthma was more prevalent among persons with family income below the federal poverty threshold (10.3%) than among persons with family income at or above the federal poverty threshold (6.4% to 7.9%). The estimated number of persons with self-reported asthma during the preceding 12 months increased from approximately 6.8 million (3.1%) in 1980 to 14.9 million (5.6%) in 1995 (Tables 3 and 4). During that period, 12-month asthma prevalence in children increased from 3.5% to 7.5%, and 12-month asthma prevalence in adults increased from 2.9% to 5.0%. On the basis of single-year data, a significant linear increase in the 12-month asthma prevalence rate during 1980--1996 occurred (Figure 1). No significant change was observed in the age-adjusted current asthma prevalence rate during 2001--2004 (7.3%, 7.2%, 6.9%, and 7.1%, respectively) (Table 4). An average annual 11.6 million persons reported at least one asthma attack during the preceding 12 months; 7.5 million were adults and 4.1 million were children (Table 5). Average annual attack prevalence represents asthma attacks in the entire population, not just among those with asthma; therefore, the average annual attack prevalence is affected by varying levels of asthma prevalence among different demographic groups. Children (5.6%) were more likely to experience at least one asthma attack during the preceding 12 months than were adults (3.6%), females (4.8%) were more likely than males (3.5%), and male children (6.5%) were more likely than male adults (2.3%). Female adults and female children were equally likely (4.8%) to experience at least one asthma attack during the preceding 12 months (Table 6). The same general pattern existed within each of the racial and ethnic subgroups; however, the differences were not always statistically significant. The exception to this was among black females: black female children (7.1%) had a higher rate of an attack during the preceding 12 months than black female adults (5.4%). Among regions, the rate of asthma attacks during the preceding 12 months was higher in the Northeast than in the South or West. Among the poverty threshold groups, the rate for asthma attacks during the preceding 12 months was higher in persons with a family income below the federal poverty level. Among persons with current asthma, 55.6% had one or more asthma attacks during the preceding 12 months (Table 7, Figure 2). In addition to a higher prevalence of asthma, females (56.8%) with current asthma were more likely to have had an attack during the preceding 12 months than males (54.0%), and children (63.1%) were more likely to have had an attack during the preceding 12 months than adults (52.2%). Male children with current asthma were more likely than male adults (64.4% versus 46.2%), and female children with current asthma were more likely than female adults (61.2% versus 55.5%) to have had an attack during the preceding 12 months. No difference was observed in the occurrence of asthma attacks during the preceding 12 months for persons with current asthma among race groups, nor between Hispanics and non-Hispanics. However, among the Hispanic subgroups, persons with current asthma of Puerto Rican descent (62.3%) were more likely to have had an asthma attack during the preceding 12 months than persons of Mexican descent (51.4%). Persons with current asthma and family income at least 4.5 times higher than the federal poverty level (52.9%) were less likely to have had an asthma attack during the preceding 12 months than persons in the lower federal poverty level groups (56.6% to 58.8%). Approximately 11 million persons reported an asthma attack each year during 1997--2004 (Table 8). No discernable trend was observed in the percent of the population reporting an asthma attack during the preceding 12 months (Table 9, Figure 1); however, a significant decline was observed in the percent reporting an asthma attack in 2003 (3.9%) when compared with 2002 (4.3%). In 2001, a total of 55.6% of persons with current asthma reported an attack during the preceding 12 months (Table 10); in 2004, 54.0% reported an attack (decrease not significant). However, a significant decline was observed in reported attacks among those with current asthma in 2003 (53.0%) when compared with 2002 (56.4%). Physician Office VisitsFor the 3-year period 2001--2003, an average annual 12.3 million physician visits for asthma was calculated (Table 11). Adults (7.6 million) had more visits than did children (4.7 million). An average annual 61.2 office visits for asthma per 100 persons with current asthma was calculated for 2001--2003 (Table 12). Adults (54.6 per 100 persons with current asthma) had a lower at-risk--based office visit rate than did children (76.1 per 100 persons with current asthma). The at-risk--based office visit rate for whites (67.8) was higher than the rate for blacks (37.8). The rates for persons aged >65 years (118.8) and aged <4 years (164.3) were higher than the rates for each of the other age groups. An estimated 5.9 million physician office visits for asthma was calculated for 1980 (excluding Alaska and Hawaii), and 13.6 million was calculated for 2004 (including Alaska and Hawaii) (Table 13). No differences were observed in the number of visits between consecutive 5-year periods or between consecutive single years during 2000--2004. Overall, more visits occurred in 2002, 2003, and 2004 than in 1990. For men, during 2000--2004, the number of visits was higher for each year than the number of visits in either 1990 or 1995. For women, only the number of visits for 2002 was higher than the number for 1990. The numbers of visits in 2001, 2002, 2003, and 2004 were higher than the number of visits in 1990 for whites; no increase in the estimated number of visits since 1990 occurred for blacks, despite increases in the estimated number of blacks with asthma (Table 3). No differences were observed between consecutive 5-year periods in physician office visit rates for asthma per 10,000 population or between consecutive single years during 2000--2004 (Table 14). However, the population-based rates were higher in 2001, 2002, 2003, and 2004 (409.7, 457.5, 448.6, and 468.1, respectively) than they were in 1990 (290.8), indicating a gradual increase in the rate of physician office visits for asthma per 10,000 population. The population-based rates for whites and the rates for males followed the same pattern of gradual increase, but the rates for blacks showed no change since 1990. For women, the rate in 2002 (549.3) and the rate in 2004 (514.8) were higher than the rate in 1990 (358.2). For each of the years during 2002--2004, the rates for children were higher than in 1990, but the rate for adults has not increased since 1990. No differences were observed between population-based rates for recent years and the rate in 1990 in either the Northeast or the West. However, in the South and Midwest, the population-based rates in 2003 (428.0 and 453.8, respectively) and in 2004 (455.6 and 455.2, respectively) were higher than the rates for 1990 (231.0 and 223.0, respectively). In 1980, a total of 87.6 office visits for asthma per 100 persons with 12-month prevalence (excluding Alaska and Hawaii) was calculated, and in 2004, a total of 66.4 office visits per 100 persons with current asthma (including Alaska and Hawaii) was calculated (Table 15). The survey coverage change in 1989 (Alaska and Hawaii were added), and the definitional change in asthma prevalence in 2001 limited the comparisons that could be made. No changes were observed in at-risk--based physician office visit rates from 1985 to 1990 under the definition of 12-month prevalence, nor between any of the years from 2001 to 2004 under the definition of current asthma prevalence for the total population or for any of the demographic subgroups. Changes over time in the number of office visits (Table 13) and the population-based rate of office visits (Table 14) appear to be a consequence of the increase in asthma prevalence. Hospital Outpatient VisitsFor the 3-year period 2001--2003, an average annual 1.3 million hospital outpatient department visits for asthma was calculated (Table 16). The number of visits did not vary significantly between children (651,700) and adults (689,500) or between males (565,200) and females (502,300). The estimated number of visits for whites (845,800) was higher than for blacks (444,700). Hispanics had fewer visits (231,900) than non-Hispanics (1,109,200). An average annual 6.7 hospital outpatient visits per 100 with current asthma was calculated for the 3-year period 2001--2003 (Table 17). The at-risk--based rate of hospital outpatient visits was higher for children (10.5 per 100 children with current asthma) than for adults (5.0), and highest for children aged <4 years (20.9). The rate was higher for blacks (14.2) than for whites (5.5), higher for black children (19.9) than for white children (8.7), and higher for black adults (10) than for white adults (4.3). The black-white difference was not significant in the age group <4 years but was significant in all other age groups. Although Hispanics appeared to have higher at-risk--based outpatient department rates than non-Hispanics, none of the observed differences was significant. Although the at-risk--based outpatient visit rate was higher in the Northeast (9.1) than in the West (3.6), other regional comparisons were not different. In 1992, a total of 644,000 hospital outpatient department visits for asthma occurred (Table 18). By 1995, the number of hospital outpatient department visits for asthma had increased to 1.3 million. The number of outpatient visits increased from 1992 to 1995, but no measurable increase occurred after 1995. The rate of outpatient visits per 10,000 population was higher in 1995 (49.2) than in 1992 (25.0), with no measurable change since 1995 (Table 19). The rate of outpatient visits per 10,000 population was higher in 2004 than in 1992 for females, for blacks, for non-Hispanics, for children, and in the South. The population-based rate in 2004 was not different from the rate in 1995 for any of the demographic subgroups, except for whites. In contrast, the at-risk--based rates of outpatient visits per 100 persons with asthma, when calculated using 12-month prevalence counts, indicated no change from 1992 (5.2 per 100 with asthma) to 1995 (8.7 per 100 with asthma) (Table 20). Nor was there any change in the rates between 2001, 2002, 2003, and 2004 when calculated using current prevalence counts (6.3, 6.1, 7.6, and 5.1 per 100 persons with current asthma, respectively). The increase in population-based rates from 1992 to 1995 (Table 19) was a result of the increase in asthma prevalence during this time. Emergency Department VisitsAn average annual 1.8 million emergency department visits for asthma was calculated for the 3-year period 2001--2003 (Table 21); 1.1 million visits were for adults and 696,900 visits were for children. More visits were made by female adults (718,200) than male adults (357,100), but more visits were made by male children (423,800) than female children (273,100). For the 3-year period 2001--2003, an average annual 8.8 emergency department visits for asthma per 100 persons with current asthma was calculated (Table 22). Children (11.2 per 100 with current asthma) had higher at-risk--based emergency department visit rates than adults (7.8 per 100 with current asthma). Children aged <4 years had the highest at-risk--based rate of emergency department visits (25.9). No difference was observed in the at-risk--based rate for emergency department visits by sex. Blacks (21.0) had a higher at-risk--based rate of emergency department visits than whites (7.0). Overall, Hispanics (12.4) had higher rates of at-risk--based emergency department visits than did non-Hispanics (8.4). At-risk--based emergency department rates were higher in the Northeast and the South than the West (10.4, 9.6, and 6.7, respectively). Among children aged <4 years, none of the sex, race, ethnicity, or regional differences was significant. In 1992, a total of 1.5 million emergency department visits for asthma occurred (Table 23). The number of visits increased to 1.9 million in 1995, after which no changes were observed through 2004 (1.8 million visits). No increase occurred in the number of visits for men until 2002. For women, an increase occurred in 1995, after which no other changes were observed. Population-based rates for asthma emergency department visits (Table 24) closely paralleled the number of visits (Table 23). An increase in the rate of emergency department visits for asthma occurred from 1992 to 1995, with no change afterwards. When at-risk--based emergency department visit rates for asthma were calculated (Table 25), no changes were observed. From 1992 to 1995, the only demographic subgroup that experienced an increase in the at-risk-based emergency department visit rate was the age group 35-64 years. From 2001 to 2004, subgroup comparisons indicated changes for males from 2001 to 2002 and for Hispanics from 2001 to 2003, but the period of time is too brief to discern if these short-term changes will translate into long-term trends. The emergency department visit rates based on persons with current asthma (2001-2004) should not be compared with the rates for previous years because of the change in the definition of asthma prevalence. Hospital DischargesFor the 3-year period 2001--2003, an average annual 504,000 asthma hospital discharges was caclulated; 299,300 of the discharges were for adults and 204,700 were for children (Table 26). Females had more hospital discharges for asthma (299,400) than males (204,500). Female children (75,200) had fewer discharges for asthma than male children (129,400). For the 3-year period 2001--2003, an average annual 2.5 asthma hospital discharges per 100 persons with current asthma was calculated (Table 27). Adults had a lower at-risk--based hospitalization rate (2.2 per 100 with current asthma) than children (3.3). Among age groups, the highest at-risk--based hospitalization rate occurred in children aged <4 years (10.0 per 100 children aged <4 with current asthma). The lowest at-risk--based asthma hospitalization rates occurred in persons aged 20--24 (0.9) and 15--19 years (0.8). The difference in the at-risk--based hospitalization rates between males (2.4 per 100 with current asthma) and females (2.6) of all ages and between male and female children was not significant. However, the at-risk--based hospitalization rate for female adults (2.5 per 100 with current asthma) was higher than that for male adults (1.6). In addition, females had higher at-risk--based hospitalization rates than males in the age groups 15--34, 35--64, and >65 years. Because of the large number of hospital records for which race was not reported, the at-risk--based hospitalization rates for race groups were underestimated. Most discharges lacking race data represented white persons (27); therefore, the differences between race groups are likely to be smaller than estimated in this report. The at-risk--based hospitalization rate for blacks (4.2 per 100 with current asthma) was 2.5 times that for whites (1.7 per 100 with current asthma). Black males, black females, and black children had higher rates than their white counterparts. Among children aged <4 years, no significant differences were observed between black and white rates; in the other age groups, differences between black and white rates were significant. The differences between the at-risk--based hospitalization rates for the four regions (all ages) were not significant. Among adults, the at-risk--based hospital discharge rates in the Northeast (2.7 per 100 with current asthma) and the South (2.2) were higher than in the West (1.7). Although considerable variation was observed in the number of hospital discharges with asthma as the first listed diagnosis (Table 28), none of the differences between consecutive 5- or 1-year periods was significant. The fewest asthma discharges occurred in 1980, and the most occurred in 2003; the estimated number of asthma discharges was higher only in 1995 (510,600) and 2003 (574,100) than in 1980 (408,300). This slight increase in 2003 probably was not a result of the hospital discharge survey sampling process because a similar increase was observed in state hospital discharge data, which were not based on samples. Using single-year data for the entire 25-year period 1980--2004 (Figure 3), a small but significant increasing trend was observed in the number of hospital discharges for asthma. For 1985, 1990, 1995, and during 2000--2004, consecutive year-to-year differences in the number of hospitalizations for either males or females were not large enough to be meaningful. No changes were observed in the number of hospitalizations for asthma in adults between any of the years shown. However, for children, more hospitalizations for asthma occurred in 1995, 2000, 2002, 2003, and 2004 than in 1980. Most of the increase in hospitalizations for asthma since 1980 occurred among children aged <4 years. Differences by race could not be interpreted because of the large and increasing number of discharges for which the race of the patient was not known and because of the addition of the multiple-race category in 2000. Asthma hospitalizations, expressed as a population-based rate (Table 29), remained stable during 1980--2004. Although asthma hospitalization rates varied from 16.4 per 10,000 population in 2001 to 19.9 in both 1985 and 2003, none of the rates was different from the rate in 1980. Using single-year data for 1980--2004, a small but statistically significant decreasing trend in the population-based rate of hospital discharges for asthma was observed (Figure 3). For most of the demographic subgroups (Table 29), a decline was observed in the population-based hospitalization rate at some point during 1980--2000, followed by a return to the 1980 level in 2003 and a return to a lower rate in 2004. A notable exception to this pattern was observed among children aged <4 years, among whom rates increased from 1980 to 1985 and remained high through 2004. Because of the change in race categorization and the large number of discharges for which race was not reported, the rates for blacks after 2000 were not comparable to the rates before 2000; however, the effect on trends probably is minimal. Finally, among regions, only the Northeast had a higher rate for asthma hospitalizations in 2003 than in 1980, followed by a decline in 2004. The at-risk--based hospital discharge rates per 100 persons with 12-month asthma prevalence (Table 30) for 1995 were lower than the rates for 1980 for the total population (3.4 versus 6.0 per 100 persons with 12-month asthma) and for the demographic subgroups with the exception of children, age groups <4 and 5--14 years, and in the Northeast. The at-risk--based hospitalization rates per 100 persons with current asthma during 2001--2004 could not be compared with the rates for earlier years because of the change in the asthma prevalence definition. DeathsFor the 3-year period 2001--2003, an average annual 4,210 deaths from asthma occurred (Table 31). Relatively few deaths from asthma occurred in persons aged <18 years (200). Approximately 50% of asthma deaths occurred in persons aged >65 years. More women (2,693) than men died of asthma (1,517). At-risk--based death rates were higher for each older age group (Table 32). For each age group through age 25--34 years, the death rate from asthma was <1 per 10,000 persons with asthma. The highest at-risk--based death rate was in persons aged >65 years (10.5 per 10,000 with current asthma). Females had higher at-risk--based death rates than males (2.3 and 1.8, respectively). For most age groups, males had higher rates than females; only for persons aged >65 years was the rate for females (11.3 per 10,000 with current asthma) higher than for males (9.1). Blacks had higher at-risk--based death rates (3.4) than whites (1.9). This was true for males and females, adults and children, and for each age group. Among regions, the highest asthma death rate per 10,000 with current asthma occurred in the West (2.5). In 1980, a total of 2,891 deaths occurred with asthma as the underlying cause (Table 33). More deaths occurred at each 5-year interval until 1995. A linear increase occurred in the number of asthma deaths based on single-year data from 1980 to 1998. Although asthma deaths increased from 1980 to 1995, an insufficient number of years remain under ICD-9 coding to determine whether the number of deaths for 1996--1998 reflected a plateau or a decline (3). In 1999, ICD-9 coding was replaced with ICD-10 (4,5). A decline in asthma deaths occurred from 1998 to 1999 in addition to the decline (approximately 11%) resulting from the ICD revision. Under ICD-10 coding, the number of asthma deaths has declined. For each recent year (2001, 2002, 2003, and 2004), the number of asthma deaths was lower than the number of deaths in 2000. Among virtually all the demographic groups, asthma deaths increased from 1980 to 1995. The only age group for which the number of asthma deaths did not increase from 1980 to 1995 was children aged <4 years. Although a decline has occurred in asthma deaths among all demographic groups since 2000, the decline was not significant for Hispanics, the "other race" category, or children. The number of deaths in 2004 was lower than in 2000 in each of the regions. On the basis of single-year data (Figure 4), a linear increase occurred in population-based asthma death rates during 1980--1988, followed by 10 years with no trend. Population-based rates for asthma deaths indicated that some of the increases in the number of asthma deaths before 2000 were a result of increases in the population size and distribution among the demographic groups (Table 34). This was particularly true for the changes from 1990 to 1995. The age-adjusted asthma death rates in 2004 were lower than those in 2000 for the total population, for both males and females, all race groups, adults (but not children), and each of the regions. From 1990 to 1995, both the number of deaths from asthma (Table 33) and the population-based asthma death rates (Table 34) increased. In contrast, from 1990 to 1995, at-risk--based rates decreased from 4.7 deaths per 10,000 with 12-month asthma to 3.8 deaths per 10,000 with 12-month asthma (Table 35). From 1990 to 1995, a decline was observed in males and females, whites, non-Hispanics, adults, and persons in the Northeast and West. No differences occurred between the asthma death rates per 10,000 persons with current asthma in 2003 and the rate in 2001 for any of the groups (Table 35). However, in 2004, at-risk--based rates declined for the total asthma population, males, whites, non-Hispanics, adults aged 35--64 years, and adults aged >65 years. Because of the definitional change in asthma prevalence in 1997 and the change in ICD coding in 1999, estimates for 1995 and earlier should not be compared with estimates for 2000 and later. DiscussionThis report is the third national surveillance summary on the burden of asthma. Data presented in this report extend the asthma data presented in the two earlier surveillance summaries (2,3). As with previous reports, this report includes counts and population-based rates for asthma prevalence measures, asthma health-care encounters (office visits, outpatient visits, emergency department visits, and hospitalizations), and asthma deaths. New in this report are expanded demographic detail for those estimates and the inclusion of at-risk--based rates. The denominator for the at-risk--based rate is the underlying population at risk (i.e., persons with asthma) rather than the entire population. These at-risk--based rates provide a clearer picture of asthma trends and disparities within the population of persons with asthma, for asthma attack prevalence, health-care--provider encounters (office visits, outpatient visits, emergency department visits, and hospitalizations), and deaths. The data in this report indicate that asthma prevalence increased in both counts (Table 3) and rates (Figure 1) under the definition of 12-month prevalence (used during 1980--1996). The increase in prevalence during 1980--1996 is substantiated by a report indicating that asthma incidence also increased during 1980--1996 (29). Determining whether prevalence has continued to increase is complicated by the absence of a prevalence measure from 1997 to 2000 and the change in the definition of asthma prevalence to current asthma in 2001. However, since 2001, no significant change in the current asthma prevalence rate has occurred. One example of the usefulness of at-risk--based rates is the analysis of asthma-related health-care encounters. Because at-risk--based rates declined or remained stable, it can be inferred that the increase in physician office visits from 1980 to 1995 and the increase in visits to hospital outpatient and emergency departments from 1992 to 1995 were caused by an increase in the prevalence of asthma in the population during 1980--1996. Similarly, at-risk--based rates can be used to clarify the analysis of asthma mortality. During 1980--1995, asthma-related mortality increased, but because at-risk--based mortality rates remained stable from 1980 to 1990 and declined from 1990 to 1995, it can be inferred that rising mortality was caused by the general increase in asthma prevalence. At-risk--based rates also can be used to clarify differences in asthma outcomes (e.g., attacks and health-care encounters) among various demographic groups. For example, population-based average annual attack prevalence estimates for the 3-year period 2001--2003 indicated that asthma attacks were relatively more prevalent in children than in adults, in females than in males, and in blacks than in whites (Table 6). However, using at-risk--based rates, no significant differences existed between blacks and whites (Table 6, Figure 2). The rate of health-care encounters was not significantly different between blacks and whites with asthma or between men and women with asthma, although differences did exist by site of encounter (Figure 5). Blacks used emergency departments and hospital outpatient departments more frequently for their asthma than whites. Although this analysis cannot determine the reasons for the place the visit occurred, one study indicated that the number of emergency departments, the convenience of emergency departments (e.g., time and proximity), limited community capacity for physician office visits and outpatient visits, and a "generic preference for emergency departments as a source of care for non-urgent problems" contributed to emergency department use (30). These differences in encounters by site require further study. The data in this report and in a report on asthma self-management (31) can be used as a measure of the national burden of asthma and by state health departments and other researchers as a comparison against which they can evaluate the populations they study. Adult and child prevalence data are available for all states through BRFSS and NSCH. Annual BRFSS data indicate considerable variation in adult asthma prevalence among the states, and limited data from the BRFSS adult asthma module also document variation in asthma control indicators among states with similar prevalence (32). Detailed asthma data from the BRFSS-administered Asthma Call-Back Survey will allow states to assess more completely the level of control and management in their asthma population. Although BRFSS is subject to all limitations associated with telephone-based surveys, including low response rates, national estimates of asthma prevalence from this state-based survey compare favorably (within 1-percentage point) with those from NHIS, which is conducted by personal interview and has considerably higher response rates. NACP funds grantees to implement interventions, develop partnerships, and expand their surveillance systems.
Grantees and their partners develop and implement interventions for persons with asthma, starting first with populations with
the highest burden or at highest risk for uncontrolled asthma. Improvements made through these state- and
city-level interventions are reflected in state- and national-level data. The data presented in this report indicate that increases
in prevalence drive increases in patient visits. Because no primary prevention strategies have been identified, NACP grantees
and their partners should continue efforts to control asthma through interventions that promote proper medical regimens
(e.g., use of appropriate medications and use of asthma action plans) and the reduction of exposures to causes of
asthma exacerbations (e.g., diesel exhaust, household exposures such as furry pets, and workplace exposure to chemicals). Efforts
to control and manage asthma are necessary to reduce the burden of asthma for persons with the disease.
LimitationsBecause no definitive laboratory test for asthma exists, differentiating asthma from other chronic obstructive pulmonary diseases is challenging. To provide some guidance for consistency across asthma studies, in 1998, the Council of State and Territorial Epidemiologists developed a case definition for asthma surveillance that established a framework on the basis of three distinct data sources: administrative databases, survey self-response, and medical records (33). Most of the asthma estimates in this report relied on the physician accurately diagnosing asthma. In addition to the diagnostic challenge, other data-related concerns included conveying the diagnosis to the patient, patient recall of the diagnosis, documenting asthma in patient records, and coding of asthma related events. Asthma estimates for mortality relied on the physician accurately attributing the death to asthma. Some of the data sources used in asthma surveillance (e.g., emergency department visits) are administrative in nature and were originally intended for billing purposes. These data might be influenced by third-party reimbursement practices. In addition, the asthma prevalence measures used in this report relied on self-reported survey data that required individual recall of the physician's diagnosis. The validity of self-reported asthma status in these data is unknown. Either the physician's diagnosis or the patient's recall of that diagnosis might be inaccurate. However, a 1993 review of asthma questionnaires documented a mean sensitivity of 68% (range: 48%--100%) and a mean specificity of 94% (range: 78%--100%) when self-reported asthma was compared with a physician's clinical diagnosis of asthma (34). Additional limitations associated with survey data include declining response rates, reliability of self-reported information, and the exclusion of households without telephones and the institutionalized population. The reliability of death certificate data for asthma has been questioned. Asthma mortality rates for older age groups have been assumed to be unreliable because of misreporting the cause of death in older persons with comorbid medical conditions. This assumption is often cited as the reason for limiting asthma analysis and research to persons in younger age groups. Certain studies have supported the assumption that coding asthma as the underlying cause of death results in an overestimation of the number of deaths from asthma in the elderly (35--43). However, a majority of these studies were conducted in countries where asthma mortality rates far exceed that in the United States; studies based within the United States were small and included very limited populations. In contrast, a larger and well-designed study concluded that asthma death coding had very high specificity (99%) and low sensitivity (42%), that asthma as a cause of death was underreported rather than overreported in preference to COPD (58% false negative, 1% false positive), and that no age effect existed (44). This study casts doubt on the assumption that coding of asthma deaths in older persons is unreliable in the United States. However, no representative study of asthma as an underlying cause of death in the NVSS has been reported. Making definitive conclusions about asthma trends are difficult because of point-in-time problems with asthma data and discrete events during the preceding 10 years. First, the change in the way NCHS conducted NHIS in 1997 and the new wording of the asthma questions affected the historic measure of asthma prevalence. These changes were made to improve data quality and in response to requests by data users. Second, the change from ICD-9 to ICD-10 coding for deaths in 1999 interrupted the mortality trend line. Finally, the 1997 OMB standards on race classification were implemented differently and at different times among the various data sources used in asthma surveillance. ConclusionThis report identifies significant changes over time in asthma prevalence, patient visit encounters, and deaths. The patterns identified using at-risk--based rates change conclusions resulting from population-based rates in important ways. Increases in asthma prevalence had a substantial role in the increases in patient encounter measures used in asthma surveillance and also accounted for the increases in the number of asthma deaths and population-based rate of death during 1980--1995. When death rates among those with current asthma are examined during 1980--1995, the rates decreased. In contrast, little change has been observed in at-risk death rates for asthma during 2000--2004, when prevalence did not change. Although some progress has been made in the clinical management and control of asthma, more than half of those with current asthma reported experiencing at least one attack during the preceding 12 months. CDC will continue to monitor national trends in prevalence, patient visit encounters, and mortality while working to increase the availability of data that can be used to measure the control of asthma symptoms at the national, state, and local level. References
* Period prevalence is the prevalence of a disease over a duration of time. During 1980--1996, 12-month asthma prevalence was determined by an affirmative response to the question, "During the past 12 months has anyone in the family had asthma?" † Each of the national health surveys and NVSS can be accessed at http://www.cdc.gov/nchs/express.htm. § School and work days lost because of asthma are not included in this report because of changes in the survey questions that make the results incomparable to the 2002 Surveillance Summary. ¶ Categorization of states in regions is available at http://www.census.gov/geo/www/us_regdiv.pdf. Table 1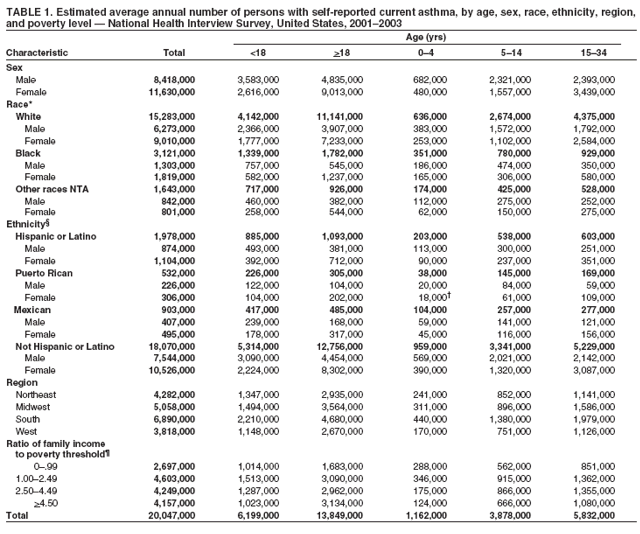 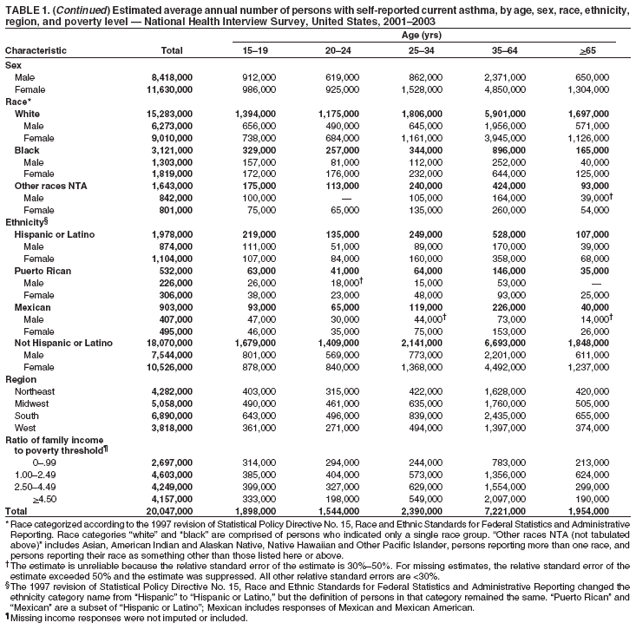 Return to top. Figure 1 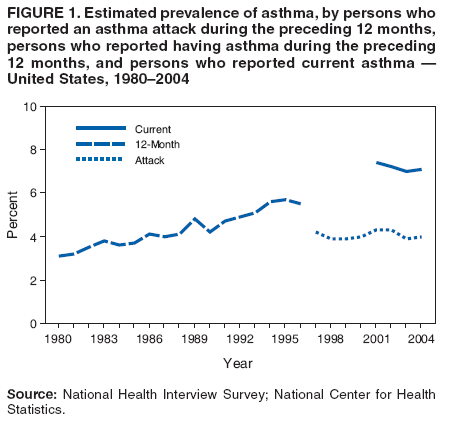 Return to top. Table 2  Return to top. Figure 2 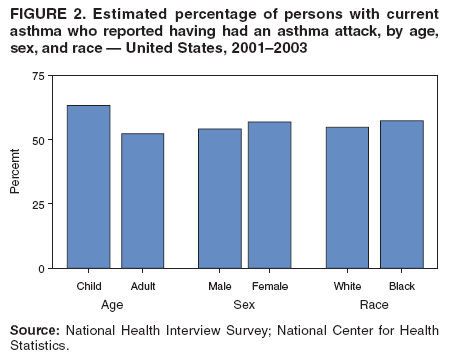 Return to top. Table 3 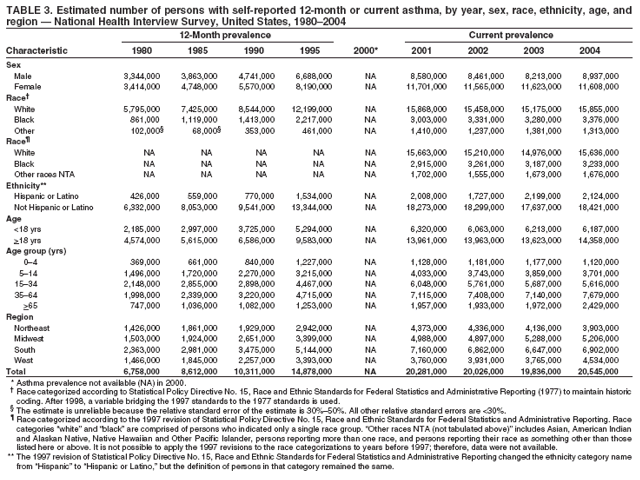 Return to top. Figure 3 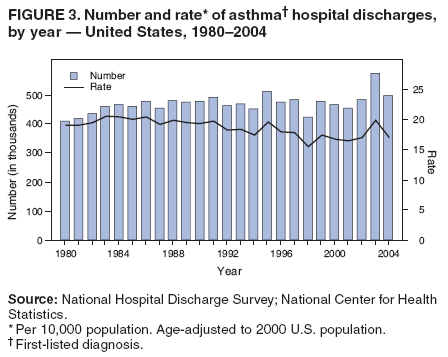 Return to top. Table 4 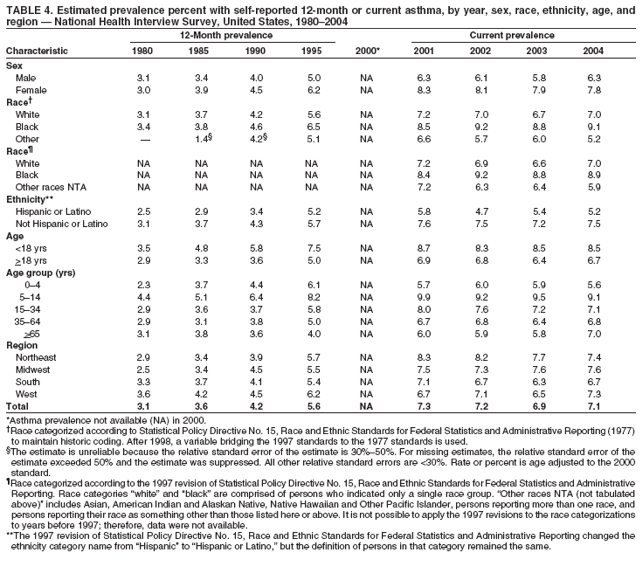 Return to top. Figure 4 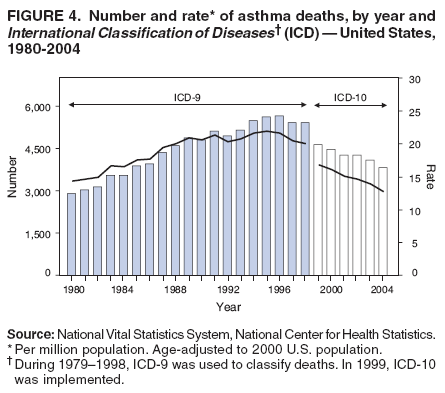 Return to top. Table 5 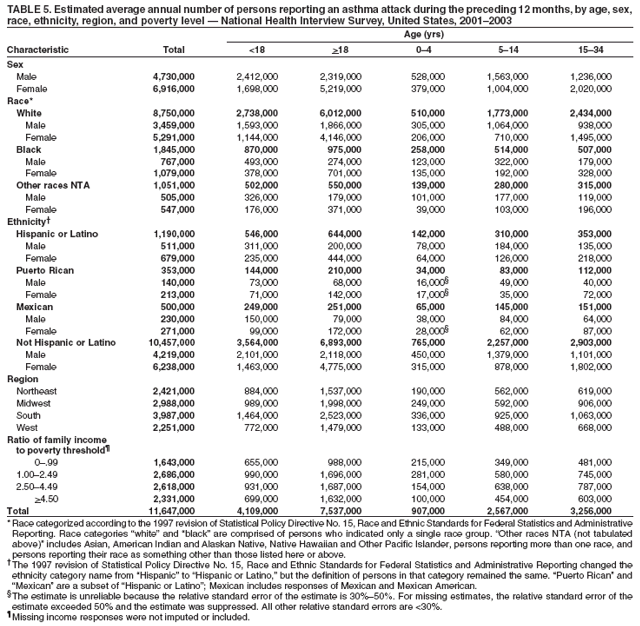 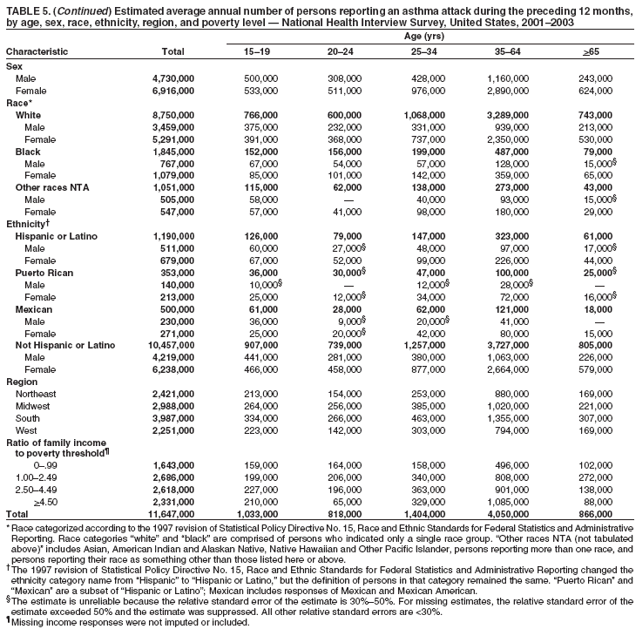 Return to top. Figure 5 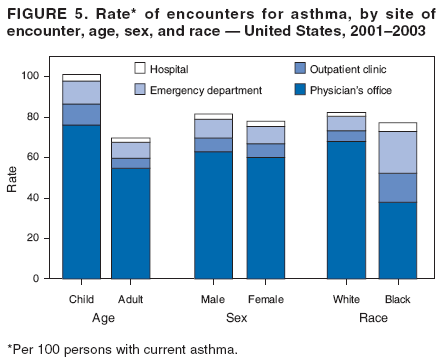 Return to top. Table 6 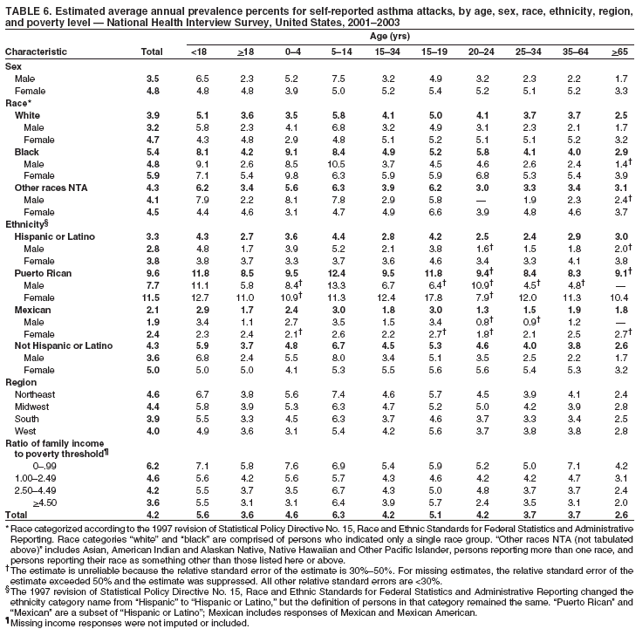 Return to top. Table 7 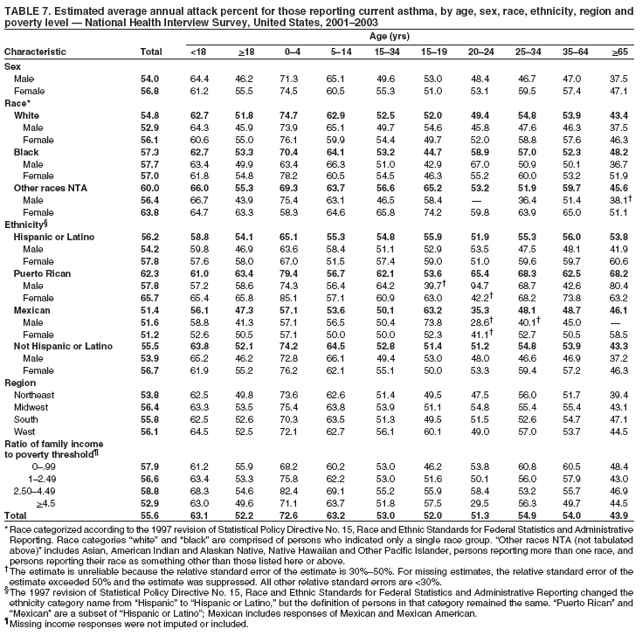 Return to top. Table 8 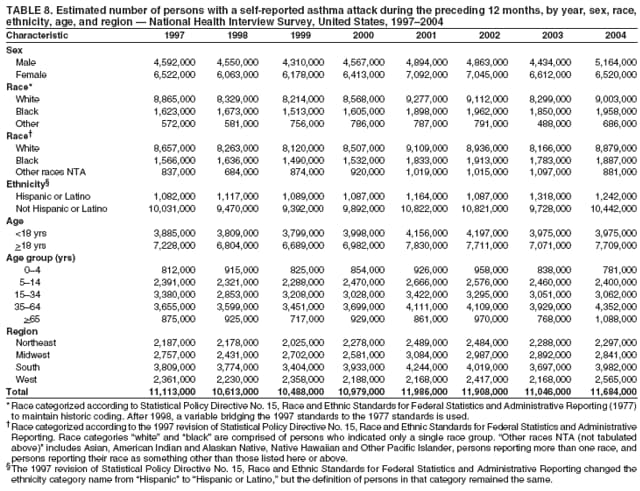 Return to top. Table 9 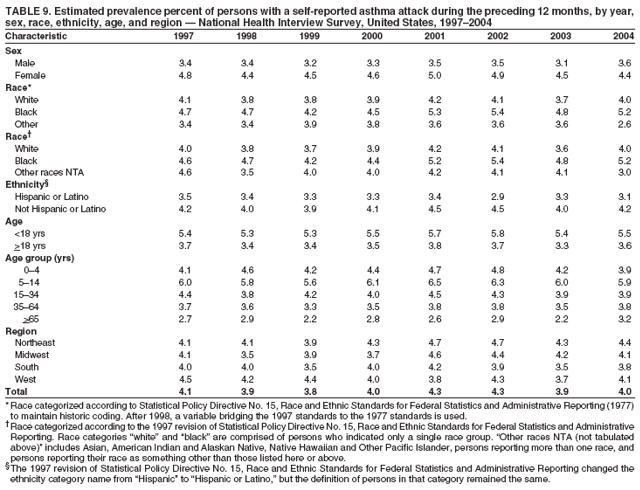 Return to top. Table 10 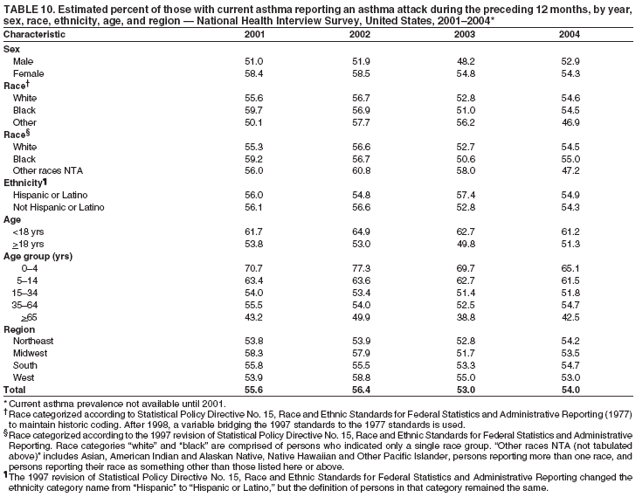 Return to top. Table 11 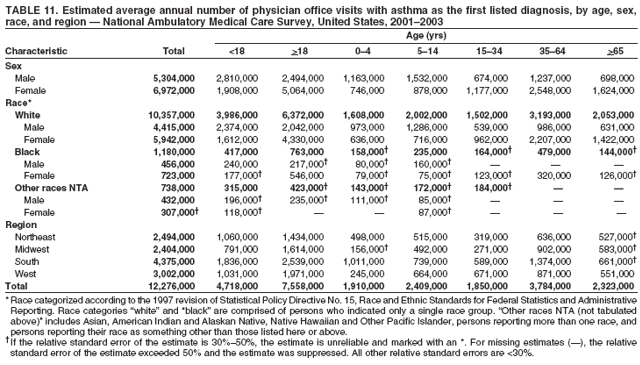 Return to top. Table 12 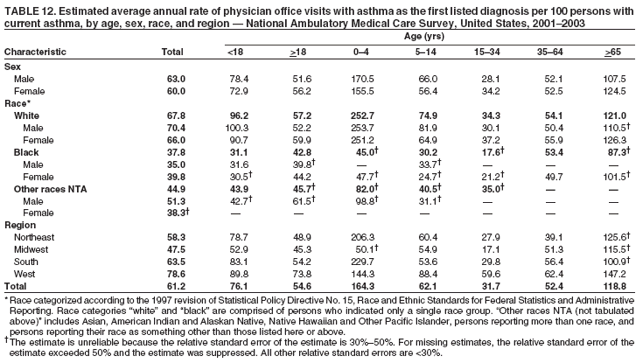 Return to top. Table 13 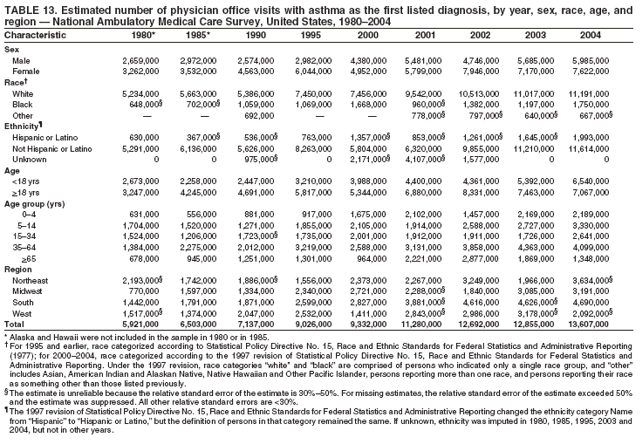 Return to top. Table 14 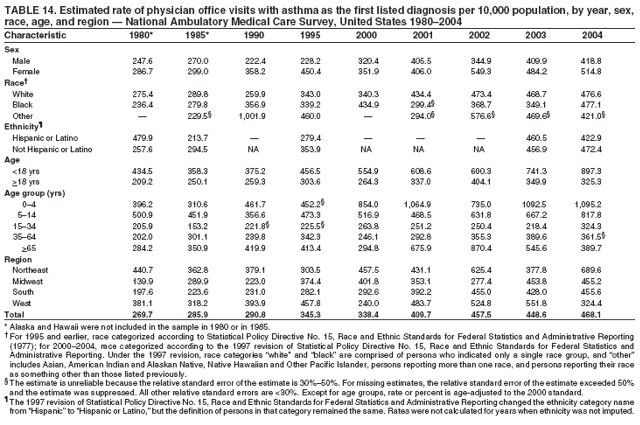 Return to top. Table 15 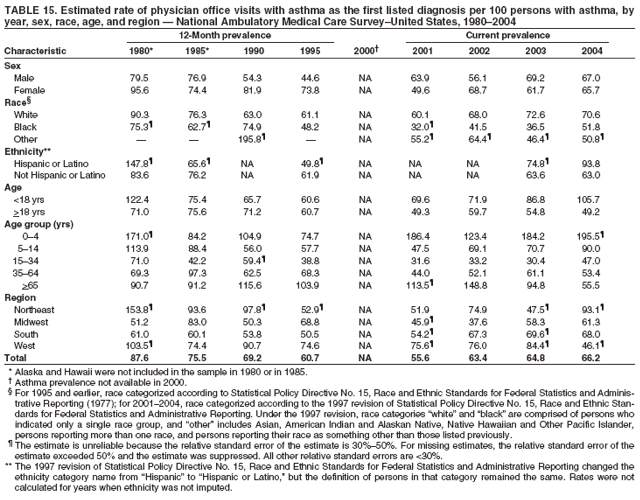 Return to top. Table 16 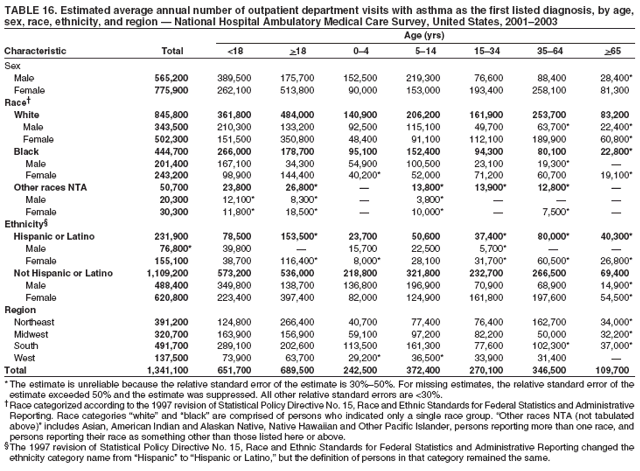 Return to top. Table 17 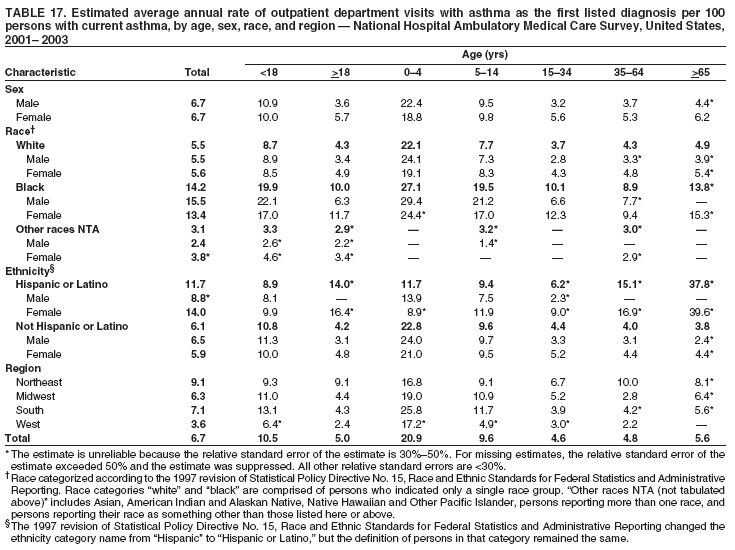 Return to top. Table 18 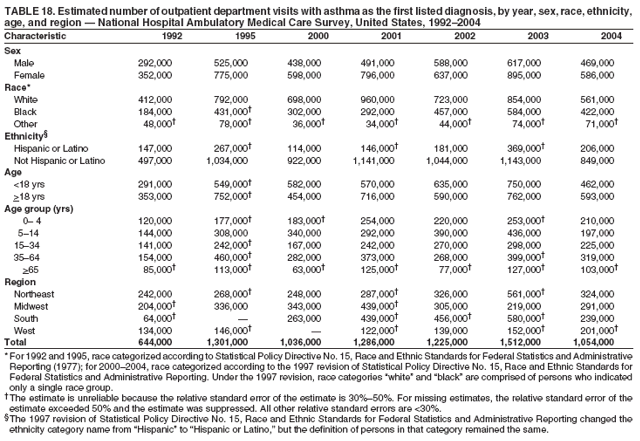 Return to top. Table 19 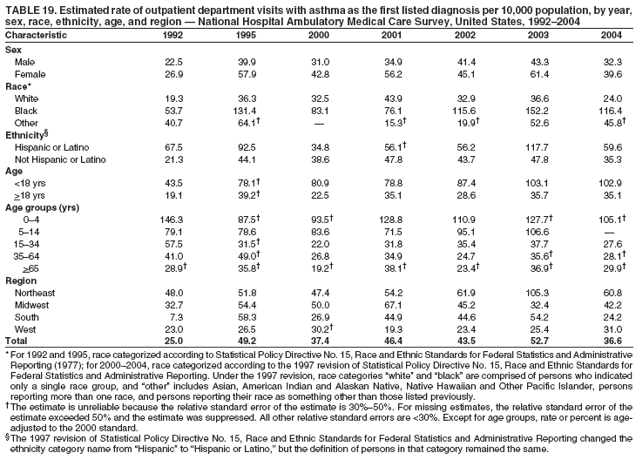 Return to top. Table 20 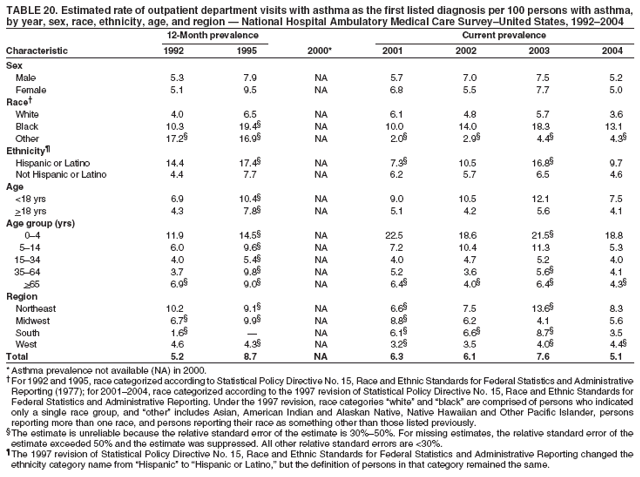 Return to top. Table 21 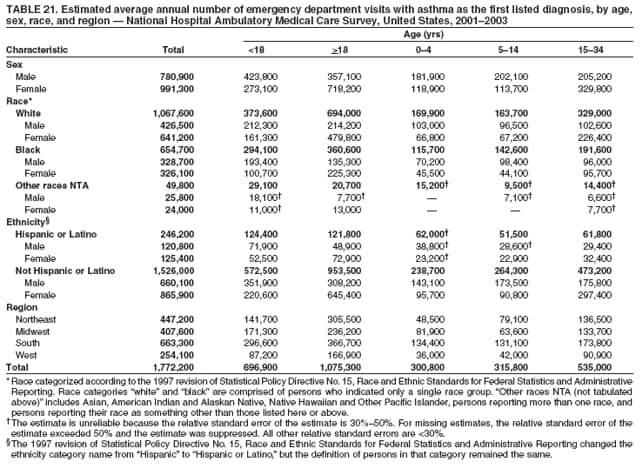 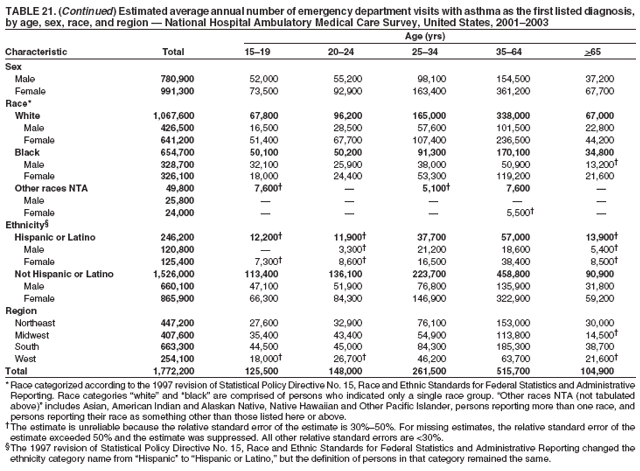 Return to top. Table 22 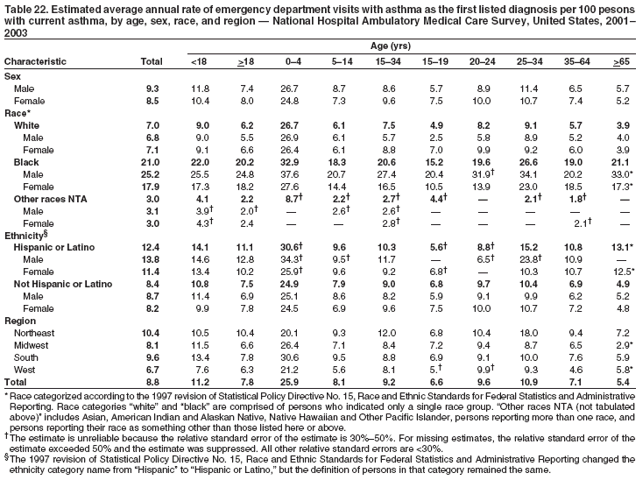 Return to top. Table 23 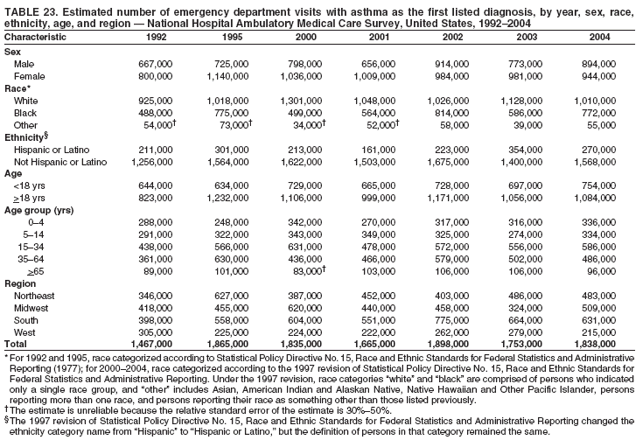 Return to top. Table 24 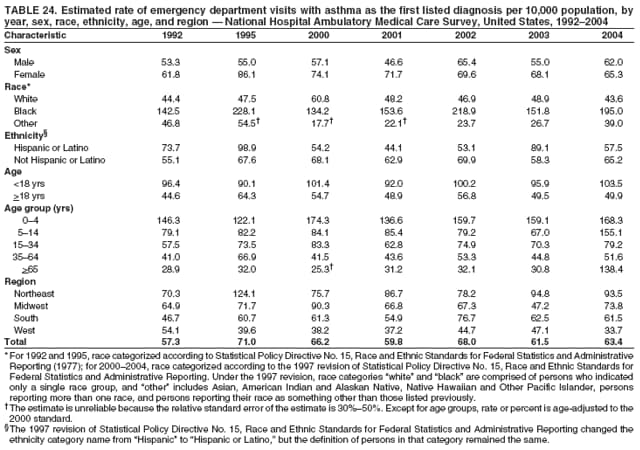 Return to top. Table 25 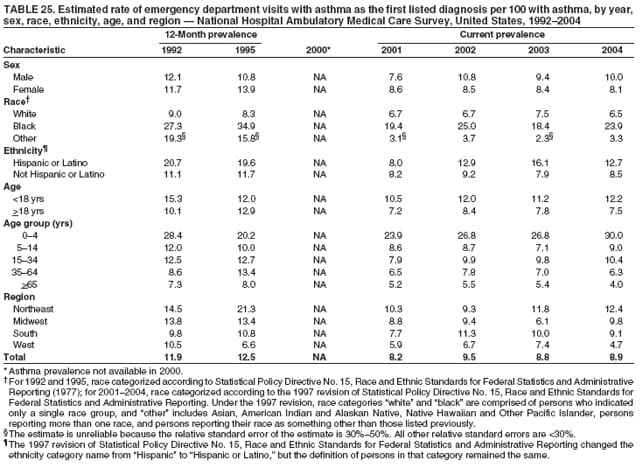 Return to top. Table 26 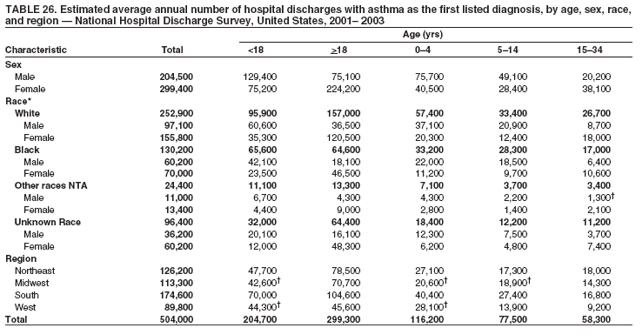 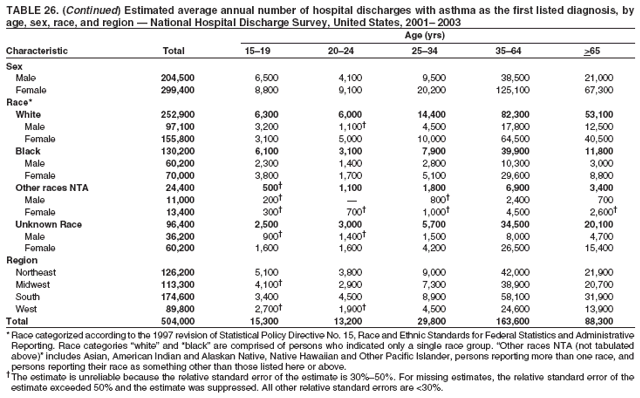 Return to top. Table 27 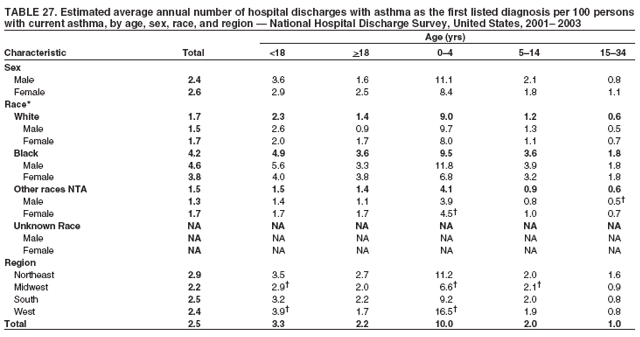 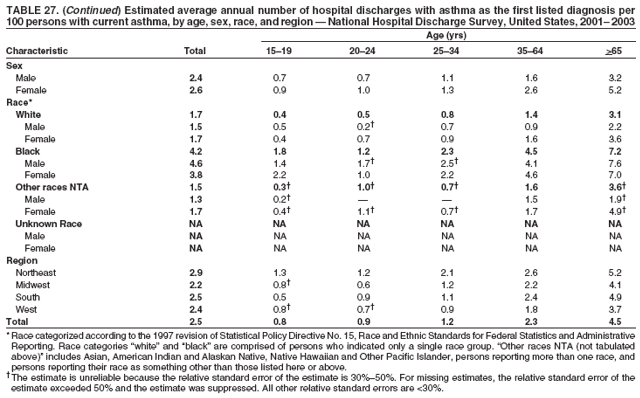 Return to top. Table 28 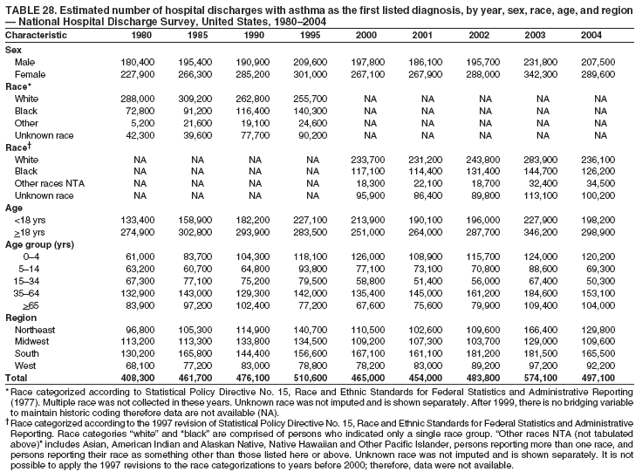 Return to top. Table 29 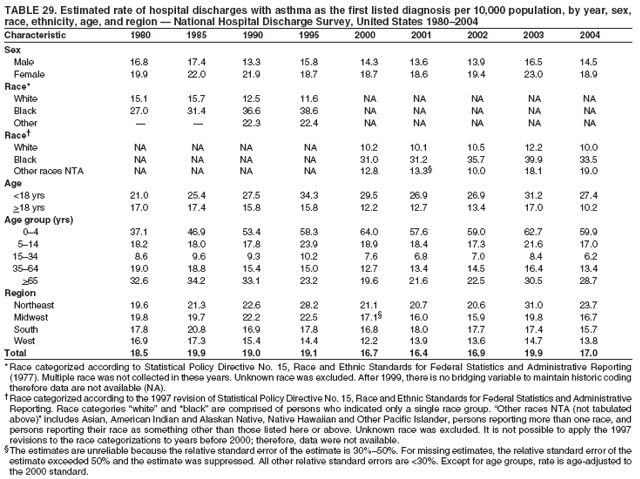 Return to top. Table 30 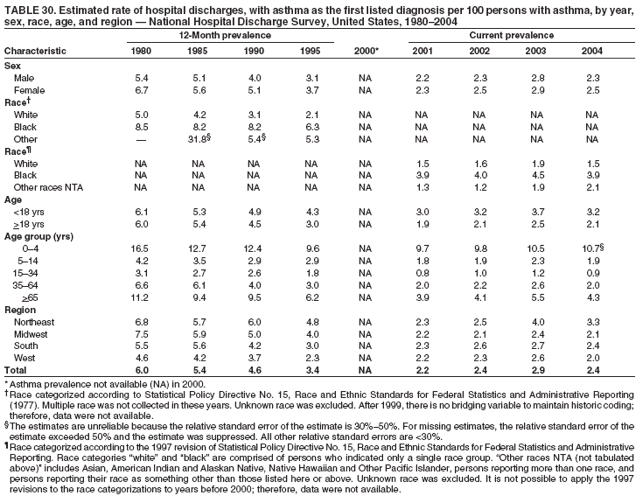 Return to top. Table 31 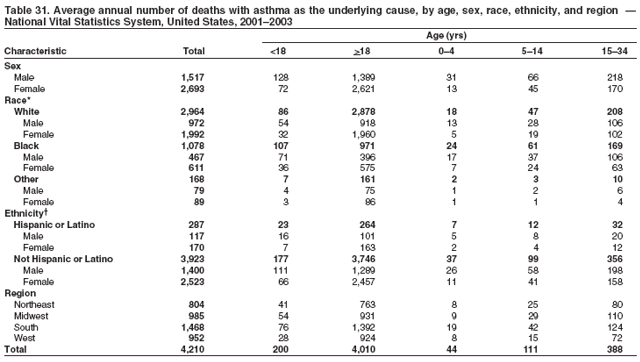 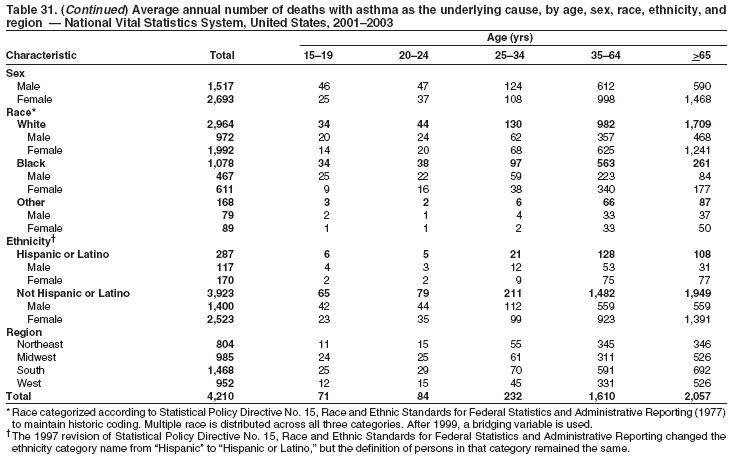 Return to top. Table 32 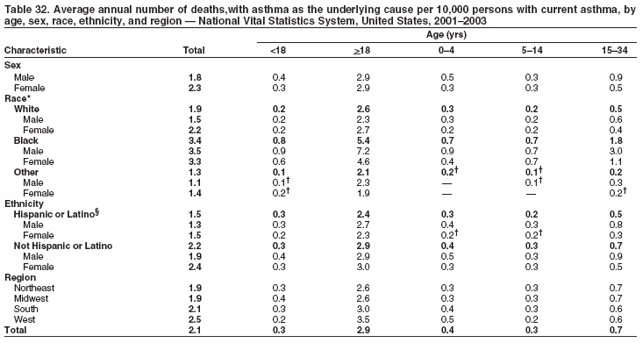 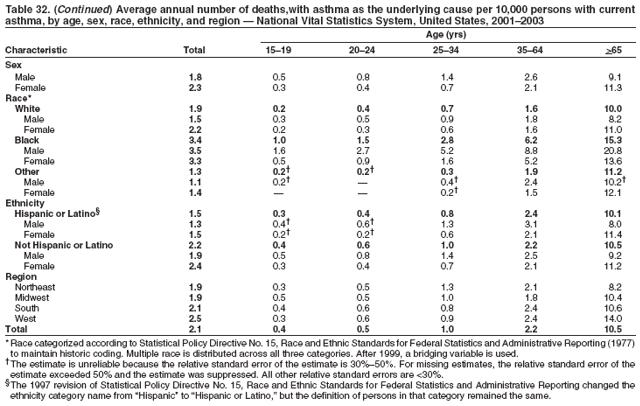 Return to top. Table 33 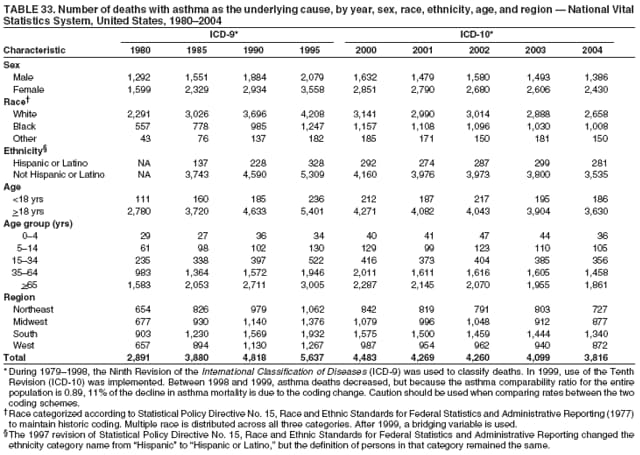 Return to top. Table 34 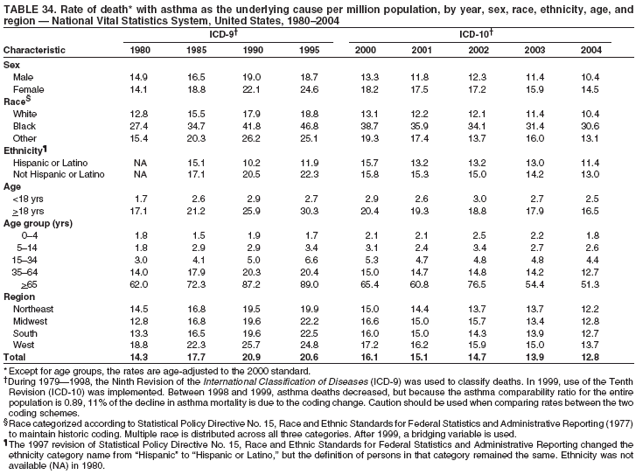 Return to top. Table 35 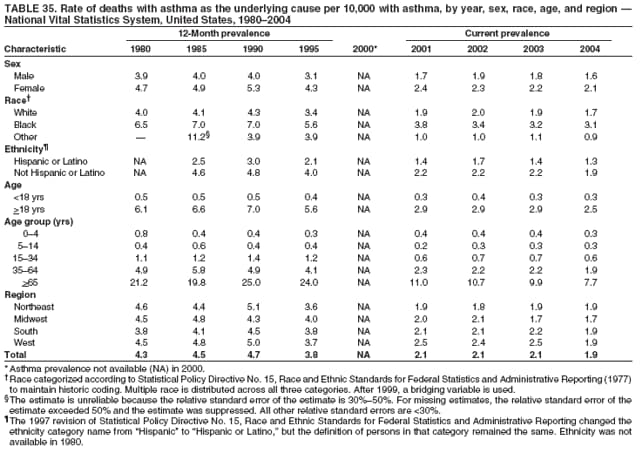 Return to top.
Disclaimer All MMWR HTML versions of articles are electronic conversions from ASCII text into HTML. This conversion may have resulted in character translation or format errors in the HTML version. Users should not rely on this HTML document, but are referred to the electronic PDF version and/or the original MMWR paper copy for the official text, figures, and tables. An original paper copy of this issue can be obtained from the Superintendent of Documents, U.S. Government Printing Office (GPO), Washington, DC 20402-9371; telephone: (202) 512-1800. Contact GPO for current prices. **Questions or messages regarding errors in formatting should be addressed to mmwrq@cdc.gov.Date last reviewed: 10/5/2007 |
|||||||||
|