 |
|
|
|
|
|
|
| ||||||||||
|
|
|
|
|
|
|
||||
| ||||||||||
|
|
|
|
|
Persons using assistive technology might not be able to fully access information in this file. For assistance, please send e-mail to: mmwrq@cdc.gov. Type 508 Accommodation and the title of the report in the subject line of e-mail. Fatal Injuries Among Children by Race and Ethnicity --- United States, 1999--2002Stephanie J. Bernard, PhD
Corresponding author: Leonard J. Paulozzi, MD, Division of Unintentional Injury Prevention, National Center for Injury Prevention and Control, 4770 Buford Hwy., N.E., MS K-63, Atlanta, GA 30341. Telephone: 770-488-1394; Fax: 770-488-1317; E-mail: lbp4@cdc.gov. AbstractProblem/Condition: In the United States, unintentional injury, homicide, and suicide are the first, second, and fourth leading causes of death among persons aged 1--19 years, respectively; the highest rates have occurred among minority populations. The effects of age on the difference in rates between white and minority children and the mechanisms of injury that contribute most to that difference have not been previously reported. Reporting Period Covered: Data are presented for fatal injuries among children in the United States by race/ethnicity and mechanism of injury during 1999--2002. Trends in injury mortality by race/ethnicity are provided for 1982--2002. Description of System: Fatal injury data were derived from death certificates reported through CDC's National Vital Statistics System. Results: During 1999--2002, among infants aged <1 year, American Indian/Alaska Natives (AI/ANs) and blacks had consistently higher total injury death rates than other racial/ethnic populations. Both populations had more than twice the rate of injury death compared with white infants. Black infants had the highest rates of unintentional suffocation and homicide, whereas AI/AN infants had the highest rate of motor-vehicle (MV)--traffic death. Among children aged 1--9 years, AI/ANs and blacks had the highest injury death rates. AI/ANs aged 1--9 years had the highest rates of MV-traffic death and drowning; in contrast, blacks aged 1--9 years had the highest rates of homicide and fire/burn death. Among children aged 10--19 years, AI/ANs and blacks consistently had higher total injury death rates than whites. AI/ANs aged 10--19 years had the highest rates of suicide and MV-traffic death, and blacks aged 10--19 years had the highest rates of homicide. The disparity in injury mortality rates by race/ethnicity during 1982--1985 had not declined by 1999--2002. Interpretation: Significant disparities in injury rates still exist between white and minority children. Disparities varied by age and mechanism of injury. Hispanics and Asian/Pacific Islanders consistently had lower risk, whereas AI/ANs and blacks consistently had higher risk for fatal injuries than other racial/ethnic populations. Public Health Actions: Educational, regulatory, and environmental modification strategies (e.g., home visitation programs, safety-belt laws, and swimming pool fencing) have been developed for each type of injury for use by health-care providers and government agencies. IntroductionUnintentional injury is the leading cause of death among U.S. children aged 1--19 years.* Homicide is the second leading cause, and suicide is the fourth. Mortality rates from injury, whether unintentional or intentional, are particularly high among certain racial/ethnic populations (1). Previous studies have examined differences in injury death rates according to race/ethnicity and have consistently documented that black and American Indian/Alaska Native (AI/AN) children are disproportionately affected (2). During the 1990s, injury death rates for black and AI/AN children were two to three times those for white children. In contrast, injury rates for Hispanic and Asian/Pacific Islander (A/PI) children were equal to or less than rates for whites (3--6). Injury death rates by mechanism and race/ethnicity have been documented for the entire population but not for children alone (7). This report summarizes death rates in the United States from both unintentional and intentional injury during 1999--2002 for children aged 0--19 years by race/ethnicity. This report also compares the racial/ethnic disparity in injury rates by race during 1999--2002 with the disparity during the 1980s and 1990s to determine whether progress had been made in addressing this problem. MethodsAnnual mortality files were used from CDC's National Vital Statistics System (NVSS), which collects death certificate data from vital statistics offices in the 50 states and the District of Columbia. The mortality coding system in the United States changed from the Ninth to the Tenth Revision of the International Classification of Diseases (ICD-9 and ICD-10) (8,9) in 1999. As a result, data before 1999 were not comparable to data for 1999 and later for certain mechanisms of injury. Therefore, analysis of specific injury mechanisms was restricted to 1999--2002. Historical time trends for unintentional and total injury for 1982--2002 have been included in this report. Cause of Injury DeathDuring 1999--2002, cause of injury death was coded based on ICD-10 external cause of injury codes. The underlying causes of death and the associated ICD external cause of injury codes and definitions have been presented (Table 1). In this report, the "all intents" category, typically referred to as "all injury" or "total injury," includes unintentional injuries, suicide, homicide, legal intervention, operations of war, and injuries of undetermined intent and their sequelae. Death rates per 100,000 children by race, ethnicity, intent, mechanism, and age were calculated by using CDC's Web-Based Injury Statistics Query and Reporting System (WISQARS) (10). Age was categorized into three groups: <1 year (infants), 1--9 years, and 10--19 years. For rate calculations, bridged-race intercensal, censal, and postcensal population estimates produced by the U.S. Census Bureau were used. These estimates resulted from bridging the 31 racial categories of the 2000 U.S. Census (specified in the 1997 Office of Management and Budget [OMB] standards for data collection on race/ethnicity) to the four racial categories specified under the 1977 standards used in this report (11). Rate ratios (RRs) and 95% confidence intervals (CIs) were calculated by using OpenEpi software (12). Racial ClassificationNVSS mortality data were coded for four racial categories: white, black, AI/AN, and A/PI; ethnicity was coded separately as Hispanic or non-Hispanic. Hispanics were not included in the four racial categories. The categories examined were white, non-Hispanic; black, non-Hispanic; AI/AN, non-Hispanic; and Asian/Pacific Islander, non-Hispanic, which allowed comparisons with Hispanics of every race. References to race, therefore, refer only to non-Hispanic members of that race (e.g., whites are non-Hispanic whites). A small number of deaths with unknown ethnicity (N = 293) were not included in the tabulations. ResultsInjury Death Rates by Age Group and IntentInfants Aged <1 Year During 1999--2002, the injury death rate among infants was 33.7/100,000 population. Rates for AI/AN and black infants were two to three times those of white infants for total injury, unintentional injury, and homicide (Tables 2--4). Rates for A/PIs and Hispanics were lower than rates for whites for total injury and unintentional injury and comparable to white rates for homicide. Children Aged 1--9 Years During 1999--2002, the injury death rate among children aged 1--9 years was 10.4/100,000 population. AI/AN and black children consistently had higher total injury and unintentional injury death rates than the other racial/ethnic populations (Tables 2 and 3). For example, compared with whites aged 1--9 years, the injury death rate for AI/ANs aged 1--9 years was two times higher (RR = 2.1; CI = 1.9--2.4), and for blacks in this age group, 1.8 times higher (RR = 1.8; CI = 1.7--1.9). A/PIs had lower rates than whites for both total and unintentional injury. For homicides, blacks, AI/ANs, and Hispanics all had higher rates than whites (Table 4). Children Aged 10--19 Years During 1999--2002, the injury death rate among U.S. children aged 10--19 years was 30.9/100,000 population; for those aged 10--14 and 15--19 years, the rate was 10.2 and 52.0, respectively. Compared with whites aged 10--19 years, the injury death rate for AI/ANs was 1.8 (CI = 1.7--1.9) times higher, and for blacks, 1.2 (CI = 1.2--1.3) times higher (Table 2). A/PIs and Hispanics had lower rates than whites. For unintentional injury mortality, however, only AI/ANs had higher rates than whites (Table 3). Rates for black, A/PI, and Hispanic children were significantly lower than rates for white children. For homicide, rates for whites were significantly lower than the rates for the other racial/ethnic populations (Table 4). For suicide, rates for whites were significantly lower than those for AI/ANs and significantly higher than those for blacks, A/PIs, and Hispanics (Table 5). Mechanisms of Unintentional Injury Death by Age GroupInfants Aged <1 Year The three leading mechanisms of unintentional injury death among infants aged <1 year, regardless of race or ethnicity, were suffocation, motor-vehicle (MV)--traffic injury, and drowning (Table 6). Black infants had the highest rate of injury death associated with unintentional suffocation (Table 7), whereas AI/AN infants had the highest rate of injury death attributed to MV-traffic injury. Compared with rates for whites, rates for Hispanics were lower for suffocation and higher for MV-traffic injury. Children Aged 1--9 Years The leading mechanisms of unintentional injury death among children aged 1--9 years were MV-traffic injury, drowning, and fire/burn; MV-traffic injury was the leading cause of death in all racial/ethnic populations (Table 6). The highest injury death rate caused by MV-traffic injury was among AI/ANs aged 1--9 years (Table 8). AI/AN children also had the highest rate of injury death associated with drowning, whereas black children had the highest rate of injury death associated with fires/burns. Rates for A/PIs were consistently lower than those for whites. Rates for Hispanics were comparable to rates for whites. Children Aged 10--19 Years The leading mechanisms of unintentional injury death among children aged 10--19 years were MV-traffic injury, drowning, and poisoning (Table 6). AI/ANs aged 10--19 years were disproportionately affected by unintentional MV-traffic injury and poisoning, whereas blacks aged 10--19 years had the highest rate of drowning deaths (Table 9). A/PIs aged 10--19 years had the lowest rates for MV-traffic injury, poisoning, and drowning. Hispanics had lower rates than whites for MV-traffic deaths and poisoning but higher rates for drowning. Mechanisms of Intentional Injury DeathThe mechanisms used in homicides and suicides among children aged 10--19 years differed according to race and ethnicity. Firearms were involved in 86.4% of homicides among black children and 83.3% of homicides among Hispanic children aged 10--19 years (Table 10). In contrast, among AI/AN children, 56.0% of homicides involved firearms, the smallest percentage of all populations. The highest percentage of homicides attributed to cutting/piercing was among AI/ANs (21.1%); A/PIs and whites had the second and third highest percentages, respectively. The leading mechanism of suicide among children aged 10--19 years was firearms for whites and blacks (Table 11). However, suffocation, especially by hanging, was the leading mechanism of suicide among AI/ANs, A/PIs, and Hispanics. Whites aged 10--19 years had the largest percentage of suicides by poisoning (7.6%), and A/PIs had the highest percentage of suicides attributed to falls (8.1%). Injury Death Rates by Single Year of AgeChildren Aged 0--9 Years Among children aged 0--9 years, the mortality rate declined sharply after infancy in all groups (Figure 1). Racial/ethnic disparities among injury death rates also decreased in absolute terms as age increased, with gaps narrowing as children neared age 9 years. However, in relative terms, the gaps failed to narrow over the age range (Figure 2). Substantial disparities in rates among AI/AN children versus white children persisted across the age group, peaking both during infancy (RR = 2.6; CI = 2.1--3.1) and again at age 4 years, when rates were three times (RR = 3.0; CI = 2.2--4.1) those of white children. Disparities between AI/AN and white infants resulted from high rates of MV-traffic injury (RR = 4.8; CI = 3.1--7.3), homicide (RR = 2.8; CI = 1.8--4.2), and unintentional suffocation (RR = 2.0; CI = 1.4--2.8). Disparities at age 4 years resulted from wide gaps in rates of homicide (RR = 6.0; CI = 2.8--13.0), MV-traffic injury (RR = 3.4; CI = 2.0--5. 7), and unintentional drowning (RR = 2.7; CI = 1.3--5.8) (Figure 3). Disparities between black and white children were substantial, with the highest RR occurring during infancy, when the rate for blacks was 2.6 times (RR = 2.6; CI = 2.4--2.7) that of whites (Figure 2). These disparities stemmed from high homicide (RR = 3.4; CI = 3.0--3.9), unintentional fires/burns (RR = 2.7; CI = 2.0--3.8), and unintentional suffocation death rates (RR = 2.5; CI = 2.3--2.8) among black infants (Figure 4). Throughout the 0--9-year age group, rates for A/PIs and Hispanics were at or below rates for whites. Children Aged 10--19 Years Among children of all races, the trend in the total injury death rate reversed after age 9 years; the rate was 6.9/100,000 population at age 10 years and increased to 72.1/100,000 population at age 19 years. Racial/ethnic disparities among injury death rates also increased in absolute terms as age increased, with gaps generally widening with each year through adolescence (Figure 5). Differences in RRs were evident throughout the age group 10--19 years (Figure 6). The RR for AI/ANs reached a low at age 10 years (RR = 1.2), but AI/AN rates were approximately twice the rates for whites for ages 11--19 years (RR = 1.9; CI = 1.8--2.0). Overall, differences across the age group resulted from high rates of homicide, suicide, unintentional drowning, and MV-traffic deaths among AI/AN versus white children (Figure 7). RRs for AI/ANs versus whites were unstable for single years of age, but the overall RRs for this age group were all significantly elevated: homicide (RR = 3.5; CI = 2.9--4.2), suicide (RR = 2.2; CI = 1.9--2.5), unintentional drowning (RR = 2.5; CI = 1.8--3.4), and MV-traffic deaths (RR = 1.7; CI = 1.5--1.8). Rates also were higher for blacks than whites among children aged 10--19 years. RRs for blacks peaked at age 11 years (RR = 1.8; CI = 1.6--2.0), decreased to match rates of whites at age 16 years, and then increased steadily to age 19 years, when rates were 1.3 times (RR = 1.3; CI = 1.3--1.4) those of white children (Figure 6). These differences resulted primarily from higher homicide rates among black children aged 11 years (RR = 4.2; CI = 2.7--6.7) and 16--19 years (RR = 12.2; CI = 11.5--13.0) (Figure 8). Hispanics had lower rates of injury death than whites until late adolescence. A/PI children had rates that were half those of white children across the age group from 10--19 years (Figure 6). Comparison with Earlier Racial/Ethnic DisparitiesThe ranking of total-injury rates by race was the same during 1982--1985 as it was during 1999--2002 (Figure 9). RRs for total injury mortality during 1982--1985 were 1.2 for blacks, 1.7 for AI/ANs, and 0.6 for A/PIs. These RRs were similar during 1999--2002: 1.4 for blacks, 2.0 for AI/ANs, and 0.6 for A/PIs (Table 2). Data for Hispanics were not available until 1990. The ranking of rates of unintentional injury by race during 1982--1985 was AI/AN, white, black, and A/PI, from highest to lowest (Figure 10). Compared with rates for whites, RRs for unintentional injury mortality during 1982--1985 were 1.0 for blacks, 1.6 for AI/ANs, and 0.5 for A/PIs. These compare with RRs of 1.0 for blacks, 1.8 for AI/ANs, and 0.5 for A/PIs during 1999--2002 (Table 3). Therefore, the disparities in the total and unintentional injury mortality rates for children aged 0--19 years during 1999--2002 (Tables 2 and 3) were at least as great as the disparities during 1982--1985. DiscussionDuring 1999--2002, for childhood injury death rates by age, a J-shaped pattern was observed for all racial/ethnic populations; higher rates occurred during infancy and during late adolescence. Statistically significant racial disparities were observed in each age group. The disparity between rates among blacks and whites was greatest in infancy, when the rate for blacks was 2.5 times that for whites. Rates among AI/AN children were consistently two times those of white children for nearly every age from 0 to 19 years. Overall, for Hispanic children, injury death rates were comparable with or just below those for white children; in contrast, rates for A/PI children were significantly lower than those for white children. Unintentional Injury DisparitiesMotor-Vehicle--Traffic Injury During 1999--2002, MV-traffic injury was a leading cause of injury death among children of all races and ages. AI/AN infants and children were affected disproportionately in all three age groups. This finding might be attributed, in part, to the rural residence of many AI/ANs (13) because MV-death rates are higher in rural areas than nonrural areas (2). Other risk factors for AI/ANs include lack of passenger restraint use and alcohol consumption (14). According to the National Highway Traffic Safety Administration, except for the Navajo Nation, the rate of safety-belt use on reservations is relatively low (55.4%) (15). The prevalence of safety-belt use varies substantially by reservation, ranging from 8.8% to 84.8%. Only reservations with the highest rates of safety-belt use match overall U.S. safety-belt--use rates. Evidence exists concerning the effectiveness of safety-belt and child-safety--seat laws in increasing the use of such protection (16). Safety-belt use is linked to the type of law enforced in a jurisdiction (15). In 2004, reservations with primary laws (i.e., stopping a driver solely for lack of safety-belt use) had the highest prevalence of safety-belt use. Lower prevalences were observed in states with secondary laws (i.e., only stopping the driver if another infraction has occurred). The lowest prevalences were observed in states with no law. Similarly, reservations in states with primary laws had substantially higher percentages of safety-belt use than those with secondary laws. Strengthening occupant restraint laws will likely increase restraint use. Programs that include distribution of child-safety seats, provide education only, or offer incentives with education increase safety-seat use (16). AI/ANs have a relatively high prevalence of alcohol-impaired driving and the highest alcohol-related MV-mortality rates among racial/ethnic populations (17). In the previous 10 years, certain tribal governments have instituted effective prevention measures (e.g., laws that limit blood alcohol levels to <0.08 g/dL, minimum legal drinking age laws, well-executed mass media campaigns, a reduction in alcohol availability, sobriety checkpoints, and comprehensive community programs) (16,18). Additional tribal governments should consider similar measures. MV-traffic--mortality rates among blacks were higher than those among whites for infants and children aged 1--9 years but lower than rates for whites aged 10--19 years. The lower rate in adolescence might reflect less use of MVs by black teenagers. One study demonstrated that, per miles traveled, MV-fatality rates were higher for blacks and Hispanics than for whites (19). The lower rate in adolescence also might reflect the higher proportion of black urban residents (20) because MV-mortality rates are lower in urban areas (2). More research is needed to determine whether measures effective in enhancing MV safety in the general population will work in primarily black populations (16,21,22). Drowning Drowning is a leading cause of injury death among children, especially among black infants and AI/ANs aged 1--19 years. Factors such as the differential access to swimming pools and lessons and a combination of social and cultural issues (e.g., valuing swimming skills and choosing water-related activities when making recreational choices) might contribute to the racial differences in drowning rates. Among adolescents, alcohol use and failure to use personal flotation devices (PFDs) also might be contributing factors (23). AI/AN children and teenagers might be at higher risk because of greater exposure in rural settings to natural bodies of water. In one study of AI/ANs, 75% of drowning deaths occurred in rivers during boating activities (24). Drowning prevention measures should include carefully supervising children in bath tubs, pools, and natural bodies of water; implementing safety mechanisms (e.g., fenced pools, PFDs, and lifeguards); teaching children aged >4 years to swim; and teaching both teenagers and adults to avoid alcohol use during water-related recreational activities (25,26). Prevention strategies used in Alaska educate the public regarding the risk for drowning deaths among children and promote the use of float coats (i.e., PFDs that double as overcoats for warmth) and other flotation devices to prevent drowning (24,27,28). Fire and Burn Injury Fires and burns are a major cause of injury death among black children. During 1999--2002, black children aged 1--9 years had the highest rates of fire/burn injury death, when compared with the other racial/ethnic populations, and their rates remained higher than those of whites throughout adolescence. Racial disparities in such rates are linked to economic factors, poor housing, and substandard electrical and heating systems (29--31). Minorities also are less likely to engage in safety practices (e.g., using fireplace guards, turning down water heater settings, and using smoke alarms) (31--36). To alleviate disparities, more effective education regarding safety practices and better access to safety equipment are needed in minority populations. Restrictions on improper heating devices and better enforcement of building codes also are essential (31--32). Suffocation/Choking During 1999--2002, unintentional suffocation/choking was a larger problem for blacks and AI/ANs aged 0--9 years than for whites, Hispanics, and A/PIs. The majority of infants who suffocate do so because their airway is obstructed by bedclothes or soft sleeping surfaces (37). Suffocations are more likely to occur when infants are placed to sleep on their stomachs. Suffocation after infancy is more likely caused by choking on inhaled foreign bodies, especially food (38). High suffocation rates among black infants might result from greater use of the stomach sleeping position and bed-sharing compared with whites (39--43). Bed-sharing deaths and deaths on nonstandard sleep surfaces (e.g., couches or sofas) are twice as common among black infants (44). AI/ANs in certain states also are more likely than whites to place their babies to sleep on their stomachs (45), and Hispanics are less likely to place their babies on their stomachs (41). The medical community can reduce such deaths by advising parents on sleep positions for infants and the risks of bed-sharing (42,43). Intentional Injury DisparitiesHomicide Homicide rates were highest among black children across the study age group. The circumstances of homicide vary by the age of the child. The majority of homicides of children aged <10 years are perpetrated by family members, particularly parents or guardians, and represent the most severe form of child maltreatment (46,47). Providing parents with information and training on childrearing and behavioral management strategies and promoting parental involvement and positive parent-child interactions are the most basic approaches for fostering these types of relationships (47,48). In 2005, a systematic review by the Task Force for Community Preventive Services indicated that well-designed and -implemented home visitation programs, for example, might reduce reported child maltreatment by 40% (49). Health-care providers also can play an important role in the prevention of child maltreatment (37,48--50). Head trauma is the most common cause of fatalities attributed to child abuse. Violently shaking an infant can result in brain damage. A hospital-based program that disseminated information regarding the risk of shaking to both parents before their newborns were discharged from the hospital had a substantial effect on rates of abusive head trauma to infants (51). Child maltreatment can be prevented by providing parents and guardians with resources such as home visitation, assessment of risk factors for maltreatment, and greater involvement of health-care providers (47--49). Health-care providers should discuss with caregivers discipline practices, substance abuse and domestic violence, and parental coping mechanisms. In addition, health-care providers should link caregivers to community resources, look for early signs of maltreatment, and report incidents of maltreatment (37,48--50). The high homicide rates among black teenagers have been reported previously (52). Homicide among children aged 10--19 years is unlikely to be perpetrated by a caregiver and more likely to involve a weapon. Certain risk factors include poor behavioral control, a history of early aggressive behavior, substance abuse, exposure to family violence, poor parental monitoring and supervision, low academic performance, and involvement in gang activity (53,54). Protective factors include involvement in social activities, commitment to school, and being connected to family or other caring adults (53). Poverty, living environment, parental characteristics, and other sociodemographic factors also play a role (53,54). Many of the risks for serious violence later in life are present during early childhood. Early intervention is necessary to disrupt the social developmental pathways toward violence and delinquency (55). Because the age of onset for aggressive and violent behavior might vary considerably, prevention efforts across developmental periods also are needed. In addition, risks and protective factors for youth violence operate at multiple levels of social influence. Interventions that address multiple domains of influence on behavior (e.g., peers, families, schools, and community environments) are likely to have a greater effect than those that focus on a single risk factor (56--58). Suicide During the surveillance period studied, suicide was a major cause of death among older teenagers. Similar to MV-traffic deaths, suicides were more common among AI/AN adolescents and less common among black adolescents compared with white adolescents. These differences are not restricted to childhood; among blacks, suicide rates are lower than whites for all age groups through adulthood. Among AI/ANs, suicide rates are higher than those for whites through the 35--39-year age group and lower thereafter (10). A major correlate of youth suicide is a previous attempt, and suicide attempts among AI/ANs are linked to risk factors such as having friends or relatives who had attempted or completed suicide, a history of physical and sexual abuse, substance use, gang involvement, and gun availability (59). Increasing certain protective factors is more effective in reducing suicide attempts than decreasing risk factors. Protective factors include discussion of problems with relatives and friends, emotional health, and feeling close to relatives (59). Suicide prevention efforts targeting adolescents have been implemented in various communities. The focus of these efforts has been family outreach after suicide or other traumatic events, training in social problem-solving skills, and screening to determine suicide risk (60). Such programs should continue to be developed and evaluated, especially in AI/AN and other communities at risk. Progress in Addressing Injury Mortality DisparitiesThe racial/ethnic disparities in total injury mortality during childhood were greatest during 1987--1998 (Figure 9). The primary cause of the disparities during these years was the homicide epidemic during the early 1990s, especially among black teenagers (52). Despite the decline in homicide rates during the late 1990s, disparities during 1999--2002 were at least as great as those during 1982--1985. Therefore, despite net declines in total injury mortality among all racial/ethnic populations, disparities have not been eliminated. Trends in unintentional injury mortality (Figure 10) also indicate persistent disparities for blacks and AI/ANs compared with whites, A/PIs, and Hispanics. One indication of progress is that rates for total injury and unintentional injury among Hispanic children have declined compared with those for whites since the early 1990s. LimitationsThe findings in this report are subject to at least two limitations. First, this study was limited by racial misclassification in both death counts and populations used in rate calculations. CDC has calculated the net effect of underestimating numerators and denominators on mortality rates by race/ethnicity (61); adjusting for misclassification would increase reported rates for AI/ANs by approximately 20.6%; A/PIs, by 10.7%; and Hispanics, by 1.6%. Adjusting for misclassification also would decrease reported rates for blacks by 5.0% and for whites by 1.0%. Therefore, adjustment for misclassification in this study would have brought rates for blacks closer to rates for whites by a small amount, and the use of adjusted rates for AI/ANs would have made their rates even higher than whites. Adjusted rates for A/PIs probably would have remained significantly lower than those for whites. Second, the potential for error existed in determining or recording information on the cause of death, particularly regarding the intent of an injury. At the national level, little is known regarding the accuracy of information on the circumstances and causes of injury mortality in the United States (7). ConclusionThe gaps between injury rates for blacks and AI/ANs and rates for whites have not been closed. Future injury-prevention efforts might close this gap by targeting the injury mechanisms most harmful to minorities in each age group and by using culturally appropriate prevention messages and strategies (22). Community and system factors that contribute to injury death among AI/AN and black children also need to be addressed when designing interventions. Because of frequent interaction with parents and caregivers, health-care providers/educators serving AI/AN and black populations can continue their vital role by communicating age-appropriate injury-prevention messages. References
* The en dash in numeric ranges is used to represent inclusive years, hours, days, ages, dosages, or a sequence of numbered items. Table 1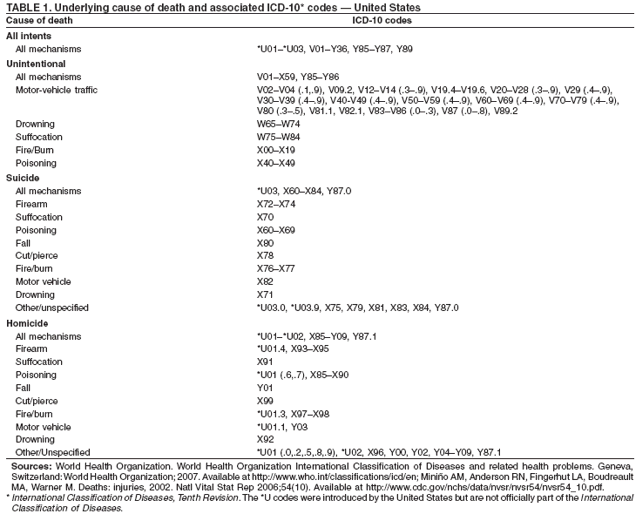 Return to top. Figure 1 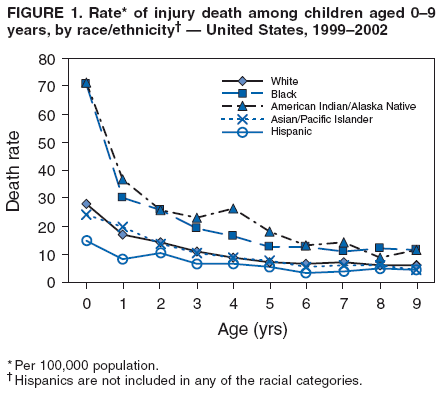 Return to top. Table 2 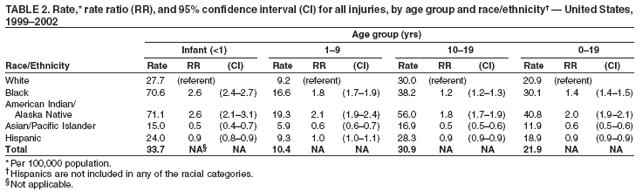 Return to top. Figure 2 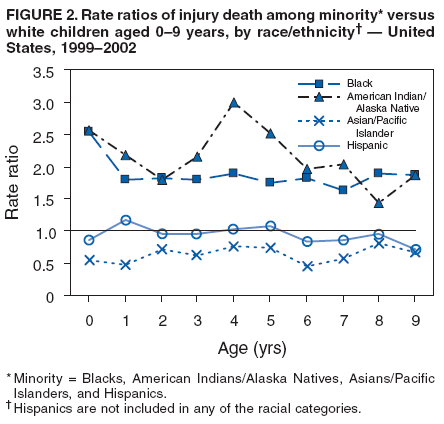 Return to top. Table 3 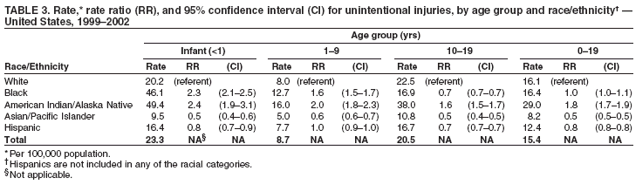 Return to top. Figure 3 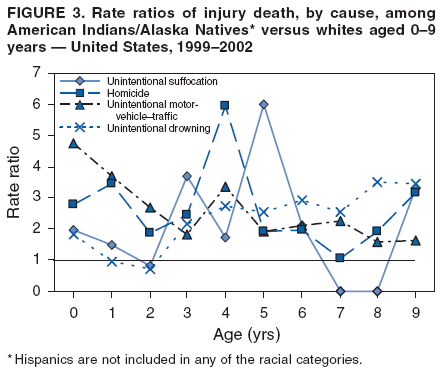 Return to top. Table 4 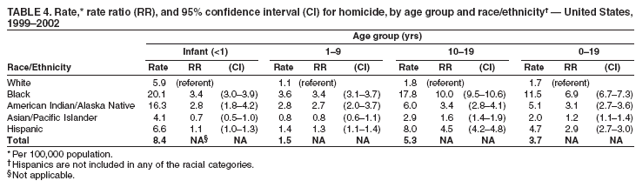 Return to top. Figure 4 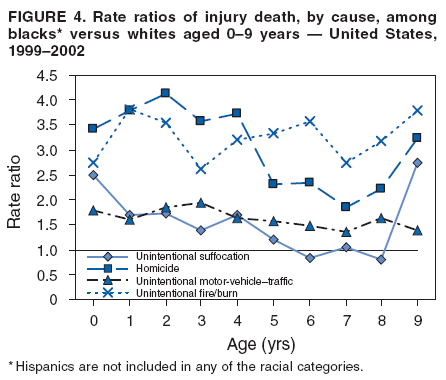 Return to top. Table 5 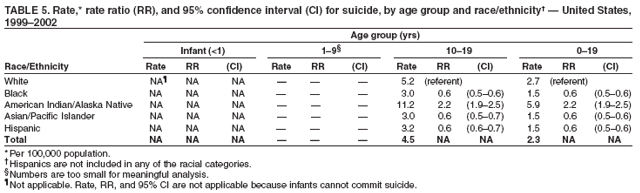 Return to top. Figure 5 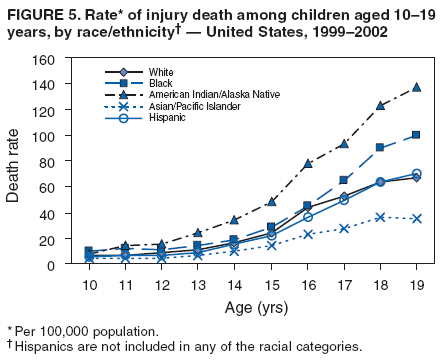 Return to top. Table 6 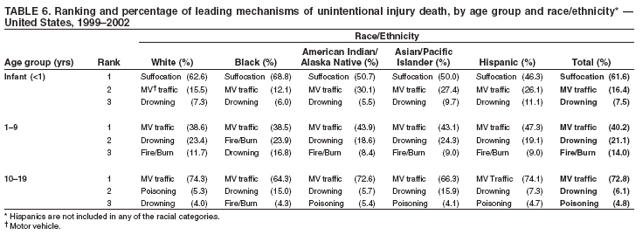 Return to top. Figure 6 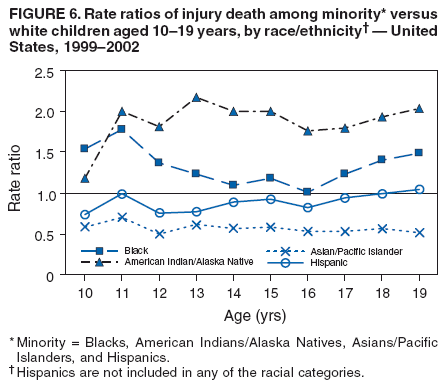 Return to top. Table 7 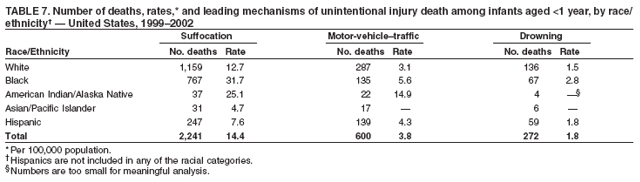 Return to top. Figure 7 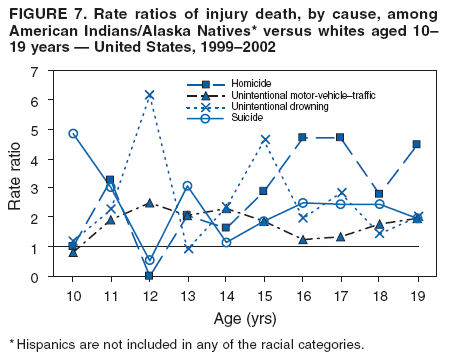 Return to top. Table 8 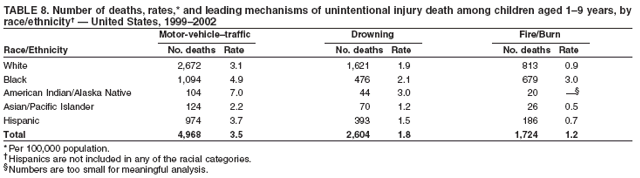 Return to top. Figure 8 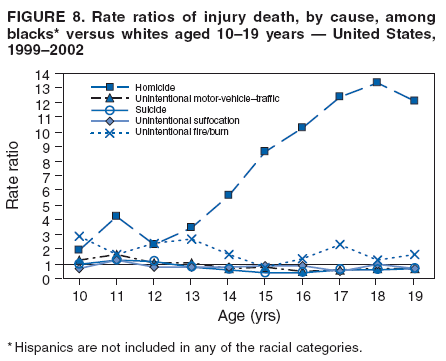 Return to top. Table 9 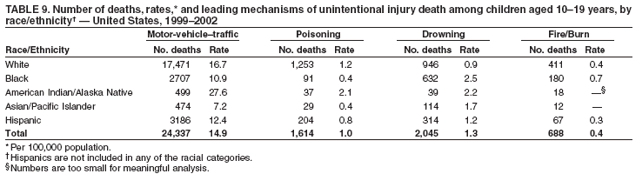 Return to top. Figure 9 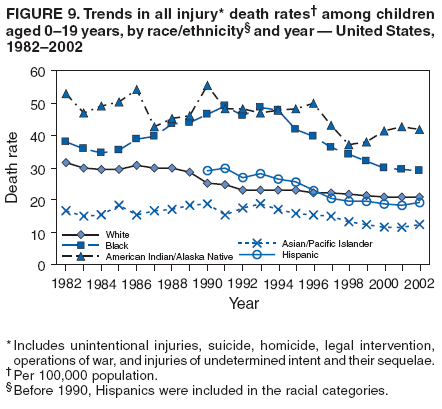 Return to top. Table 10 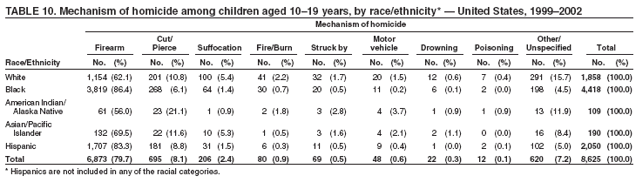 Return to top. Figure 10 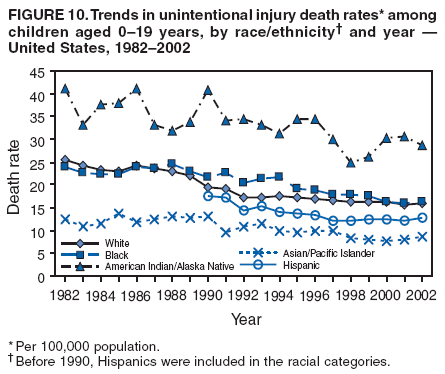 Return to top. Table 11 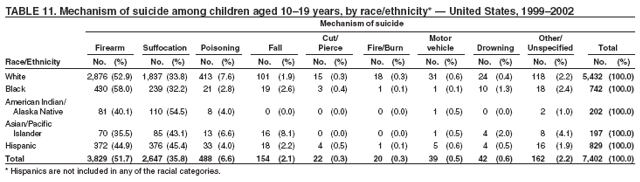 Return to top.
Disclaimer All MMWR HTML versions of articles are electronic conversions from ASCII text into HTML. This conversion may have resulted in character translation or format errors in the HTML version. Users should not rely on this HTML document, but are referred to the electronic PDF version and/or the original MMWR paper copy for the official text, figures, and tables. An original paper copy of this issue can be obtained from the Superintendent of Documents, U.S. Government Printing Office (GPO), Washington, DC 20402-9371; telephone: (202) 512-1800. Contact GPO for current prices. **Questions or messages regarding errors in formatting should be addressed to mmwrq@cdc.gov.Date last reviewed: 5/1/2007 |
|||||||||
|