|
|
|
|
|
|
|
| ||||||||||
|
|
|
|
|
|
|
||||
| ||||||||||
|
|
|
|
|
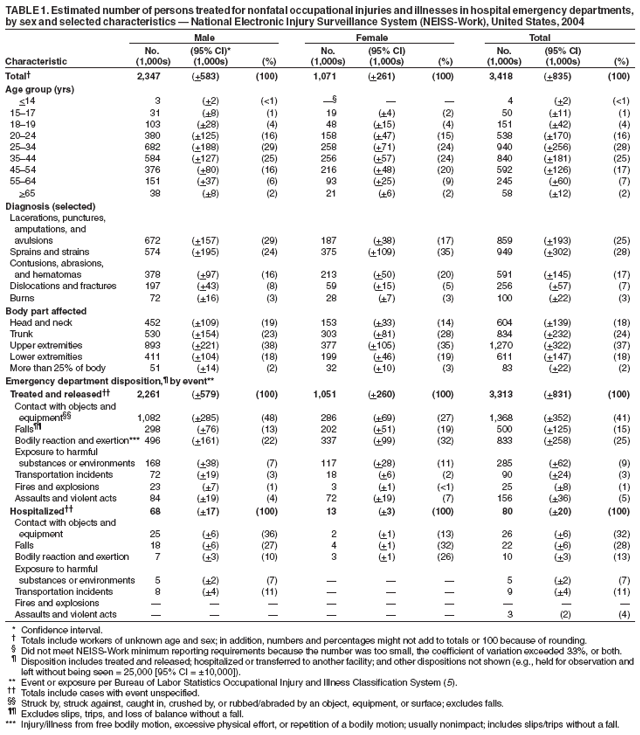
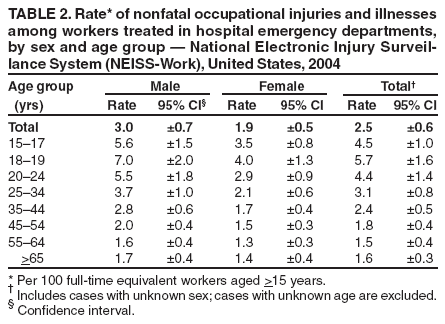
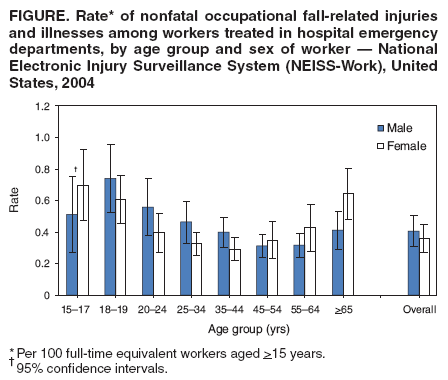
Persons using assistive technology might not be able to fully access information in this file. For assistance, please send e-mail to: mmwrq@cdc.gov. Type 508 Accommodation and the title of the report in the subject line of e-mail. Nonfatal Occupational Injuries and Illnesses --- United States, 2004Data collected through a National Electronic Injury Surveillance System occupational supplement (NEISS-Work) provide information on persons treated for nonfatal work-related injuries and illnesses in U.S. hospital emergency departments (EDs). CDC's National Institute for Occupational Safety and Health uses these data to monitor injury trends and aid prevention activities. This report summarizes 2004 NEISS-Work injury and illness surveillance data. In 2004, an estimated 3.4 million nonfatal ED-treated injuries and illnesses occurred among workers of all ages, with a rate of 2.5 cases per 100 full-time equivalent (FTE) workers aged >15 years. Workers aged <25 years had the highest injury/illness rates. More than three fourths of all nonfatal workplace injuries/illnesses were attributed to contact with objects or equipment (e.g., being struck by a falling tool or caught in machinery), bodily reaction or exertion (e.g., a sprain or strain), and falls. No substantial reduction was observed in the overall number and rate of ED-treated occupational injuries/illnesses during 1996--2004 (1--3). To reduce occupational injuries/illnesses, interventions should continue to target workers at highest risk and reduce exposure to those workplace hazards with the greatest potential for causing severe injury or death. More emphasis should be placed on prevention-effectiveness studies and dissemination of successful interventions to reduce work-related injuries and illnesses. NEISS-Work uses a national stratified probability sample of 67 U.S. hospitals with 24-hour EDs.* Hospitals in the sample were selected from the approximately 5,300 rural and urban U.S. hospitals after stratification into four size-based strata (i.e., by total annual ED visits) plus a children's hospital stratum. Each injury/illness was assigned a statistical weight correlating to the probability of selecting the treating hospital within its sample stratum. Weights were adjusted monthly for nonresponse among the sample hospitals and on an annual basis for national fluctuations in ED usage. ED-usage adjustments for 2004 were derived from a sampling frame of national hospital ED visits in 2003. Nonfatal occupational injuries/illnesses among civilian noninstitutionalized workers treated in the sample hospital EDs were identified by chart review. An injury or illness was considered work related if it occurred while the patient was working for pay or other compensation, working on a farm, or volunteering for an organized group (e.g., volunteer fire department) (3). Most cases involved injuries; illnesses (e.g., occupational asthma, conjunctivitis, and myocardial infarction) requiring ED treatment of patients amounted to approximately 5%--10% of all cases. Common illnesses (e.g., colds or other viral infections) or revisits to the same ED by a previously treated worker were excluded. National injury/illness estimates were calculated by summing the statistical weights assigned to cases. Injury/illness rates were calculated on an FTE basis (i.e., 2,000 hours worked annually = one FTE) using employment estimates from the U.S. Current Population Survey, which includes workers aged >15 years (4). Thus, in this report, the number of injuries/illnesses is reported for all ages, whereas rates for workers treated in EDs are calculated for persons aged >15 years. Ninety-five percent confidence intervals (CIs) were calculated using a variance procedure that accounted for the stratified nature of the sample and monthly fluctuations in hospital reporting. The total estimated number of injuries/illnesses for which workers were treated in EDs in 2004 was 3.4 million (Table 1), the same as estimated in 2003; the total rate of 2.5 cases per 100 FTEs in 2004 also was the same as in 2003. In 2004, the median ages for injured/ill males and females were 34 and 36 years, respectively. Workers aged 25--54 years accounted for 70% of all injuries/illnesses. However, among age groups, workers aged 18--19 years had the highest rate (5.7 cases per 100 FTEs [CI = ±1.6]), followed by workers aged 15--17 years (4.5 cases [CI = ±1.0]), and workers aged 20--24 years (4.4 cases [CI = ±1.4]). Workers aged 25--44 years (2.7 cases [CI = ±0.6]) had an intermediate rate, and workers aged 45 years and older (1.7 cases [CI = ±0.4]) had the lowest injury/illness rate (Table 2). Overall, approximately 2% of workers treated at EDs were either admitted to the hospital or transferred to another hospital (e.g., trauma or burn center). Males accounted for 68% of the injuries and illnesses for which workers were treated and released but 85% of the workers requiring hospital admission. Approximately 53% of all injuries/illnesses were categorized as sprains and strains or lacerations, punctures, amputations, and avulsions (Table 1). The majority of sprains and strains affected the trunk (i.e., shoulder, back, chest, or abdomen) (517,600 [CI = ±178,800]) and lower extremities (i.e., legs, feet, or toes) (233,100 [CI = ±64,800]). The majority of lacerations, punctures, amputations, and avulsions affected upper extremities (i.e., arms, hands, or fingers) (647,700 [CI = ±145,800]). Overall, dislocations and fractures accounted for 7% of the injuries/illnesses. However, dislocations and fractures (caused mostly by falls) produced 40% of hospitalizations for males (26,900 [CI = ±8,400]) and 33% of hospitalizations for females (4,300 [CI = ±1,500]). Males and females had similar rates for fall-related injuries/illnesses overall and by age group (Figure). Fall rates were highest among workers in the youngest and oldest age groups; rates among women aged >65 years were particularly high (0.64 per 100 FTEs [CI = ±0.16]). Fifty-five percent of falls were on the same level (e.g., falling to a floor, a walkway, or the ground or onto/against objects such as a desk, wall, or door) (291,200 [CI = ±78,800]); 32% of falls were to a lower level (e.g., falling from a ladder or roof; falling down stairs or steps; falling through a floor or roof) (165,600 [CI = ±39,900]).† Females had six times more falls on the same level (165,000 [CI = ±43,700]) compared with falling to a lower level (28,200 [CI = ±7,200]). However, males had about an equal number of falls to a lower level (137,400 [CI = ±34,600]) and falls on the same level (126,200 [CI = ±36,500]). Reported by: SJ Derk, MA, SM Marsh, MPA, LL Jackson, PhD, Div of Safety Research, National Institute for Occupational Safety and Health, CDC. Editorial Note:The findings in this report indicate that, in 2004, the number (3.4 million) and rate (2.5 per 100 FTEs) of nonfatal occupational injuries/illnesses were similar to previous years (3.2, 3.6, and 3.4 million in 1996, 1998, and 2003, respectively; rates of 2.7, 2.9, and 2.5 per 100 FTEs in 1996, 1998, and 2003, respectively)§ (1--3). Focusing on common events that often produce severe injuries (e.g., falls) can substantially reduce fatalities, hospitalizations, and the number of injuries/illnesses overall. A previous analysis of falls among workers aged >55 years determined that injuries sustained by older workers tended to be more severe, with a greater number of fractures and hospitalizations from falls on the same level. (6). Many falls on the same level involved floor contamination (e.g., with water, cleaning solutions, or grease) or tripping hazards that can be addressed in the workplace by keeping walking surfaces clean and dry, well lit, and free from cords and debris. The Bureau of Labor Statistics (BLS) reports nonfatal occupational injuries/illnesses estimates annually based on a survey of private industry employers (7).¶ BLS results indicate a general decline in private industry nonfatal injuries/illnesses in recent years. Despite differences between NEISS-Work and BLS surveillance (e.g., in worker populations, types of medical treatment, sample sizes, and data sources), analogous results were observed for fall injuries. The BLS reported that, in 2004, for nonfatal cases involving 1 or more days away from work, falls were the third most common cause, accounting for 255,600 (20%) of 1,259,320 injuries/illnesses. The majority of these falls occurred on the same level (65%, 167,010) or to a lower level (31%, 79,800) (8). Education and health services, along with the leisure and hospitality industries, had the highest rate of falls on the same level (0.27 per 100 FTEs), whereas the construction industry had the highest rate of falls to a lower level (0.33 per 100 FTEs). For workers aged >55 years, falls were the second leading injury/illness event for cases involving days away from work (32%, 48,730 of 152,760 cases), with the majority of falls occurring on the same level (75%, 36,310 of 48,730 cases). Although direct data comparisons must be made with caution, these two national data systems can augment each other in guiding nonfatal occupational injury/illness prevention. The findings in this report are subject to at least five limitations. First, the NEISS-Work data only address injuries/illnesses for which workers are treated in EDs; these are estimated to represent about one third of all workplace injuries/illnesses for which persons require medical treatment (3). Second, NEISS-Work includes only a proportion of work-related illnesses; the majority of workers with chronic illnesses are not treated in an ED, and the work-relatedness of illnesses such as arthritis, cancer, or high blood pressure is difficult to establish. Third, work-related cases were identified from ED charts and hospital admissions information. Additional documentation (e.g., workers' compensation claims) was not required to confirm that injuries/illnesses were work related and might have resulted in an overestimation; conversely, a lack of incident detail or a clear association with a work-related cause in ED charts and economic disincentives for patients to identify their injuries/illnesses as work related might have resulted in underestimation. Fourth, patient demographics, nature or severity of injury, and incident-event characteristics might have biased the identification of work-related cases, affecting the distribution of these characteristics. Finally, the large standard errors (10%--20%) resulting from the hospital sample size might have obscured injury/illness trends. These findings indicate that the rate of workers treated in an ED for nonfatal occupational injuries/illnesses has not declined substantially in the United States in recent years. Younger workers aged <25 years continued to experience the highest rates of injuries/illnesses. NEISS-Work is used to track progress toward a Healthy People 2010 objective, which targets a 30% reduction in the rate of workers aged 15--17 years who are treated in an ED for occupational injuries and illnesses.** To attain this objective, better safety training for these young workers might help overcome inexperience, improve attitudes toward risk, and lead to safer work habits later in life. The U.S. Department of Labor is proposing changes to child labor regulations to improve safety for young workers (9). To address some of the more severe nonfatal injuries and illnesses, safety practices and interventions must more effectively target workers and work practices at highest risk. For example, targeting hazards such as slippery surfaces, pathway obstacles, or tripping dangers, particularly in food service or health care, can reduce serious falls (10). Integrating workplace fall-prevention programs with community-based initiatives for older adults that address indoor and outdoor factors such as lighting, floor and walkway surfaces, and railings might further reduce hospitalization rates among older workers and benefit business customers and visitors. The effectiveness of all safety practices should be evaluated carefully and take into account the demographics of the worker population at risk. References
* The NEISS-Work data collection system is operated by the Consumer Product Safety Commission (CPSC) as a supplement to its NEISS surveillance of consumer product--related injuries. CPSC product-related injury estimates exclude work-related injuries. NEISS-Work estimates include all work-related injuries regardless of product involvement. NEISS-Work uses approximately two thirds of the CPSC sample of 101 hospitals. Because of hospital closures and other nonparticipation/nonresponse factors, the number of reporting hospitals can vary monthly and yearly. † The total number of falls also included 1) falls, unspecified, 2) falls, jumps to a lower level, and 3) falls, not elsewhere classified. § 1996 data were adjusted for a 1997 change in the NEISS-Work sample. ¶ The BLS survey includes cases that meet Occupational Safety and Health Administration criteria for reportable work-related nonfatal injuries and illnesses that involve days away from work, job transfer or restriction, loss of consciousness, or medical treatment other than first aid. All federal, state, and local government workers (certain states include state and local workers), self-employed workers, private household workers, and workers on farms with fewer than 11 employees are excluded (approximately 22% of U.S. workers). The BLS survey provides occupational injury and illness counts and rates by detailed industry. The survey only reports demographic and case characteristics for cases involving days away from work. Rates are available for selected case characteristics; rates for demographic characteristics are being developed. ** Objective 20-02h: reduce work-related injuries among adolescent workers from a 1997--1998 baseline of 4.9 injuries per 100 full-time equivalent workers to 3.5. Available at http://www.healthypeople.gov/data/midcourse/pdf/FA20.pdf.
Table 1
Disclaimer All MMWR HTML versions of articles are electronic conversions from ASCII text into HTML. This conversion may have resulted in character translation or format errors in the HTML version. Users should not rely on this HTML document, but are referred to the electronic PDF version and/or the original MMWR paper copy for the official text, figures, and tables. An original paper copy of this issue can be obtained from the Superintendent of Documents, U.S. Government Printing Office (GPO), Washington, DC 20402-9371; telephone: (202) 512-1800. Contact GPO for current prices. **Questions or messages regarding errors in formatting should be addressed to mmwrq@cdc.gov.Date last reviewed: 4/26/2007 |
|||||||||
|