CDC Update on Widespread Flu Activity
Media Advisory
For Immediate Release: Friday, February 9, 2018
Contact: Media Relations
(404) 639-3286
What
CDC will provide an update on the current flu season.
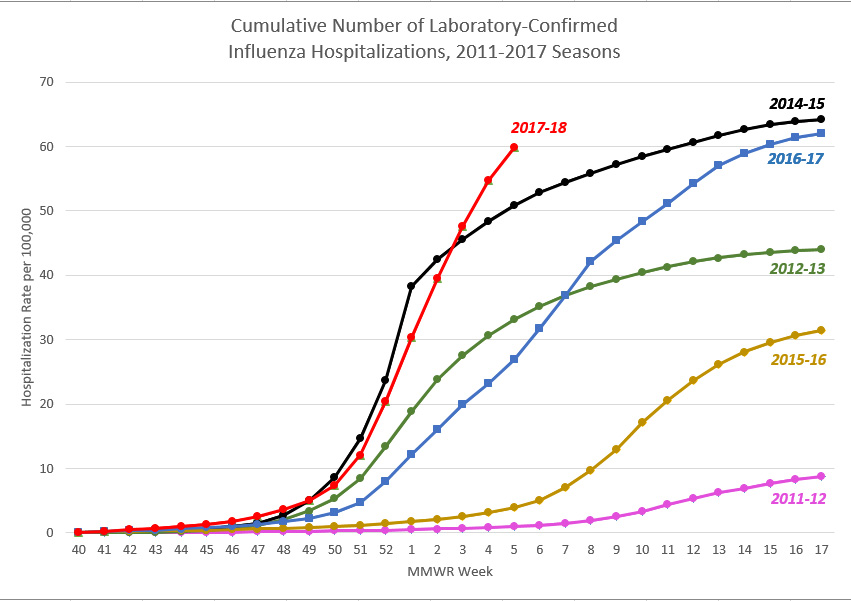
This is a line graph entitled “Cumulative Number of Laboratory-Confirmed Influenza Hospitalizations, FluSurv-NET, 2010-2017 Seasons.” The hospitalization rate per 100,000 is shown on the Y-axis, and it scales from 0 to 70. The MMWR week is shown on the X-axis, and it scales from week 40 to 52, and then from week 1 to 17. Across the top of the graph, a color-coded key is provided to denote which line of the graph refers to which flu season. Data from eight flu seasons are included, beginning with the 2010-2011 flu season and ending with the 2017-18 flu season. A sky blue line represents the 2010-2011 season. An orange line represents the 2011-2012 season. A gray line represents the 2012-2013 season. A yellow line represents the 2013-2014 season. A blue line represents the 2014-2015 season. A green line represents the 2015-2016 season. A dark blue line represents the 2016-2017 season, and a red line represents the 2017-2018 season. The season with the lowest final cumulative rate of laboratory-confirmed influenza hospitalizations is the 2011-2012 season, which had a rate of 8.7 per 100,000. The season with the highest final cumulative rate of laboratory-confirmed influenza hospitalizations is the 2014-2015 season, which had a rate of 64.2 per 100,000. The week 5 influenza hospitalization rate for the 2017-2018 season is higher than the week 5 hospitalization rate for the 2014-2015 season and approaching the cumulative overall end-of-season hospitalization rate for 2014-2015. The hospitalization rate for the 2017-2018 season is currently at 59.9 per 100,000. In comparison, the hospitalization rate during week 5 of the 2014-2015 season was 50.9 per 100,000. The cumulative hospitalization rates per 100,000 for the remaining seasons break down as follows from lowest to highest hospitalization rate: the 2010-2011 season was 21.7; the 2015-2016 season was 31.5; the 2013-2014 season was 35.1; the 2012-2013 season was 44.0; and the 2016-2017 season was 62.0. These hospitalization rates are not adjusted for testing practices, which can vary from season to season; caution should be used when comparing hospitalization rates across seasons.
Who
Anne Schuchat, M.D., RADM, USPHS, Acting Director, Centers for Disease Control and Prevention
Alicia M. Fry M.D., M.P.H., CAPT, USPHS, Epidemiology and Prevention Branch Chief, Influenza Division, National Center for Immunization and Respiratory Diseases
When
Friday, February 9, at 11:00 a.m. ET
Dial-In
Media: 888-795-0855
Non-Media: 800-779-2638
International: 1-210-234-0009
PASSCODE: CDC Media
Important Instructions
If you would like to ask a question during the call, press *1 on your touchtone phone. Press *2 to withdraw your question. You may queue up at any time. You will hear a tone to indicate your question is pending.
TRANSCRIPT
A transcript of this media availability will be available following the briefing at CDC’s web site: www.cdc.gov/media.
###
U.S. DEPARTMENT OF HEALTH AND HUMAN SERVICESexternal icon