COVID-19 Science Update released: December 15, 2020 Edition 69

The COVID-19 Science Update summarizes new and emerging scientific data for public health professionals to meet the challenges of this fast-moving pandemic. Weekly, staff from the CDC COVID-19 Response and the CDC Library systematically review literature in the WHO COVID-19 databaseexternal icon, and select publications and preprints for public health priority topics in the CDC Science Agenda for COVID-19 and CDC COVID-19 Response Health Equity Strategy.
Section headings in the COVID-19 Science Update have been changed to align
with the CDC Science Agenda for COVID-19.
Here you can find all previous COVID-19 Science Updates.
PEER-REVIEWED
Evaluating the impact of stay-at-home orders on the time to reach the peak burden of Covid-19 cases and deaths: does timing matter?external icon Medline et al. BMC Public Health (November 23, 2020).
Key findings:
- Compared to other countries, those classified as the latest 10% to implement a stay-at-home mandate experienced an extra 30.0 days (95% CI 6.9-53.2) to the peak of cases and 26.3 days (95% CI 9.9-42.7) to the peak of deaths.
- Compared to other US states, those classified as the latest 10% to implement a stay-at-home mandate experienced an extra 35.3 days (95% CI 18.2-52.5) to the peak of cases and 38.3 days (95% CI 23.6-53.0) to the peak of deaths.
Methods: Observational analysis from April to May 2020 included countries (n = 41) and US states (n = 43) with known stay-at-home orders using publicly available data. Linear regression analyses assessed the association between number of days between first reported COVID-19 case and start of stay-at-home mandate and number of days to reach peak burden of COVID-19 (daily cases and deaths), controlling for regional case rates. Limitations: Did not consider duration of mandate, possible confounding from concurrent mitigation interventions, adherence to mandates, and secondary peaks.
Implications: Stay-at-home mandates may benefit communities most as proactive rather than reactive measures for COVID-19 by shortening the duration to reaching peak daily case and death counts.
Rapid Response to an Outbreak in Qingdao, Chinaexternal icon. Xing et al. NEJM. November 18, 2020.
Key findings:
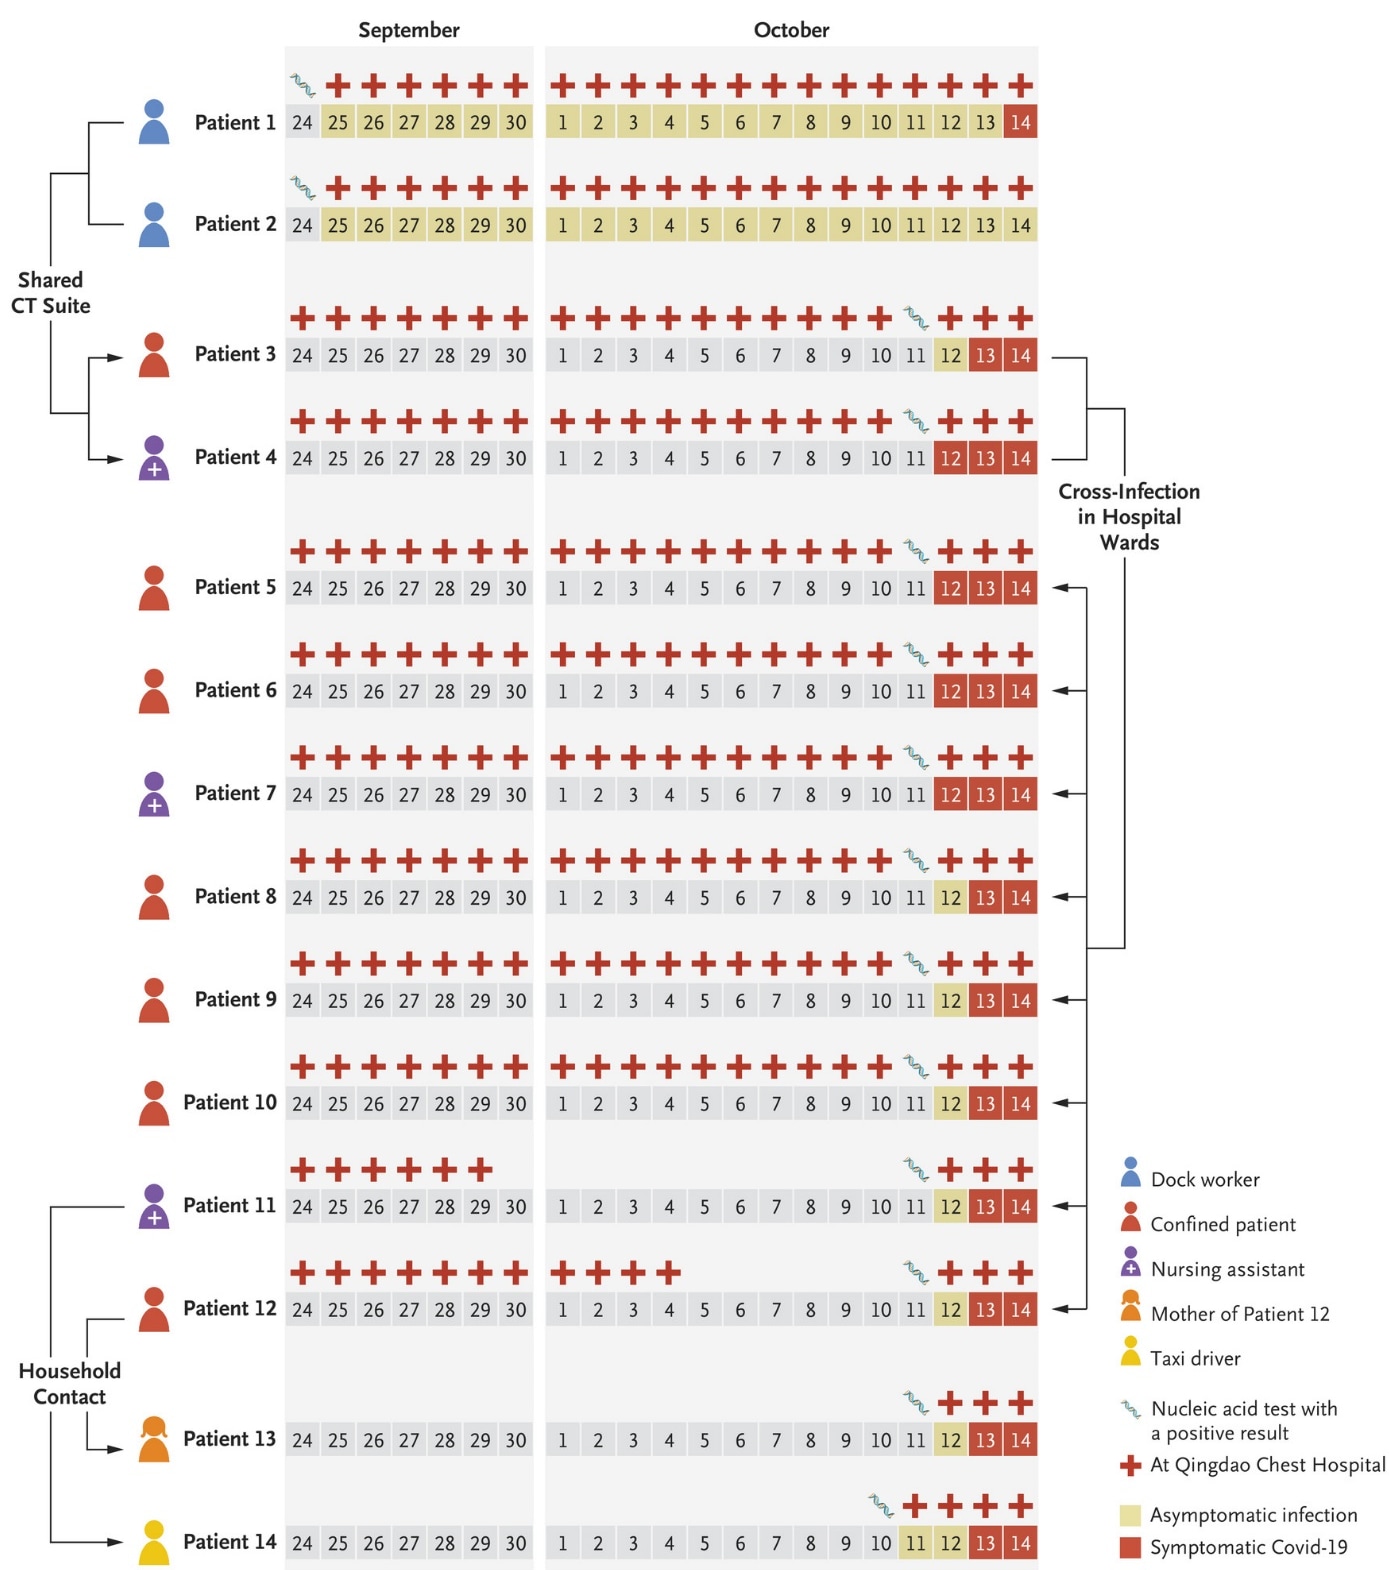
- In response to a COVID-19 cluster, 10.9 million people were tested in Qinqdao, China and surrounding suburban areas, identifying nine cases in addition to the initial three reported cases (Figure).
- Epidemiologic evidence suggested that all cases were linked to a hospital where two port dock workers with asymptomatic COVID-19 infections had earlier received chest CT scans.
Methods: COVID-19 outbreak investigation prompted by three cases reported in Qingdao, China on October 11, 2020. Pooled RT-PCR SARS-CoV-2 testingexternal icon was conducted at 4,090 testing locations, and contact tracing and quarantining of close contacts was initiated in Qingdao and surrounding suburban areas. Limitations: No direct link was established for the source of the outbreak.
Implications: With a relatively small outbreak of COVID-19 centered around a hospital, Chinese authorities took extraordinary efforts in coordinating testing for millions of residents. Active surveillance is critical to identify outbreaks early and coordinate effective testing and contact tracing before widespread transmission occurs.
Figure:
Note: Adapted from Xing et al. Timeline of events in the nosocomial cluster of COVID-19 cases during September and October 2020. Patients 1 and 2 were dock workers at the Qingdao port and shared the CT suite visited by Patient 3 and Patient 4 who may have transmitted the virus to six other patients (Patients 5, 6, 8, 9, 10, and 12) and two other health care workers (Patients 7 and 11) that were hospitalized or working in the same ward. Patient 14 (a taxi driver) was infected with SARS-CoV-2 through contact with his wife (Patient 11). Patient 12’s mother (Patient 13) was also infected through household contact. From NEJM, Xing et al., Rapid Response to an Outbreak in Qingdao, China. Copyright © 2020 Massachusetts Medical Society. Reprinted with permission from Massachusetts Medical Society.
PREPRINTS (NOT PEER-REVIEWED)
Antigen rapid tests, nasopharyngeal PCR and saliva PCR to detect SARS-CoV-2: a prospective comparative clinical trial.external icon Schwob et al. medRxiv (November 24, 2020).
Key findings:
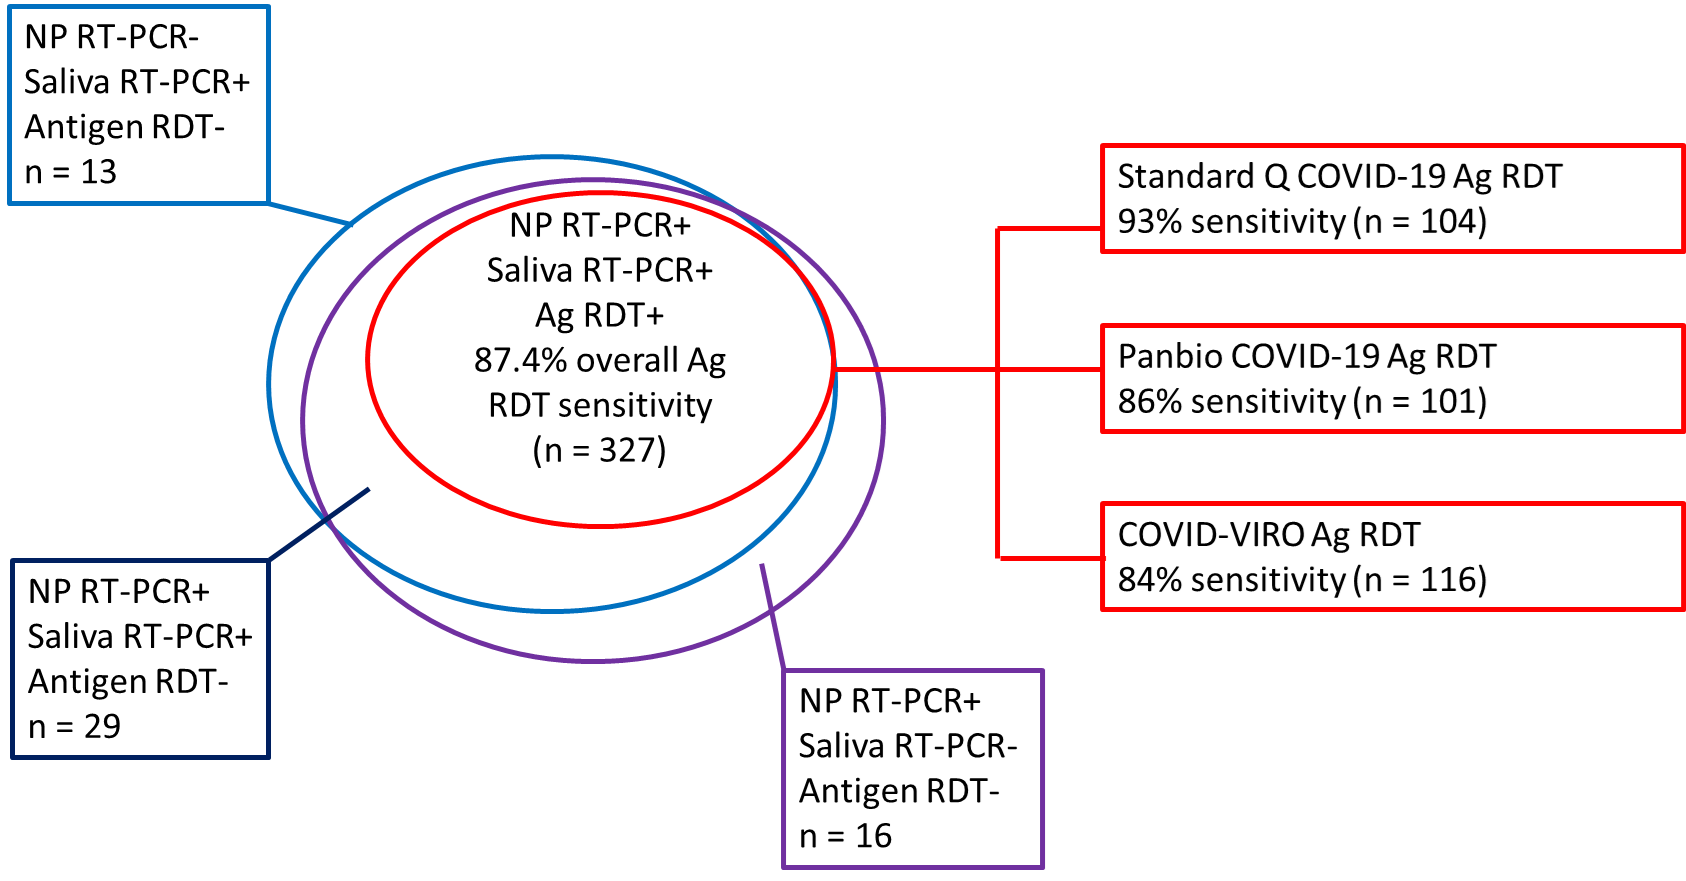
- Of 385 persons with ≥1 positive diagnostic test, 372 were positive by NP RT-PCR, 369 were positive by saliva RT-PCR, and 327 were positive by NP antigen rapid diagnostic test (Ag RDT) (Figure).
- Overall sensitivity of Ag RDTs compared with NP RT-PCR tests was 87.4% (95% CI 83.6%-90.6%) and specificity was 100% (95% CI 99.3%-100%).
- Sensitivity of Ag RDT was 96.5% (95% CI 93.6%-98.3%) for those with viral load ≥106
- Sensitivity of saliva RT-PCR compared with NP RT-PCR was 95.7% (95% CI 93.1%-97.5%).
Methods: Comparative clinical trial conducted in Switzerland from September 24 to November 4, 2020, of patients >18 years old with either symptoms compatible with COVID-19 (96%) or more minor symptoms and close contact with a documented COVID-19 case (4%). Patient specimens were tested using NP RT-PCR, saliva (self-collected) RT-PCR, or one of three Ag RDTs (selected on a rotating basis) on NP swabs. Ag RDT results were read in 15-20 minutes; PCR tests were sent to a laboratory. Limitations: Performance statistics not generalizable to asymptomatic persons, hospitalized patients, or to people presenting after 7 days of symptoms.
Implications: Ag RDT use would permit rapid identification and isolation of most persons with SARS-CoV-2 infection, especially those who are most contagious. The ability to use saliva samples for SARS-CoV-2 diagnosis may lead to more widespread testing due to acceptability.
Figure:
Note: Adapted from Schwob et al. Number of positive tests for NP RT-PCR, saliva RT-PCR, and/or Ag RDT. Ag RDT data are further broken down by the number of positive tests using different commercial tests; sensitivity is compared with NP RT-PCR as the gold standard. n-number of positive tests in each category. Licensed under CC-BY-NC-ND 4.0.
PEER-REVIEWED
Flight-associated transmission of severe acute respiratory syndrome coronavirus 2 corroborated by whole-genome sequencing. Speake et al. Emerging Infectious Diseases (December 2020).
Key findings:
- 29/64 (45%) passengers who developed symptoms consistent with COVID-19 during or after the flight tested positive for SARS-CoV-2:
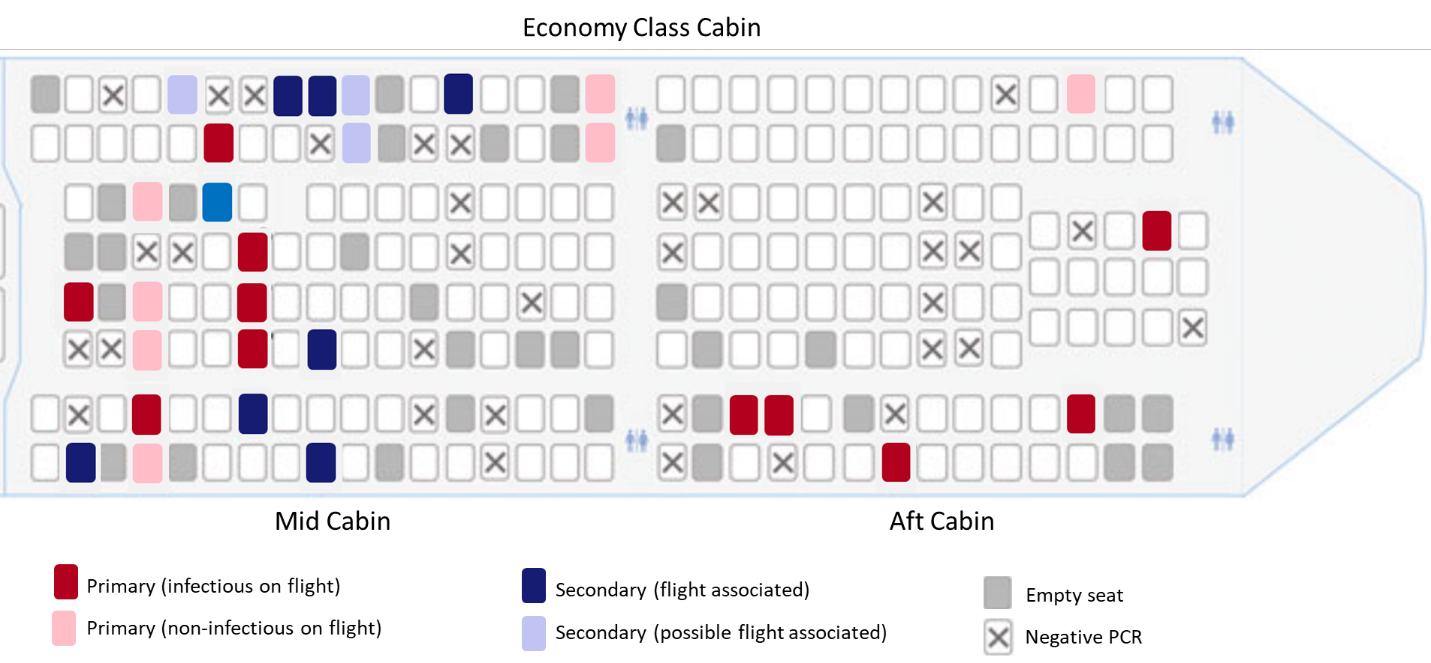
- 18/29 (62%) were primary cases (Figure).
- All 11 secondary cases occurred in persons seated in the mid-cabin (Figure).
- 8 (73%) were seated within two rows of infectious passengers.
- 7 (64%) occurred in persons with window seats.
- Genomic sequencing of SARS-CoV-2 recovered from passengers showed linkage of cases in the mid-cabin, suggesting in-flight transmission.
Methods: Cohort study of 213 passengers on a five-hour flight on March 19, 2020 in Australia. Symptomatic passengers underwent RT-PCR testing and participated in epidemiologic investigations; whole genome sequencing was completed for specimens from 25 of the 29 infected passengers. Primary cases (1) disembarked a cruise ship with a known outbreak within 14 days prior to illness and had viral sequences matching the ship outbreak strains and/or (2) developed illness before or within 48 hours after flight. Secondary cases had not been on a cruise ship with a known outbreak and developed symptoms 2–14 days after flight. Limitations: Only symptomatic passengers were tested; business class passengers and crew were excluded from analysis; little use of masks at the time of event.
Implications: This study suggests that in-flight transmission of SARS-CoV-2 is possible even to passengers seated further than 2-3 rows from an infected passenger, particularly if mitigation measures are not routinely used. Flight contact investigations assessing SARS-CoV-2 transmission may need to extend beyond neighboring seats.
Figure:
Note: Adapted from Speake et al. Spatial distribution of primary (infectious and non-infectious) and secondary (flight-associated and possibly flight-associated) cases of SARS-CoV-2 on flight from Sydney to Perth, Australia, March 19, 2020. Open access journal; all content freely available.
Transmission heterogeneities, kinetics, and controllability of SARS-CoV-2external icon. Sun et al. Science (November 24, 2020).
Key findings:
- Contact tracing in Hunan, China between January 16 and April 23, 2020 showed that 80% of secondary infections were traced back to 15% of SARS-CoV-2-infected individuals.
- 210 clusters were identified, representing 831 (71%) of cases.
- Risk of transmission was associated with the type of contact, length of exposure, and timing of symptom onset (Figure).
- Household contacts pose the highest risk of transmission before (aOR 2.20, 95% CI 1.39-3.49) and after (aOR 3.79, 95% CI 2.47-5.79) implementation of social distancing.
- Healthcare contacts pose the lowest risk of transmission before (OR 0.15, 95% CI 0.03-0.68) and after (OR 0.10, 95% CI 0.01-0.90) social distancing.
- Models suggest that complete and timely isolation/quarantine are insufficient, without other measures, to achieve pandemic control.
Methods: Records were linked from 1,178 SARS-CoV-2 patients and 15,648 of their close contacts with detailed exposure diaries collected via contact tracing to reconstruct transmission chains and identify epidemiologic clusters before and after lockdown began on January 25, 2020. The per-contact risk of transmission, with contact type, duration, symptoms, demographic factors, and different outbreak periods as covariates were modeled. The impact of population-level physical distancing, contact tracing, and timeliness of isolation/quarantine was also assessed. Limitations: Cluster investigation did not include genetic sequencing; estimates may not be generalizable.
Implications: Additional mitigation efforts may be advised within households while one or more members are in quarantine or isolation. Achieving SARS-CoV-2 pandemic control will require the synergistic efforts of case isolation, contact quarantine, and other population-level interventions.
Figure:
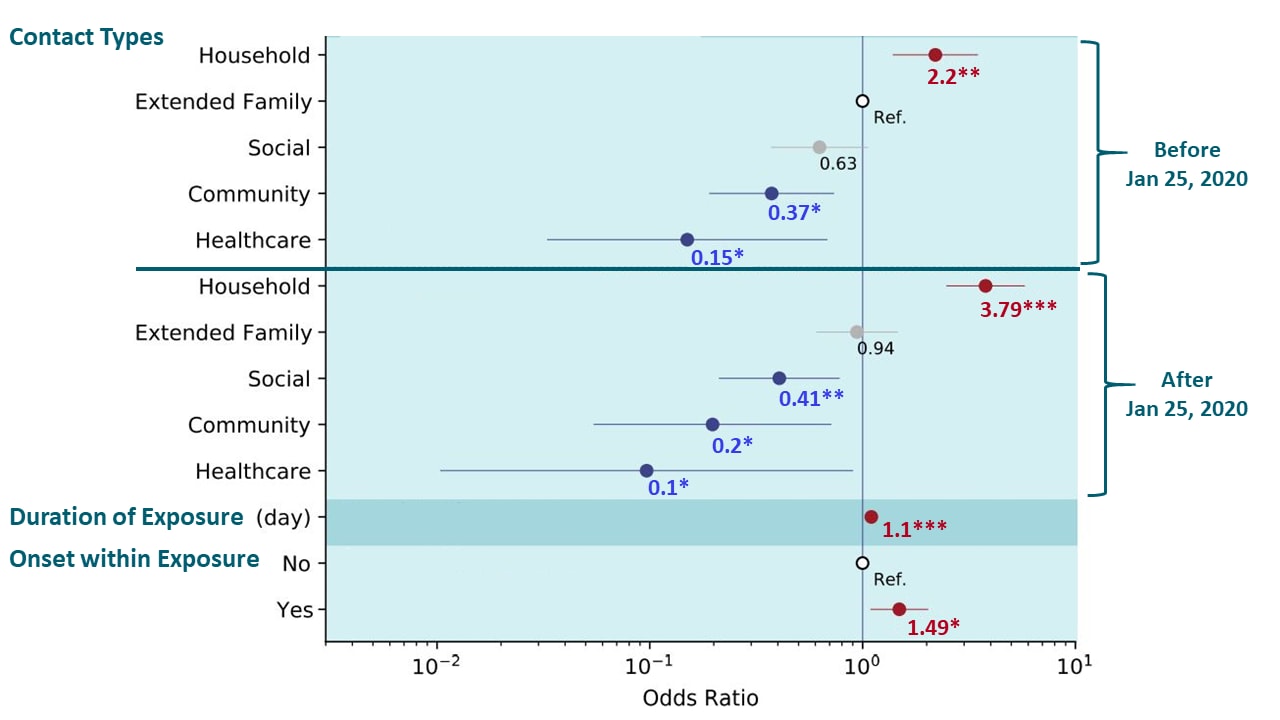
Note: Adapted from Sun et al. Individual predictors of transmission risk among close contacts of SARS-CoV-2 infected individuals in Hunan. Predictors are indicated on the left. Dots and lines indicate point estimates and 95% confidence interval of the odds ratio. Numbers below the dots indicate the numerical value of the point estimates. Ref-reference category; * p-value <0.05, ** p-value <0.01, *** p-value <0.001. Significantly increased odds are denoted in red, and significantly reduced odds are denoted in blue. Licensed under CC BY 4.0.
Mutations in the SARS-CoV-2 genome may result in different forms of the virus that have altered levels of infectivity or virulence. The following papers examine the common spike protein mutation (from D to G at position 614, referred to as D614G) and a newly-identified mutation that causes truncation of the protein known as orf3b (orf = open reading frame), which may affect these aspects of transmissibility.
A. Evaluating the effects of SARS-CoV-2 spike mutation D614G on transmissibility and pathogenicity.external icon Volz et al. Cell (November 18, 2020).
Key findings:
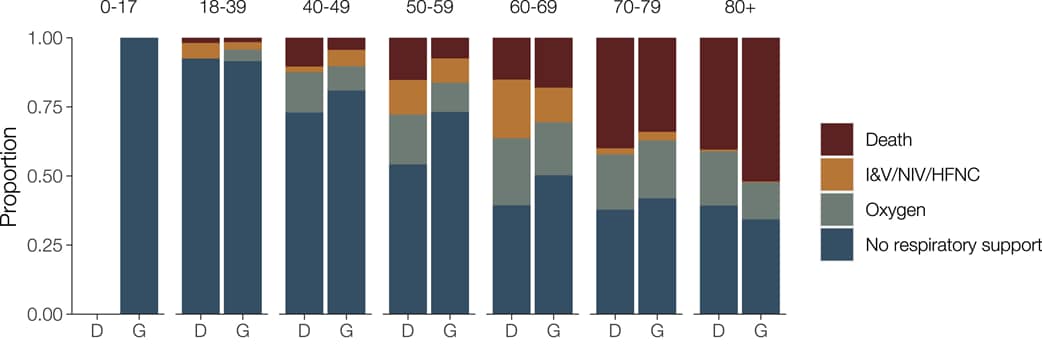
- Patients infected with the 614G variant of SARS-CoV-2 did not have increased disease severity or mortality compared with patients with the 614D variant (Figure).
- The 614G variant was associated with higher viral load and younger age of infection compared with the 614D variant.
- 614G phylogenetic clusters tend to grow to a larger size than 614D clusters after controlling for time of introduction into the United Kingdom, consistent with a transmission advantage of 614G variants.
Methods: Over 25,000 whole genome sequences from the COVID-19 Genomics UK Consortiumexternal icon collected between January 26 and June 16, 2020 were used to evaluate transmission fitness. The frequency of the spike protein variant 614G compared with the 614D variant was assessed using population genetic analysis, and the influence of spike 614D versus 614G on pathogenicity was assessed by matching sequence data with clinical outcome of 1670 patients with COVID-19. Limitations: Sampling process may not be fully randomized and systematic; most sequences are from symptomatic cases; changes in clinical outcomes over time may result from improved clinical management of COVID-19 rather than shifts in virus biology; other mutations in the SARS-CoV-2 genome were not assessed.
Figure:
Note: Adapted from Volz et al. Comparison of clinical outcome for COVID-19 patients infected with SARS-CoV-2 containing the 614D (D) or 614G (G) variant, by age group. I&V-intubation and ventilation; NIV-non-invasive ventilation; HFNC-high flow nasal cannula. Licensed under CC-BY.
B. No evidence for increased transmissibility from recurrent mutations in SARS-CoV-2.external icon van Dorp et al. Nature Communications (November 25, 2020).
Key findings:
- 185 mutations were identified that arose independently in multiple genomes.
- None of these mutations was associated with an increase or decrease in virus transmissibility based on their representation in descendants of the original virus isolated from Wuhan.
- The common D614G mutation did not associate with increased transmission (p = 0.28).
Methods: Phylogenetic analysis of recurrent and independent mutations in 46,723 SARS-CoV-2 genomes from 99 countries through September 21, 2020, was used to estimate the relative number of descendants in related clades with and without a specific mutation. A mutation found in many descendant genomes is presumed to not have changed in transmissibility of the virus. Limitations: Limited power to detect a statistically significant association with transmissibility; did not examine the additive effect of combined second mutations on transmissibility, virus transmissibility derived from genetic rather than biological analysis.
Combined implications for two summaries (Volz et al. & Van Dorp et al.): These two papers take different approaches to evaluating increased fitness of the 614G vs 614D variants of SARS-CoV-2 and come to different conclusions. Volz et al. shows that COVID-19 patients with the 614G variant did not have higher mortality than patients with the 614D variant. The question of increased transmissibility of 614G is therefore important to understand how this now-dominant variant impacted the overall number of cases and deaths due to COVID-19 in this pandemic.
Loss of orf3b in the circulating SARS-CoV-2 strainsexternal icon. Lam et al. Emerging Microbes & Infections (November 18, 2020).
Key findings:
- SARS-CoV-2 strains that lack a full-length form of orf3b (known as orfΔ3b) cluster to form a distinct population; the emergence of this population coincides with the emergence of the spike protein 614G variant.
- Approximately 24% of circulating sequences carry orfΔ3b (Figure).
- SARS-CoV-2 orfΔ3b strains circulate worldwide.
- SARS-CoV-2 orfΔ3b does not block interferon production, unlike full-length orf3b.
Methods: 150,000 sequences extracted from a global SARS-CoV-2 genomic depository were used to construct a phylogenetic tree with 106 representative sequences. Interferon production by cell cultures with orf3b and the orfΔ3b form was measured.
Implications: SARS-CoV-2 Δ3b strains have become widespread; these strains have lost the ability to block the antiviral activity of interferons, but the effect of this on virulence has yet to be determined.
Figure:
Note: Adapted from Lam et al. Emergence of orfΔ3b mutations over time (left) compared with emergence of the 614G mutation in the spike protein (right). Δ3b- orfΔ3b Licensed under CC BY 4.0.
PEER-REVIEWED
Risk Factors and outcomes of hospitalized patients with severe COVID-19 and secondary bloodstream infections: A multicenter, case-control studyexternal icon. Bhatt et al. Clinical Infectious Diseases (November 20, 2020).
Key findings:
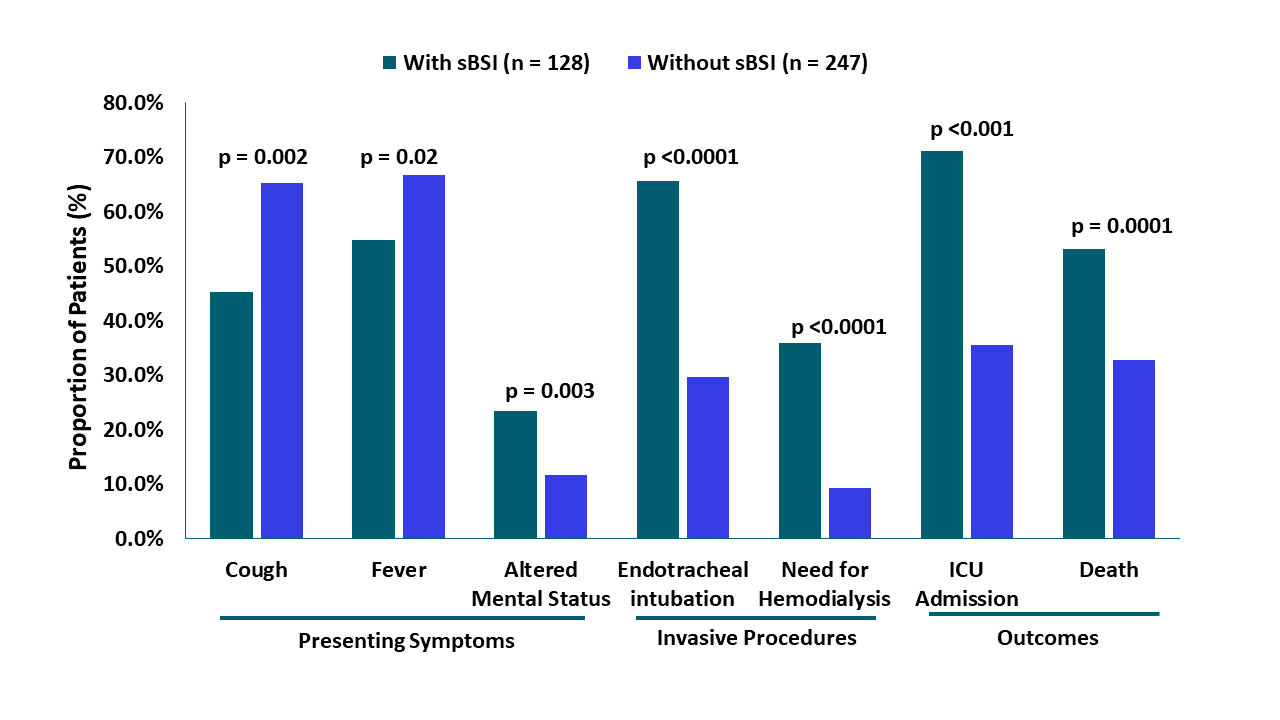
- 34% (128/375) of patients with severe COVID-19 had secondary bloodstream infections (sBSI); the majority (91%) were bacterial.
- More patients with sBSI died in-hospital than patients without sBSI (53.1% vs 32.8%; p = 0.0001).
- sBSI was also associated with:
- Higher creatinine levels (2.23 mg/dL vs 1.49 mg/dL, p = 0.001) and need for hemodialysis (35.9% vs 9.3%, p <0.0001).
- ICU admission (71.1% vs 35.6%, p <0.001) and length of stay (median 18.5 days [IQR 9, 33.5] vs 7 days [IQR 4, 12]).
- Less frequent cough (45.3% vs 65.2%, p = 0.0002) and fever (54.7% vs 66.8%, p = 0.02) (Figure).
Methods: Case control (1:2 ratio) study of 375 severe COVID-19 patients with or without sBSI from samples drawn between March 1 and May 7, 2020. COVID-19 diagnosis was confirmed by RT-PCR of NP swab specimen. Associations between sBSI and clinical presentation and outcomes were adjusted for age, sex, and race. Limitations: Most patients only had a single blood culture; the majority of sBSI had an unknown source.
Implications: Because COVID-19 patients with sBSI were more ill at presentation and had worse outcomes than those without sBSI, evaluating the effect of early treatment of sBSI in COVID-19 patients may be important to determine if this will improve clinical outcomes.
Figure:
Note: Adapted from Bhatt et al. Risk associated with presenting symptoms, invasive procedures, or outcomes in severe COVID-19 patients with sBSI and without sBSI. sBSI – secondary bloodstream infection. Permission request in process. Available via Nature Public Health Emergency Collection through PubMed Central.
Serological follow-up of SARS-CoV-2 asymptomatic subjectsexternal icon. Milani et al. Scientific Reports (November 18, 2020).
Key findings:
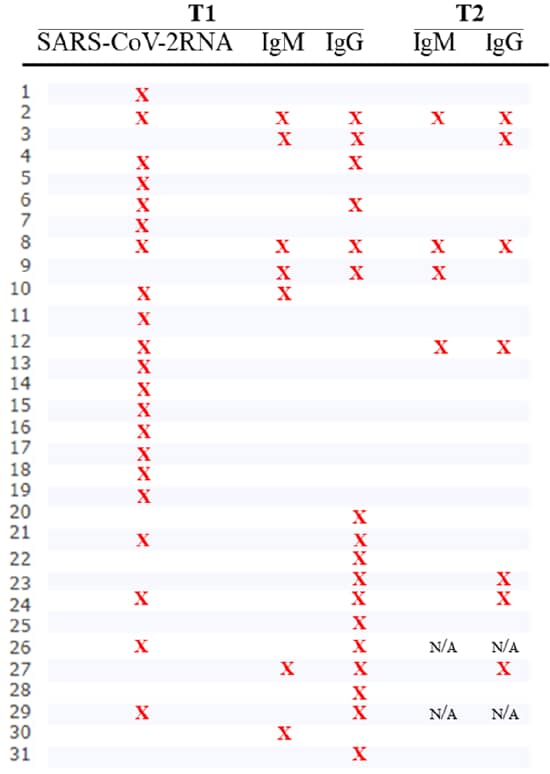
- Of 29 participants with previous evidence of SARS-CoV-2 infection, 15 (52%) did not have detectable IgM or IgG antibodies to SARS-CoV-2 spike (S) protein after 8 weeks (Figure).
- 11 of 21 participants with a positive NP RT-PCR test never developed anti-S antibodies.
- Only 6 (35%) of 17 participants who initially had detectable anti-SARS-CoV-2 IgG or IgM antibodies had detectable IgG 8 weeks later (Figure).
Methods: Serologic follow-up of 29 homebound asymptomatic participants (of 31 originally enrolled) with one or more SARS-CoV-2-positive test (RT-PCR, IgM, or IgG) at a first time point (T1) in Italy in March 2020. IgG and IgM antibodies against SARS-CoV-2 S protein were assessed at the second time point (T2) 8 weeks after T1. Limitations: Small sample size; only assessed antibodies to S protein; initial NP sample for RT-PCR was self-collected.
Implications: Persons with asymptomatic or mild SARS-CoV-2 may not develop antibodies and the durability antibody-mediated immunity following mild SARS-CoV-2 may be short.
Figure:
Note: Adapted from Milani et al. For each participant, X indicates detectable viral RNA or IgM or IgG at baseline (T1) or 8 weeks of follow-up (T2) of a study of homebound asymptomatic participants. N/A-not applicable as subjects withdrew from study. Licensed under CC BY 4.0.
Dynamic changes in anti-SARS-CoV-2 antibodies during SARS-CoV-2 infection and recovery from COVID-19.external icon Li et al. Nature Communications. November 27, 2020.
Key findings:
- Patients with severe COVID-19 had a one-week delay in generating antibody responses but developed a stronger response during the middle and late stages of illness compared with patients with mild/moderate COVID-19 (p = 0.002).
- Antibody levels among COVID-19 patients who went on to die were lower than those who survived (p = 0.01).
- COVID-19 patients with the lowest 33% of anti-SARS-CoV-2 IgG levels (weak response) had a longer duration of viral shedding than those with the highest 33% IgG levels (strong response) (Figure).
- Four patients had a newly positive NP RT-PCR test after discharge, despite testing RT-PCR negative twice prior to discharge.
- One of these had a weak antibody response to spike (S) and receptor binding domain (RBD) at the time of first discharge.
- The other three did not have antibody tests prior to the first discharge but had a weak antibody response to S and RBD at the time of the second discharge.
Methods: Temporal analysis of SARS-CoV-2-specific antibody levels among 795 mild/moderate and 1,055 severe/critical hospitalized COVID-19 patients between February 4 and March 30, 2020. Changes in total antibody, S protein, RBD, and nucleoprotein (N)-specific IgG levels were measured for 12 weeks from admission, during hospitalization, and discharge. A subset was evaluated for relationships between antibody response, clinical outcomes, and viral shedding. Limitations: Longitudinal testing data was available on select patients; potential inclusion of false-negative viral RNA tests.
Implications: Patients who produced antibodies earlier developed less severe disease, suggesting that antibodies against the S and RBD proteins decrease viral shedding. The authors speculate there is a higher chance of reinfection among these patients with low anti-S or anti-RBD antibody levels, and these patients may need close monitoring after discharge.
Figure:

Note: Adapted from Li et al. Kaplan–Meier curves of the viral shedding time in patients with strong and weak antibody responses. The X axis represents the duration of viral shedding (days). The Y axis represents the positive rate of viral RNA. P values were calculated with the log-rank test. Licensed under CC BY 4.0.
PEER-REVIEWED
Safety and immunogenicity of ChAdOx1 nCoV-19 vaccine administered in a prime-boost regimen in young and old adults (COV002): a single-blind, randomised, controlled, phase 2/3 trialexternal icon. Ramasamy et al. Lancet (November 19, 2020).
Key findings:
- Reactions were less common in participants ≥56 years of age compared with those <56 years old.
- At least one local symptom was reported after dose by 88% of participants in the 18–55 years group, 73% in the 56–69 years group, and 61% in the >70 years group.
- 13 serious adverse events occurred during the study period, none considered to be related to vaccination.
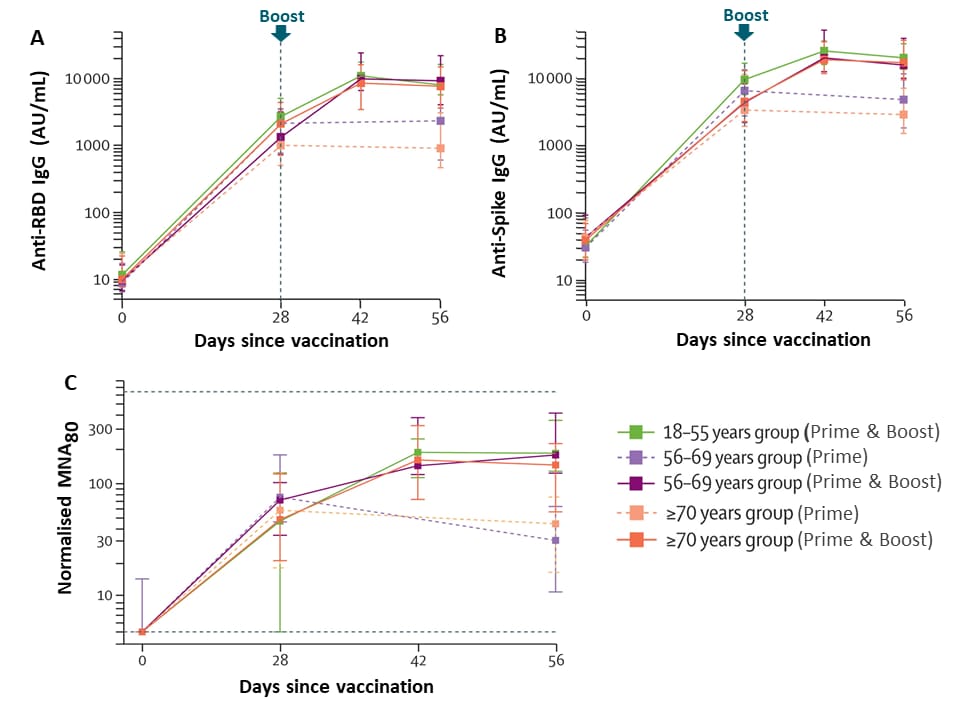
- Antibody levels and viral neutralization were similar across age groups after the prime and boost vaccinations for the standard dose (Figure).
- Participants receiving low-dose vaccine had similar anti-spike antibody titers at 28 days as the standard dose participants (p = 0.12 adjusted for age).
Methods: Between May 30 and August 8, 2020, 560 healthy adults were enrolled in a Phase 2/3 clinical trial reporting on safety and immunogenicity of low and standard dose ChAdOx1 nCoV-19 vaccine, with or without a booster given 28 days later, compared with a control vaccine. Participants were recruited using escalated recruitment into subgroups by age (18–55 years, 56–69 years, and >70 years). Tests for IgG and virus neutralization were done at days 28, 42, and 56. Limitations: Single blind study design, few participants >80 years of age.
Implications: ChAdOx1 nCoV-19 vaccine was well-tolerated and generated neutralizing antibodies against SARS-CoV-2 in older adults, the most at-risk population; efficacy data are forthcoming.
Figure:
Note: Adapted from Ramasamy et al. In the standard dose group, SARS-CoV-2 IgG response to the receptor binding domain (A), the spike protein (B), and virus neutralization (C). In A and B, the vertical dotted line indicates when the boost was given for the two-dose group. In C, dotted horizontal lines show the upper and lower limits for the assay. Datapoints are medians, whiskers show the IQRs. RBD-receptor binding domain. MNA80,-microneutralisation assay. Licensed under CC-BY-NC-ND.
Detection, Burden, and Impact
- Babady et al. Performance of severe acute respiratory syndrome coronavirus 2 real-time RT-PCR tests on oral rinses and saliva samples.external icon Journal of Molecular Diagnostics. Results suggest that saliva is an acceptable alternative to NP swabs for SARS-CoV-2 RNA detection by RT-PCR.
- Klumpp-Thomas et al. D614G spike variant does not alter IgG, IgM, or IgA spike seroassay performance.external icon The Journal of Infectious Diseases. Sera from convalescent COVID-19 patients react to both the 614D and 614G variants of SARS-CoV-2 spike protein.
Protection: Personal Protective Equipment
- Kirubarajan et al. Mask shortage during epidemics and pandemics: A scoping review of interventions to overcome limited supply.external icon BMJ Open. Identified strategies for overcoming facemask shortages during epidemics and pandemics: included use of stockpiled masks, extended wear of disposable masks, and decontamination.
- Lerner et al. Preventing the spread of SARS-CoV-2 with masks and other “low-tech” interventionsexternal icon. JAMA. The role of masks, physical distancing, hand hygiene, prompt testing and limiting crowds and gatherings are still considered important to prevent the spread of SARS-CoV-2, especially during the initial rollout of vaccination.
Natural History of Infection: Spectrum and Clinical Course
- Meinhardt et al. Olfactory transmucosal SARS-CoV-2 invasion as a port of central nervous system entry in individuals with COVID-19external icon. Nature Neuroscience. Provides evidence that SARS-CoV-2 can invade the nervous system and occurs at the neural–mucosal interface by transmucosal entry via regional nervous structures.
- Lee et al. Evidence of severe acute respiratory syndrome coronavirus 2 reinfection after recovery from mild coronavirus disease 2019.external icon Clinical Infectious Diseases. One patient who had a positive SARS-CoV-2 test followed by two negative RT-PCR tests subsequently tested RT-PCR positive for a different strain of SARS-CoV-2, suggesting re-infection.
Natural History of Infection: Characterize Immune Response
- McMahan et al. Correlates of protection against SARS-CoV-2 in rhesus macaques external icon. Nature. Anti-SARS-CoV-2 IgG, even at low levels, and CD8+ T cells provided protection to rhesus macaques from SARS-CoV-2 infection.
- Widge et al. Durability of responses after SARS-CoV-2 mRNA-1273 vaccinationexternal icon. NEJM. The Moderna vaccine candidate mRNA-1273 induced neutralizing antibody that lasted 3 months in all age groups tested (18-55, 56-70, and >71 years) with minimal waning of antibody titers over time; follow-up to 13 months is planned.
Prevention: Vaccines
- Mahase E. COVID-19: What do we know about the late stage vaccine candidates?external icon BMJ. Summary of the status of phase III vaccine trials currently in progress.
- Mullard A. How COVID vaccines are being divvied up around the worldexternal icon. Nature News. Details pre-orders of the vaccines currently in trials and charts out doses per person ordered by countries worldwide.
Social, Behavioral, and Communication Science
- Kruse et al. Readability, content, and quality of COVID-19 patient education materials from academic medical centers in the United Statesexternal icon. American Journal of Infection Control. The content of web-based patient education materials from 141 medical schools was found to be lacking in actionability and had readability above the recommended 6th grade reading level.
- Banker et al. Evaluating prosocial COVID-19 messaging frames: Evidence from a field study on Facebookexternal icon. Judgement and Decision Making. Ad messages placed in March 2020 that used a self-focused frame (“protect yourself”) or a close prosocial frame (“protect your loved ones”) were equally effective, significantly more so than using a distant prosocial frame (“protect your community”).
- Pan et al. Quantifying human mobility behaviour changes during the COVID-19 outbreak in the United Statesexternal icon. Science Reports. Proposes a Social Distancing Index that captures people’s mobility patterns and could be used by policy makers to assess the impact of local government mandates or to evaluate potential risks.
Disclaimer: The purpose of the CDC COVID-19 Science Update is to share public health articles with public health agencies and departments for informational and educational purposes. Materials listed in this Science Update are selected to provide awareness of relevant public health literature. A material’s inclusion and the material itself provided here in full or in part, does not necessarily represent the views of the U.S. Department of Health and Human Services or the CDC, nor does it necessarily imply endorsement of methods or findings. While much of the COVID-19 literature is open access or otherwise freely available, it is the responsibility of the third-party user to determine whether any intellectual property rights govern the use of materials in this Science Update prior to use or distribution. Findings are based on research available at the time of this publication and may be subject to change.

