COVID-19 Science Update released: November 24, 2020 Edition 66

The COVID-19 Science Update summarizes new and emerging scientific data for public health professionals to meet the challenges of this fast-moving pandemic. Weekly, staff from the CDC COVID-19 Response and the CDC Library systematically review literature in the WHO COVID-19 databaseexternal icon, and select publications and preprints for public health priority topics in the CDC Science Agenda for COVID-19 and CDC COVID-19 Response Health Equity Strategy.
***From now till the beginning of 2021 the COVID-19 Science Update will be produced only on Tuesdays. ***
Here you can find all previous COVID-19 Science Updates.
Understanding changes in survival from COVID-19 and assessing where and in what populations there have been improvements in mortality rates is important to learn what more can be done to improve outcomes. Below we share two summaries of studies looking at survival in hospitalized patients with COVID-19 and potential reasons for increased survival from COVID-19 as the pandemic has progressed.
PEER-REVIEWED
A. Improving survival of critical care patients with coronavirus disease 2019 in England: A national cohort study, March to June 2020.external icon Dennis et al. Critical Care Medicine (October 26, 2020).
Key findings:
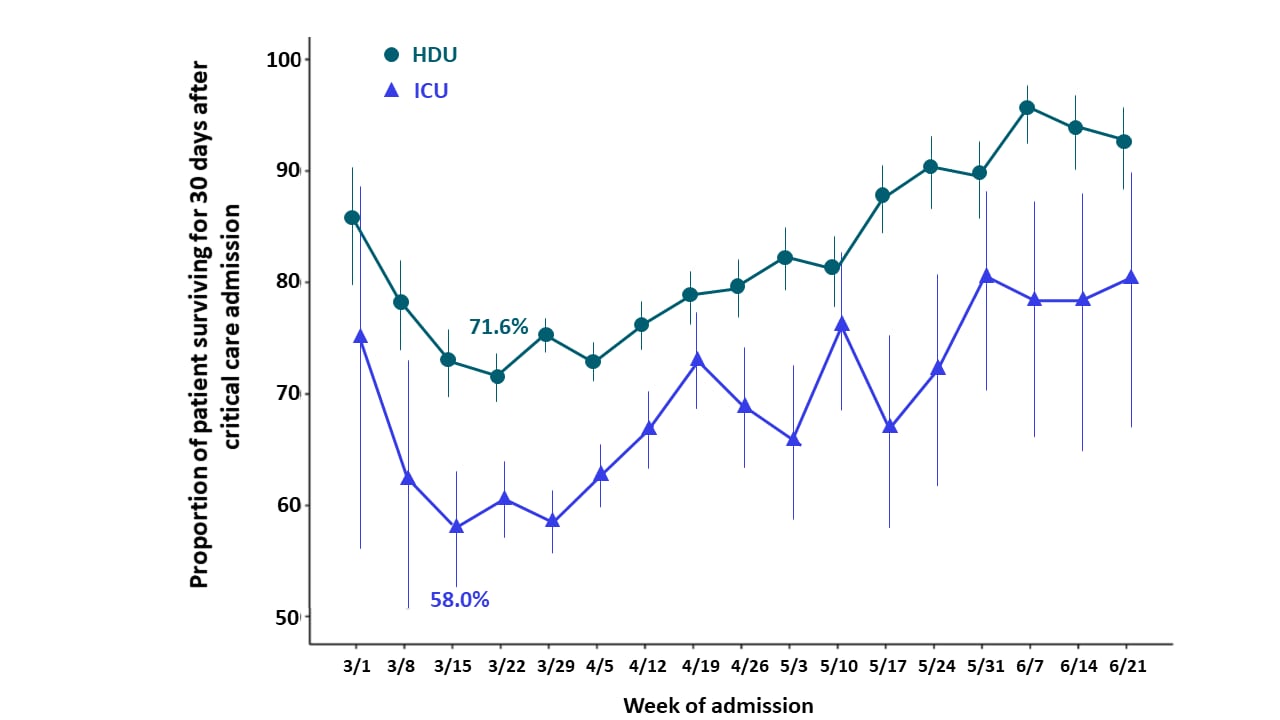
- Unadjusted estimates of survival were lowest in early March 2020 (Figure).
- 71.6% in high dependency unit (HDU).
- 58.0% in ICU.
- After the week of March 29, 2020, survival improved per week by:
- 12.7% in HDU patients (adjusted hazard ratio [aHR] 0.87, 95% CI 0.86-0.89).
- 8.9% in ICU patients (aHR 0.91, 95% CI 0.89-0.93).
Methods: Retrospective cohort study among 21,082 adults ≥18 years with severe COVID-19 admitted to HDU or ICU in England, between March 1 and June 27, 2020. The primary outcome was in-hospital 30-day all-cause mortality. Survival was estimated controlling for age, sex, ethnicity, major comorbidities, and geographical region. Limitations: Reporting delays may have led to incomplete ascertainment of death in more recent weeks, although all eligible patients had a minimum of 30 days follow-up.
Figure
Note: Adapted from Dennis et al. In-hospital survival for people admitted to HDU and ICU with COVID-19. Bars represent 95% CI. Reprinted with permission from Dennis et al., Improving survival of critical care patients with coronavirus disease 2019 in England: A national cohort study, March to June 2020, Critical Care Medicine, Society of Critical Care Medicine.
B. Trends in COVID-19 risk-adjusted mortality rates.external icon Horwitz et al. Journal of Hospital Medicine (October 23, 2020).
Key findings:
- Adjusted mortality from COVID-19 decreased from 25.6% in March 2020 to 7.6% in August 2020.
- The standardized mortality ratio declined from 1.26 (95% CI, 1.15-1.39) in March to 0.38 (95% CI, 0.12-0.88) in August.
- The probability of death decreased by 18.2% from March to August 2020, even when adjusting for changes in demographics and clinical severity.
Methods: Analysis of monthly mortality rates and demographic changes among 5,118 adults ≥18 years with SARS-CoV-2 infection admitted to an academic health system in New York City, from March 1 to August 31, 2020 with outcomes obtained through October 8, 2020. The standardized mortality ratio is the ratio of observed to expected deaths. Limitations: A single region and health system may limit generalizability; observational study limits ability to determine which factors contributed to the changes seen; admission thresholds may have changed over the time period.
Implications from 2 studies (Dennis et al. & Horwitz et al.): Improved survival of patients with COVID-19 over time was seen in the United States and England and was also described by Oke et alexternal icon in a study in Germany. Ledford, Hexternal icon suggests this may be due to improvement in patient management, timing of admission to critical care units, change in hospital capacity, improved understanding of disease progression, and expanded use of steroids.
PEER-REVIEWED
Association of country-wide coronavirus mortality with demographics, testing, lockdowns, and public wearing of masks.external icon Leffler et al. American Journal of Tropical Medicine and Hygiene (October 26, 2020).
Key findings:
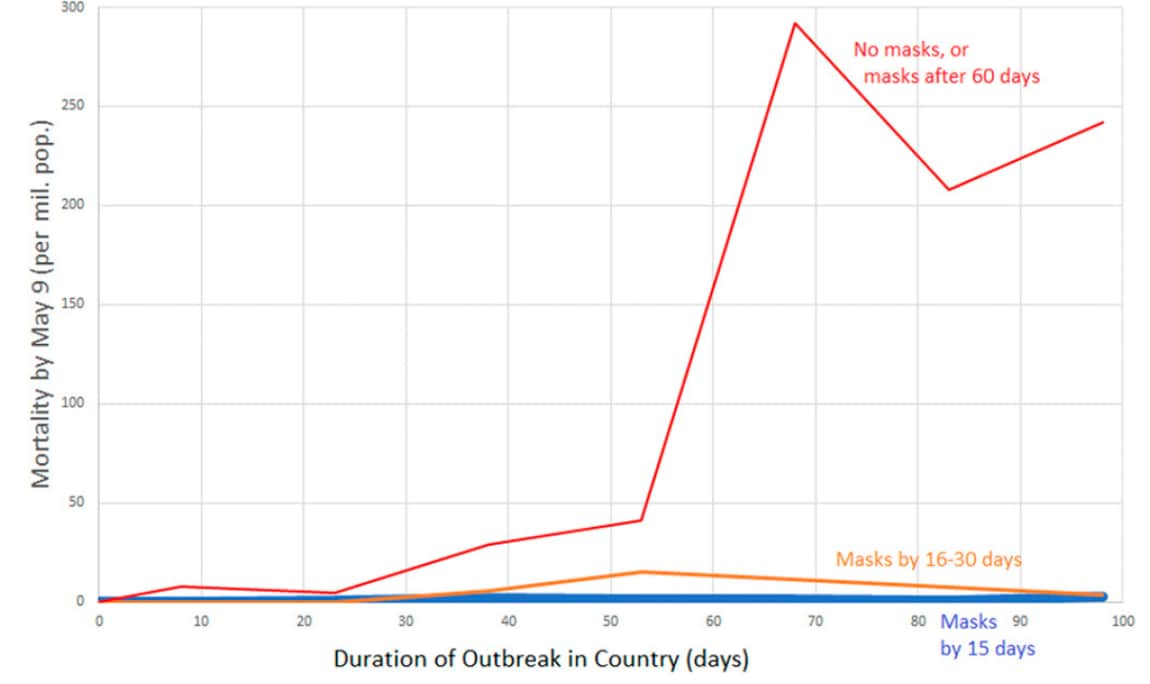
- Early adoption of mask wearing recommendations was associated with low per-capita mortality (Figure).
- Duration of outbreak and proportion of population >60 years was associated with high mortality.
- COVID-19 mortality increased on average by 16.2% each week in countries with mask wearing norms and policies, compared with 61.9% each week in countries without.
- Societal norms and government policies supporting mask wearing and international travel restrictions were independently associated with low per-capita COVID-19 mortality.
Methods: Multivariable linear regression analysis of 196 countries examining association of COVID-19 mortality and age, gender, obesity prevalence, temperature, urbanization, smoking, during of outbreak, lockdowns, viral testing, contact-tracing policies, and public mask-wearing norms and policies. Limitations: COVID-19 mortality rates relied on country reporting and assumed no geographic variation within country; predictor variables not standardized.
Implications: Recommended mask-wearing and international travel restrictions are effective mitigation strategies to reduce the spread of COVID-19.
Figure:
Note: From Leffler et al. Per-capita COVID-19 mortality by May 9 by duration of outbreak for no masks or masks adopted >60 days after the outbreak, masks adopted by 16-30 days after the outbreak, or masks adopted by 15 days after the outbreak. Licensed under CC-BY.
Age-specific mortality and immunity patterns of SARS-CoV-2.external icon O’Driscoll et al. Nature (November 2, 2020).
Key findings:
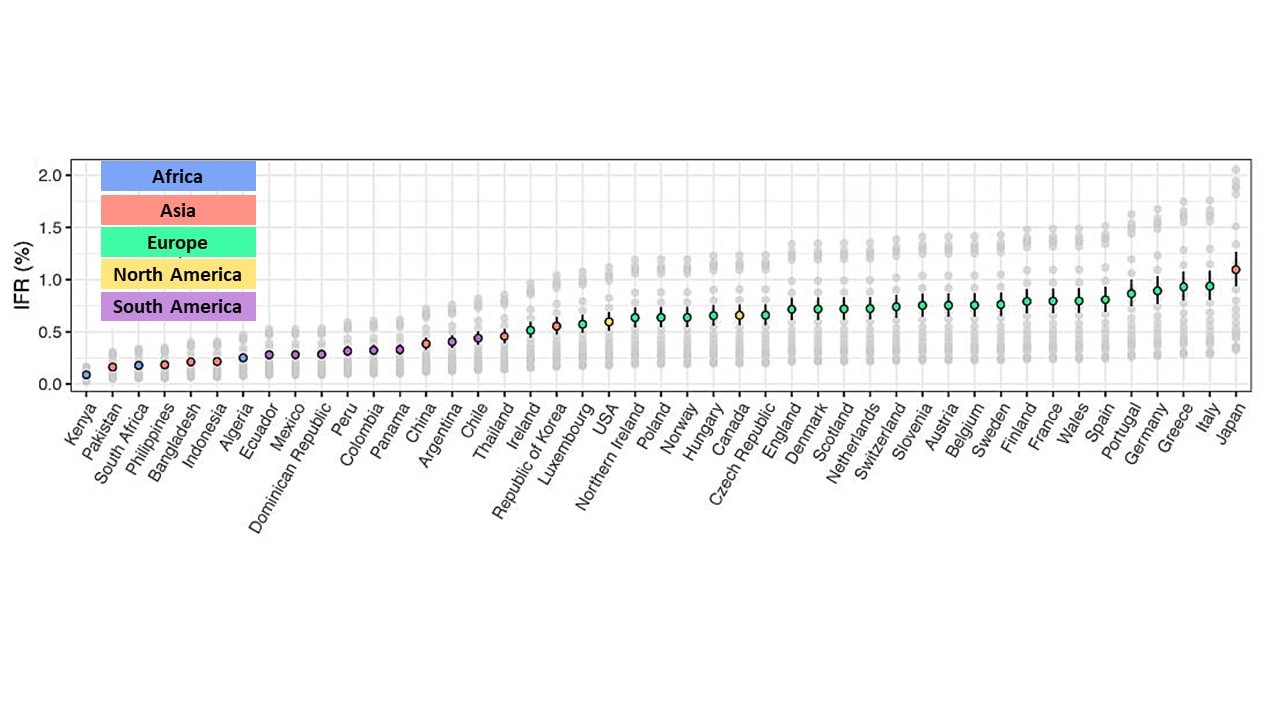
- Infection fatality rates (IFRs) were higher in countries with older populations, such as Japan (1.09%, 95% Credible Interval [CrI] 0.94%-1.26%) and Italy (0.94%, 95% CrI 0.80%-1.08%), compared with countries with younger populations, such as Kenya (0.09%, 95% CrI 0.08%-0.10%), and Pakistan (0.16%, 95% CrI 0.14% – 0.19%) (Figure).
- IFR increased a mean of 0.59% per 5-year increase in age.
- Risk of death was higher for men than women, and for persons >80 years (10.83%; 95% CrI 9.28%-12.52% vs 5.76%, 95% CrI 4.94%-6.66%, respectively)
Methods: Modeling study integrating COVID-19 death rates with SARS-CoV-2 seroprevalence data. Expected age- and sex-specific IFR were derived from seroprevalence studies and compared with reported numbers of deaths. Limitations: Both reported death and seroprevalence data could be inaccurate; heterogeneity in transmission across countries might have limited the ability to estimate IFR.
Implications: Significant IFR variability across settings is likely to occur, in part as a result of the age of the population and variation in transmission patterns.
Figure:
Note: Adapted from O’Driscoll et al. Modeled median and 95% CrI of population weighted IFR estimates. Colored dots represent the median estimate for each country colored by continent where country is located: Africa, Asia, Europe, North America, and South America). Gray dots represent the median estimates for each country for each individual seroprevalence survey. Reprinted by permission from Springer Nature Customer Service Centre GmbH: Springer [NATURE] Age-specific mortality and immunity patterns of SARS-CoV-2, O’Driscoll et al., COPYRIGHT 2020.
PEER-REVIEWED
Distinct antibody responses to SARS-CoV-2 in children and adults across the COVID-19 clinical spectrum.external icon Weisberg et al. Nature Immunology (November 5, 2020).
Key findings:
- Adults with severe COVID-19 acute respiratory distress syndrome (ARDS) had higher levels of IgG, IgA, and IgM antibodies against spike (S) protein compared with adult convalescent plasma donors (CPD) or children with or without multisystem inflammatory syndrome (MIS-C) (p <0.001, Figure 1).
- There was no difference in any antibody measured in children with MISC-C compared with those without MIS-C (Figure 1).
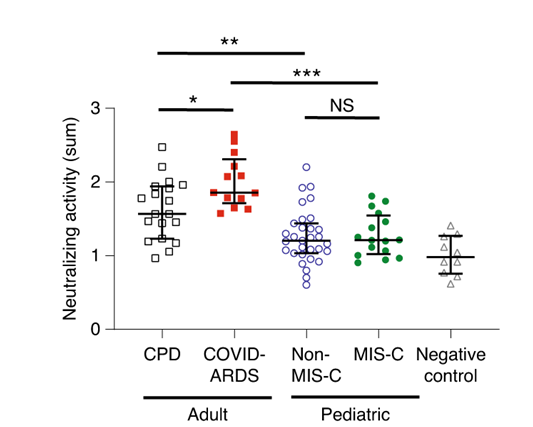
- Plasma from adults had significantly higher levels of neutralizing activity against SARS-CoV-2 compared with plasma from children (Figure 2).
Methods: Antibodies against S and N protein (IgA and IgM from secretions and IgG from plasma) and virus neutralization was measured in 19 adult CPD who recovered from mild COVID-19, 13 persons with COVID-19 ARDS, 16 children hospitalized with MIS-C, and 31 children with SARS-CoV-2 infection based on PCR or antibody (pediatric) and negative control pre-pandemic serum (n = 10). Limitations: Small sample size.
Implications: Children with SARS-CoV-2 infection have distinct antibody profiles compared with adults; these differences should be considered in vaccine development. Similar antibody profiles in children with or without MIS-C suggests that antibody responses are likely not involved in development of MIS-C.
Figure 1
Note: Adapted from Weisberg et al. IgG antibodies against S (A), IgM antibodies against S (B), and IgA antibodies against S (C) in CPD adults, COVID-ARDS adults, non-MIS-C children, MIS-C children, and negative controls. NS, not significant. ***p <0.001. Reprinted by permission from Springer Nature Customer Service Centre GmbH: Springer [NATURE Distinct antibody responses to SARS-CoV-2 in children and adults across the COVID-19 clinical spectrum, Weisberg et al., COPYRIGHT 2020.
Figure 2
Note: Adapted from Weisberg et al. Neutralizing antibodies against SARS-CoV-2 in CPD adults, COVID-ARDS adults, Non-MIS-C children, MIS-C children, and negative controls. NS, not significant. * p<0.05, **p <0.01, ***p <0.001. Reprinted by permission from Springer Nature Customer Service Centre GmbH: Springer [NATURE Distinct antibody responses to SARS-CoV-2 in children and adults across the COVID-19 clinical spectrum, Weisberg et al., COPYRIGHT 2020.
Despite increasing evidence that wearing face masks and maintaining physical distance are effective at limiting SARS-CoV-2 transmission, implementation of these measures has not been consistently high. It is of critical importance to understand the beliefs, attitudes and perceptions that could be influencing behaviors underlying adherence and non-adherence to these mitigating interventions.
PEER-REVIEWED
A. Public perceptions of the effectiveness of recommended non-pharmaceutical intervention behaviors to mitigate the spread of SARS-CoV-2external icon. Kasting et al. PLoS One (November 4, 2020).
Key findings:
- 52% of the respondents perceived that CDC-recommended non-pharmaceutical intervention (NPI) behaviors were effective.
- Factors positively associated with a higher perceived effectiveness of NPIs included older age (adjusted [a]OR 1.01 per year, 95% CI 1.00-1.01), female sex (aOR 1.34, 95% CI 1.13–1.59), greater COVID-19-related worry (aOR 1.82, 95% CI 1.64-2.02), and greater sense of threat of COVID-19 to personal physical health (aOR 1.32, 95% CI 1.20-1.45).
- Factors negatively associated with a higher perceived effectiveness of NPIs included a greater sense that becoming infected is inevitable (aOR 0.85, 95% CI 0.77-0.94) and having a moderate (aOR 0.79, 95% CI 0.64–0.97) or conservative political affiliation (aOR 0.62, 95% CI 0.49–0.78).
Methods: An online survey of 3,474 US adults from May 4 to 11, 2020 assessed perceptions of effectiveness of NPI behaviors to prevent SARS-CoV-2 infection. Respondents were classified as “higher perceived effectiveness” or “lower perceived effectiveness” groups for analysis. NPI behaviors included were frequent handwashing, social distancing, wearing masks, covering coughs and sneezes, cleaning and disinfecting surfaces, and being alert for COVID-19 symptoms. Limitations: Causal relationships cannot be determined; possibility of perceptions changing over time.
B. The impact of believing you have had COVID on self-reported behavior: Cross-sectional survey.external icon Smith et al. PLOS One (November 4, 2020).
Key findings:
- 1,493 respondents (24.3%) thought they had had COVID-19.
- 575 (9.4%) respondents reported being tested, of whom 245 (42.6%) reported a positive result.
- Of 330 people who tested negative, 187 (56.7%) still believed they previously had COVID-19.
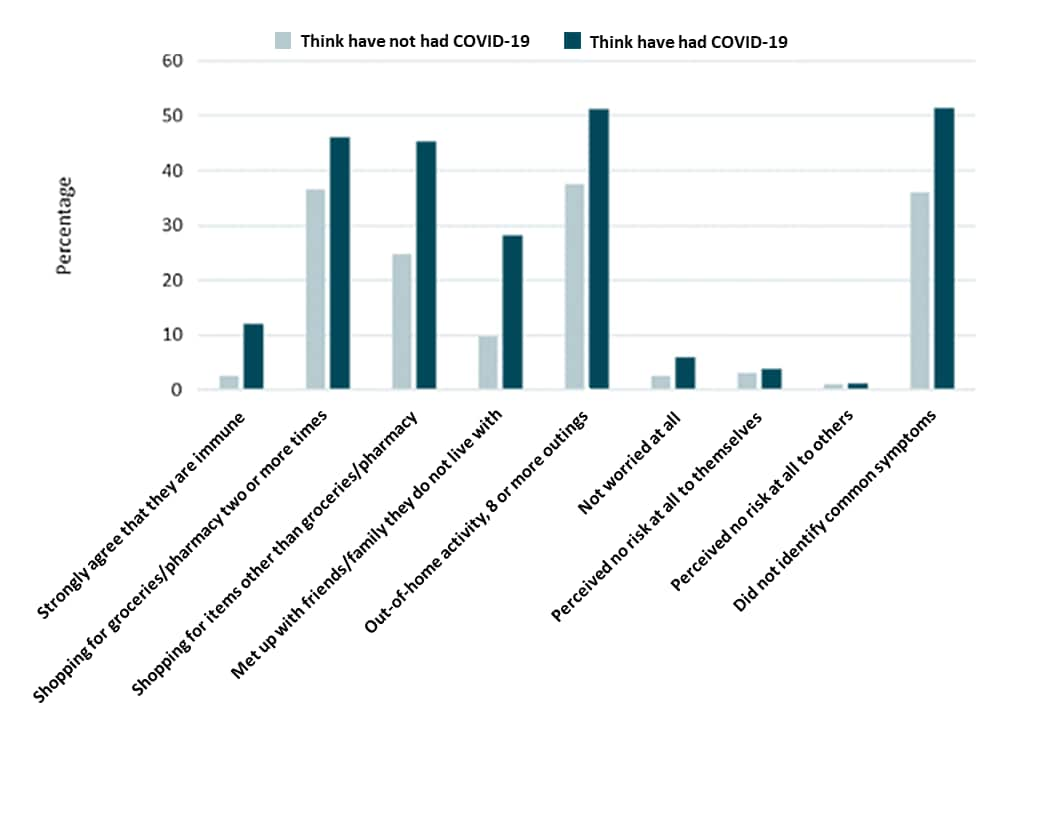
- Respondents who believed they previously had COVID-19 were more likely to believe they were immune to SARS-CoV-2 infection (42.9% vs. 10.7%) and less likely to adhere to mitigation measures (Figure).
Methods: Cross-sectional online survey of 6,149 adults ≥18 years between April 20 and 22, 2020. Respondents reported if they thought they had COVID-19, if they had been tested (and if so, what was the test result), and what mitigation measures they observed. Limitations: Data from April 2020 might not represent later attitudes or behavior; study conducted prior to widespread testing.
Figure:
Note: Adapted from Smith et al. Beliefs and behaviors of participants who think they have not had COVID-19 and those who think they have had COVID-19 and of April 20, 2020. Licensed under CC-BY 4.0.
Implications for 2 studies (Kasting et al. & Smith et al.): Messages that appropriately emphasize the potential health consequences of infection and how becoming infected is not inevitable should be targeted to those who are younger, more politically moderate or conservative, and male. Uncertainties surrounding immunity, and the importance of continuing to practice NPIs in the face of these uncertainties, should also be addressed.
Military housing, whether in barracks or on an aircraft carrier, are close quarters that may facilitate transmission of SARS-CoV-2. Following are two summaries related to transmission in close quarters.
PEER-REVIEWED
A. An outbreak of COVID-19 on an aircraft carrier.external icon Kasper et al. NEJM (November 11, 2020).
Key findings:
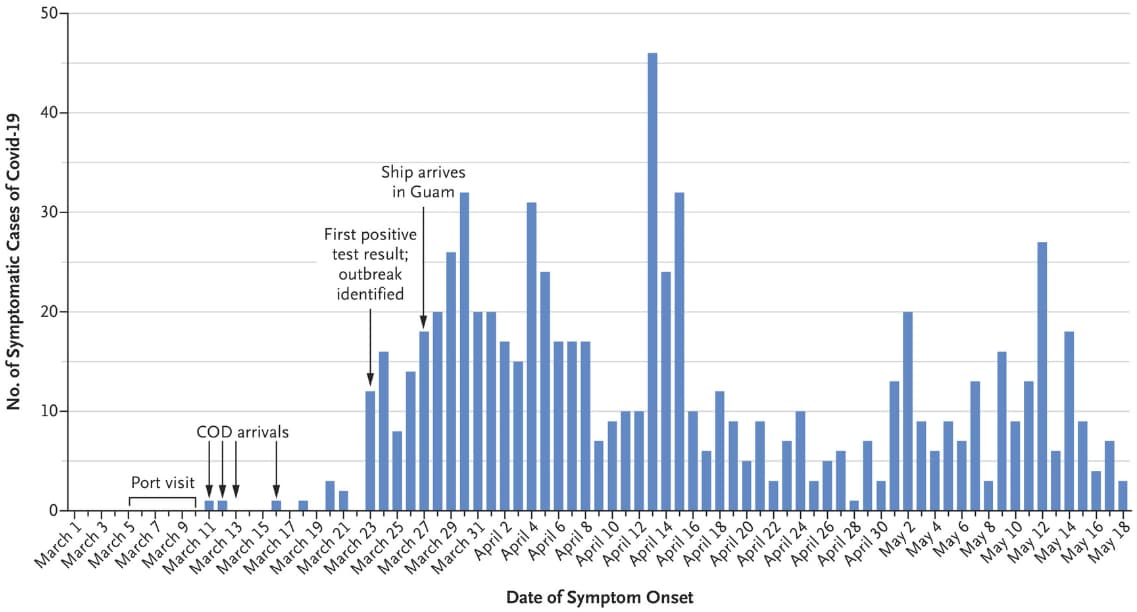
- 1,271 (27%) of 4,779 previously healthy navy crew members (mean age = 27) of an aircraft carrier became infected with SARS-CoV-2 (Figure).
- The first three cases presented after 13 days at sea.
- Four days later, the carrier docked in Guam and all crew were quarantined in separate hotel rooms.
- 77% (978/1,271) of crewmembers with confirmed COVID-19 were asymptomatic at the time of initial test and only about half (55%) later developed symptoms; overall, 572 (45%) of confirmed infections remained asymptomatic.
- 23 crew were hospitalized, four in the ICU, and one death occurred.
Methods: Retrospective review of transmission of SARS-CoV-2 among 4,779 crew of an aircraft carrier between March 11 and May 18, 2020. All crew who tested positive by RT-PCR were placed in isolation and underwent symptom monitoring twice a day. Limitations: Contact tracing did not include other potential contacts.
Figure:
Note: Adapted from Kasper et al. COVID-19 cases among aircraft carrier crew between March and May 2020. COD, carrier onboard deliveries of personnel, supplies and mail. From NEJM, Kasper et al., An outbreak of COVID-19 on an aircraft carrier, Copyright © 2020 Massachusetts Medical Society. Reprinted with permission from Massachusetts Medical Society.
B. SARS-CoV-2 transmission among marine recruits during quarantineexternal icon. Letizia et al. NEJM (November 11, 2020).
Key findings:
- There were 77 infections (2.3%) detected among 3,402 recruits.
- 16 recruits were SARS-CoV-2-positive on arrival to the closed campus and 15 were asymptomatic.
- 55 recruits had a positive test by day 14 and of these, 46 were asymptomatic.
- 24 (31%) of the 77 infected recruits had an infected roommate.
- No infections were detected by daily symptom monitoring.
- Genotyping identified six clusters indicating local transmission.
Methods: A study in Marine recruits who self-quarantined 2 weeks at home and then were under supervised quarantine (double occupancy sleeping rooms, shared bathrooms and dining halls) at a closed campus for another 2 weeks between May 15 and July 14, 2020. While at the closed campus, they were tested by RT-PCR on days 0-2, 7, and 14. Phylogenic analysis of viral genomes were conducted to assess transmission routes. Limitations: On-campus quarantine was done with 2 persons per room and interactions were not closely tracked; 1,554 (45.7%) recruits were retested only on day 14.
Implications from 2 studies Kasper et al. & Letizia et al.: In close quarters, rapid extensive transmission of SARS-CoV-2 may occur. To protect service members, Michaelexternal icon, N. suggests a mandatory 14-day quarantine prior to confinement in close quarters, but Letizia et al.external icon suggest that even two weeks of prior self-quarantine plus two-weeks on-base quarantine was not adequate. These data provide evidence of the need to test asymptomatic individuals, particularly when dealing with young, healthy individuals, especially in settings with close quarters.
PEER-REVIEWED
Mobility network models of COVID-19 explain inequities and inform reopening.external icon Chang et al. Nature (November 10, 2020).
Key findings:
- Mobility in the United States between Census Block Groups (CBGs) and non-residential points of interest (POIs: e.g., restaurants, gyms) decreased, starting in March 2020. In Chicago:
- Mobility decreased 54.7% between the first week of March and the first week of April 2020.
- With no reduction in mobility, estimated infection rates were 6.2 times greater (95% CI 5.2-7.1).
- An estimated 10% of visits to POIs accounted for 85% (95% CI 83%-87%) of infections.
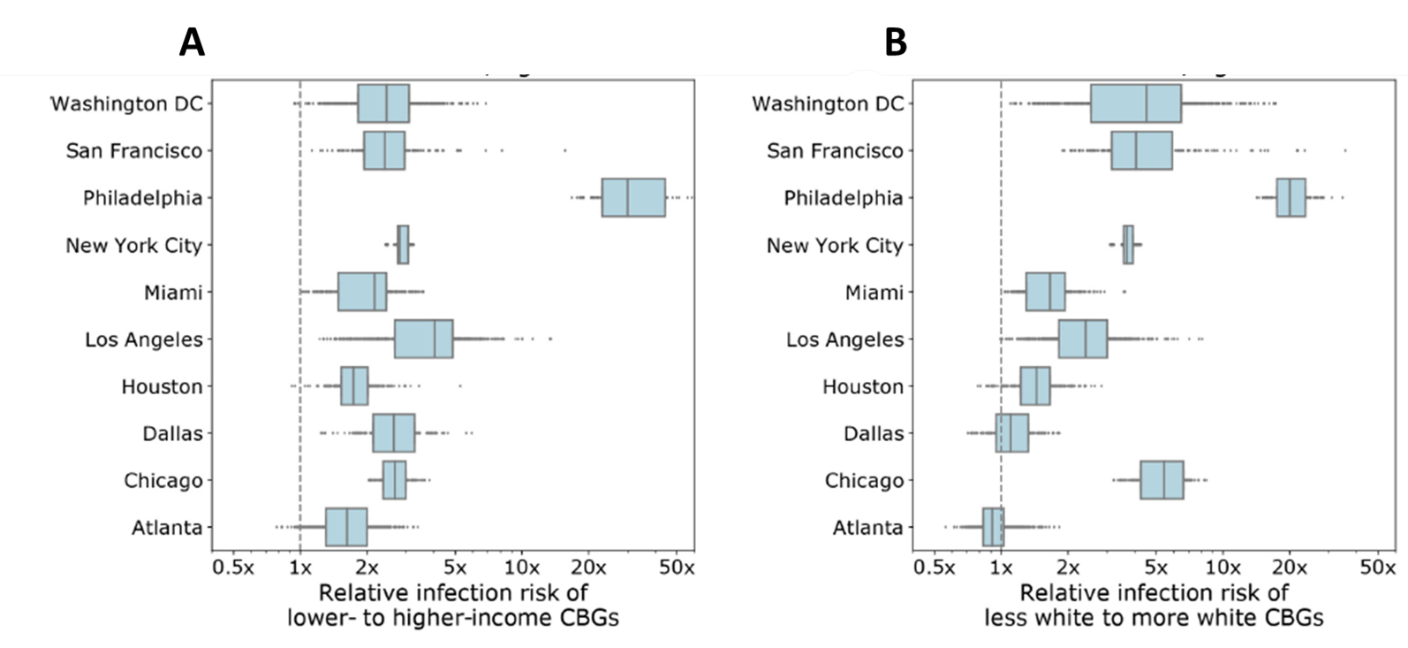
- Individuals from CBGs in the bottom decile for income and from CBGs with fewer White residents were substantially more likely to have been infected by the end of the simulation (Figure 1).
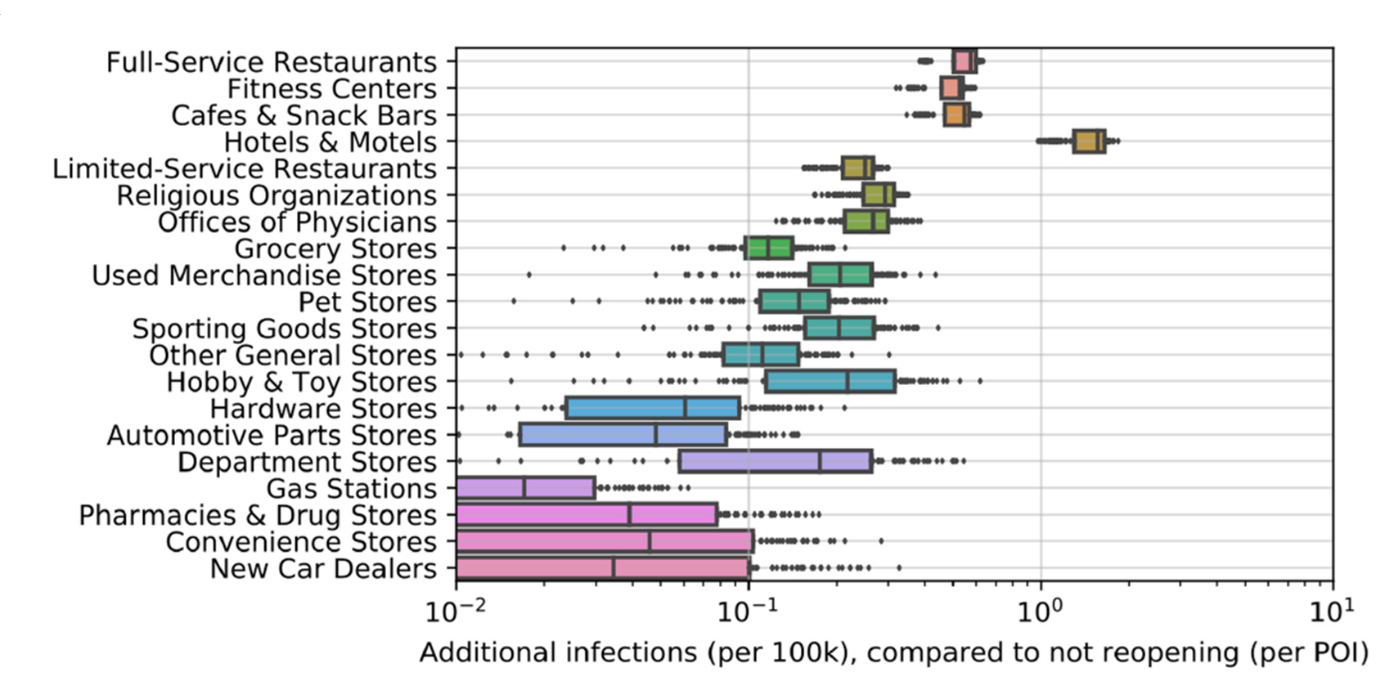
- Full-service restaurants were associated with the greatest increase in infections in re-opening scenarios (Figure 2).
Methods: Mobility patterns for 98 million people collected from anonymized cell phone location data in 10 US metropolitan areas from March 1 to May 2, 2020 were used to create a model to estimate the spread of SARS-CoV-2. Authors combined mobility data with case counts to estimate infection rates with no closing, infection rates in CBGs by socioeconomic status and racial/ethnic composition and impacts of specific reopening scenarios. Limitations: Mobility data do not contain all populations (e.g., those without cellphones or traveling without cellphones) or POIs.
Implications: Results may guide choices in re-opening strategies for non-residential establishments and incorporate policy approaches to mitigating racial and socioeconomic disparities while re-opening.
Figure 1
Note: Adapted from Chang et al. Model simulations for predicted disparities in estimated infections for socioeconomic status (A) and racial/ethnic composition (B). Shaded areas represent interquartile ranges (IQR); dots outside IQRs represent individual data points in model simulations. Reprinted by permission from Springer Nature Customer Service Centre GmbH: Springer [NATURE] Mobility network models of COVID-19 explain inequities and inform reopening, Chang et al. COPYRIGHT 2020.
Figure 2
Note: Adapted from Chang et al. Predicted increases in infections based on modeling estimates of reopening scenarios for different POIs, aggregate estimates for all 10 metro areas. Boxes denote the IQR; dots show data points outside the IQR. Reprinted by permission from Springer Nature Customer Service Centre GmbH: Springer [NATURE] Mobility network models of COVID-19 explain inequities and inform reopening, Chang et al. COPYRIGHT 2020.
Scientific manuscripts related to COVID-19 are being published at unprecedented rates. The following summaries evaluate the quality of the COVID-19 publications from pre-print servers and peer-reviewed journals.
PEER-REVIEWED
A. Scientific quality of COVID-19 and SARS CoV-2 publications in the highest impact medical journals during the early phase of the pandemic: a case control studyexternal icon. Zdravkovic et al. PLOS One. (November 5, 2020).
Key findings:
- Non-COVID-19 publications were associated with higher quality compared to COVID-19 publications based on higher scores on the Oxford Center Levels of Evidence pyramid (p <0.001).
- Out of a maximum score of 28, the mean total score for the COVID-19 publications was 6 (95% CI 10.1–15.1) compared with 23.7 (95% CI 22.9–24.6) for the non-COVID-19 publications (p <0.001).
- Non-COVID-19 publications had a greater median number of citations by other articles compared with COVID-19 publications (83.5 vs 2.5; p <0.001).
Methods: Comparative analysis of 155 COVID-19 publications and 130 non-COVID-19 publications from the three highest ranked scientific medical journals (NEJM, Lancet, JAMA) published from March 12 to April 12, 2020. Studies were scored by level of evidence based on the Oxford Centre for Evidence-Based Medicine: Levels of Evidenceexternal icon criteria of methodological quality, quantitative analysis of strengths and weaknesses, and citation rate. Limitations: Used articles published very early in COVID pandemic and therefore not enough time for publication of studies with rigorous study designs; few original articles.
B. Effect and reach of medical articles posted on preprint servers during the COVID-19 pandemic.external icon Jung et al. JAMA Internal Medicine (November 9, 2020).
Key findings:
- There were significantly more citations of COVID-19 published articles (median 22, interquartile range [IQR] 4.3-52.5) compared with COVID-19 preprints (5.5, IQR 1.3-20.3).
- There were no significant differences for other attention and online engagement metrics.
- The journals in which COVID-19 articles were published had similar impact factors whether the article was posted as preprints prior to publication (12.3, 95% CI 6.2-18.4) or not posted as preprints (13.8, 95% CI 7.6-20.0; p = 0.20).
- Articles posted as preprints that were not subsequently published received less attention and online engagement metrics at the time of posting than those that were later published.
Methods: Study comparing the effect and reach of preprints and peer-reviewed publications of studies that presented clinical outcomes of proposed COVID-19 treatments posted at medrxiv.org or published between February 1 and May 10, 2020, as well as the subsequent peer-reviewed publications from these articles between February 1 and July 10, 2020. Data on attention and online engagement for each article was collected. Limitations: Small number of reports and short duration of analysis; attention and online engagement metrics are inexact.
Implications for both studies (Zdravkovic et al. & Jung et al.): COVID-19 studies published early in the pandemic, including those from highly ranked scientific journals, were of lower quality than non-COVID-19 studies, likely due to the demand for information and limited availability of findings from rigorous scientific studies. Researchers publishing critical evidence related to COVID-19 as preprints should subsequently publish their findings in a peer-reviewed journal to ensure widespread reach and impact.
Clinical Management and Treatment
- Lenze et al. Fluvoxamine vs. placebo and clinical deterioration in outpatients with symptomatic COVID-19: A randomized clinical trial.external icon JAMA. COVID-19 patients who received fluvoxamine showed less clinical deterioration compared with those who received placebo (absolute difference, 8.7% [95% CI, 1.8%-16.4%], p = 0.009).
- Butler et al. US clinicians’ experiences and perspectives on resource limitation and patient care during the COVID-19 pandemicexternal icon. JAMA Network Open. Qualitative study highlights the complexity of providing high-quality care for patients during the COVID-19 pandemic.
Vaccines
- O’Leary et al. Update from the Advisory Committee on Immunization Practicesexternal icon. Journal of Pediatric Infectious Diseases Society. Provides summaries of the August 26 and September 22, 2020, meetings on COVID-19 vaccines of the Advisory Committee on Immunization Practices.
- Poland et al. SARS-CoV-2 immunity: Review and applications to phase 3 vaccine candidatesexternal icon. Lancet. Summarizes current knowledge on immune responses against the spike protein and T cell epitopes and how this has used to guide vaccine development.
- Asgary et al. A drive-through simulation tool for mass vaccination during COVID-19 pandemicexternal icon. Healthcare. Introduces a drive-through vaccination simulation tool that estimates average processing and waiting times and the number of cars and people that can be served under different numbers of staff, service lanes, screening, registration, immunization, and recovery times.
Transmission
- Nissen et al. Long-distance airborne dispersal of SARS-CoV-2 in COVID-19 wards.external icon Scientific Reports. SARS-CoV-2 was detected via RT-PCR (but negative culture) in ventilation units a far distance from COVID-19 wards in a hospital.
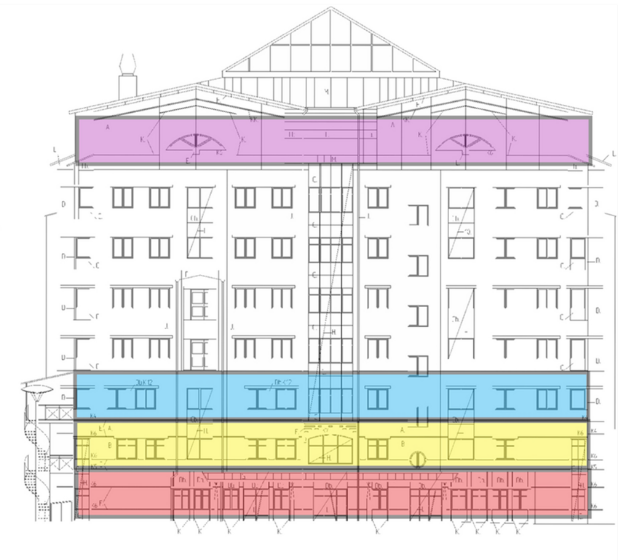
Note: Adapted from Nissen et al. Hospital with COVID-19 outpatient unit, COVID-19 unit 1, COVID-19 unit 2, and the top floor ventilation system where SARS-CoV-2 RT-PCR-positive swabs were found. Licensed under CC-BY.
- Neidlinger et al. Organ Recovery from Deceased Donors with Prior COVID-19: A Case Series.external icon Transplant Infectious Disease. Despite a history of SARS-CoV-2 infection in 6 deceased donors, no transmission to 13 organ recipients was seen.
- Dai et al. Long-term survival of SARS-CoV-2 on salmon as a source for international transmissionexternal icon. Journal of Infectious Diseases. Laboratory experiment demonstrating that viable SARS-CoV-2 can be recovered from salmon up to 10 days at 0-4°C storage — the temperature at which fish is shipped — or 3 days at 25°C storage.
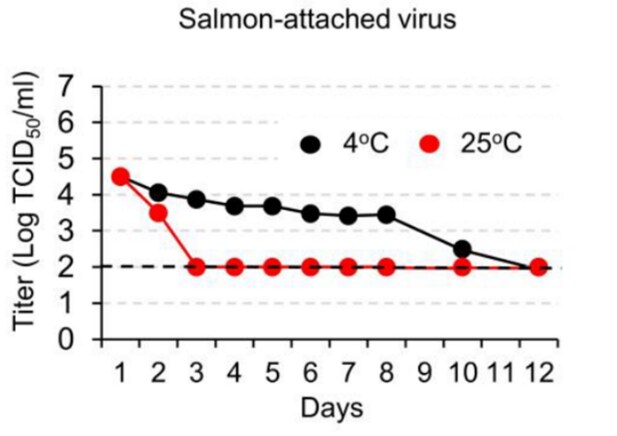
Note: Adapted from Dai et al. The titer of tissue culture infectious dose (TCID50) of SARS-CoV-2 recovered from virus-treated salmon stored for various lengths of time at 4°C or 25°C. Reproduced by permission of Oxford University Press on behalf of the Infectious Diseases Society of America. Please visit: https://academic.oup.com/jid/advance-article/doi/10.1093/infdis/jiaa712/5974973.
Injury
- Gielen et al. National survey of home injuries during the time of COVID-19: Who is at risk? external iconInjury Epidemiology. There was no association between increased time spent at home and the report of injuries and/or ingestions among a survey of 2,011 U.S. adults June 17-29, 2020.
- Abdallah et al. Increased firearm injury during the COVID-19 pandemic: A hidden urban burdenexternal icon. Journal of the American College of Surgeons. Reporting from an urban trauma center showed decreased unintentional injuries and increased intentional injuries following stay-at-home orders (SAHO).
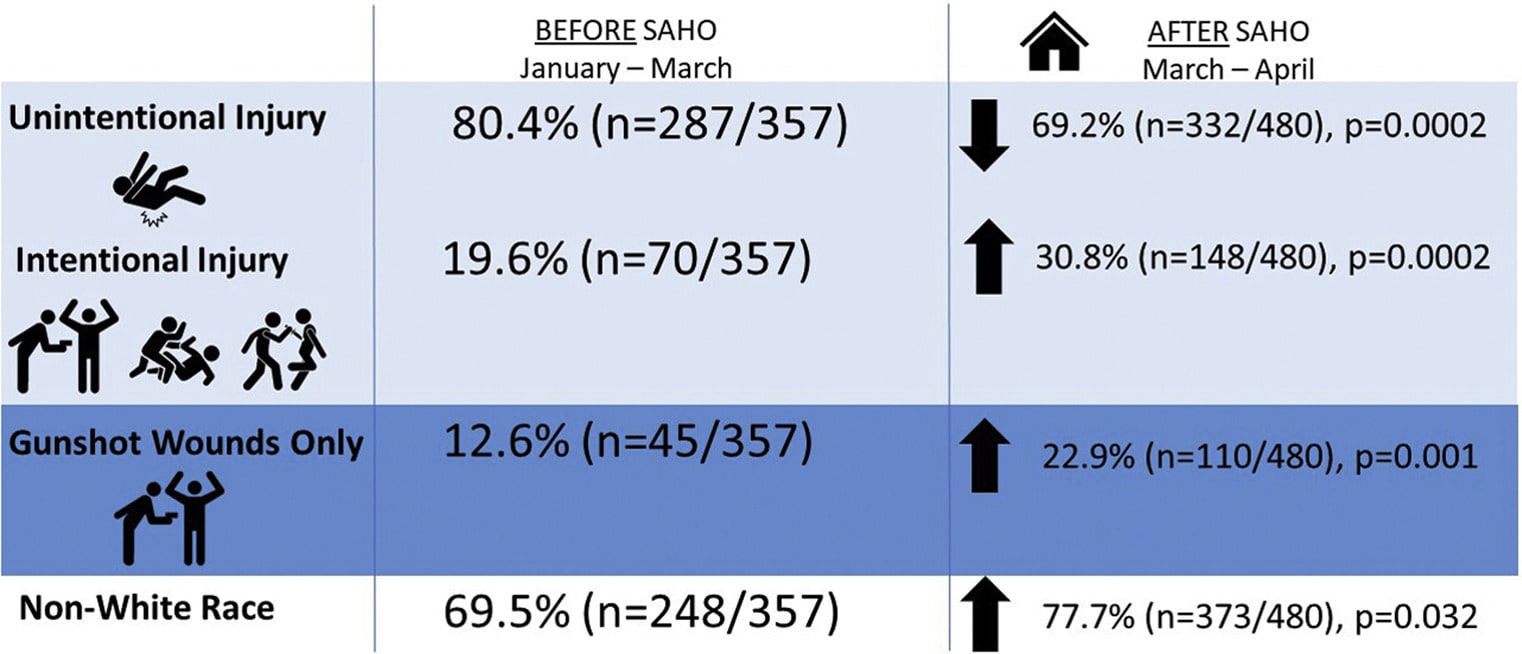
Note: Adapted from Abdallah et al. Rate of injury before and after SAHO. Copyright 2020, with permission from American College of Surgeons.
Disclaimer: The purpose of the CDC COVID-19 Science Update is to share public health articles with public health agencies and departments for informational and educational purposes. Materials listed in this Science Update are selected to provide awareness of relevant public health literature. A material’s inclusion and the material itself provided here in full or in part, does not necessarily represent the views of the U.S. Department of Health and Human Services or the CDC, nor does it necessarily imply endorsement of methods or findings. While much of the COVID-19 literature is open access or otherwise freely available, it is the responsibility of the third-party user to determine whether any intellectual property rights govern the use of materials in this Science Update prior to use or distribution. Findings are based on research available at the time of this publication and may be subject to change.

