COVID-19 Science Update released: September 25, 2020 Edition 51

The COVID-19 Science Update summarizes new and emerging scientific data for public health professionals to meet the challenges of this fast-moving pandemic. Weekly, staff from the CDC COVID-19 Response and the CDC Library systematically review literature in the WHO COVID-19 databaseexternal icon, and select publications and preprints for public health priority topics in the CDC Science Agenda for COVID-19 and CDC COVID-19 Response Health Equity Strategy.
Here you can find all previous COVID-19 Science Updates.
PEER-REVIEWED
Association of daily wear of eyeglasses with susceptibility to coronavirus disease 2019 infectionexternal icon. Zeng et al. JAMA Ophthalmology (September 16, 2020).
Key findings:
- A review of 276 COVID-19 patients found 16 (5.8%; 95% CI, 3.04% – 8.55%) wore glasses.
- The prevalence of SARS-CoV-2 infection for people who wear glasses (5.8%) was lower than the population prevalence described in a previous study (31.5%).
- Underlying diseases as well as COVID-19 symptoms and severity were not significantly different between patients who did and did not wear eyeglasses.
Methods: Cross-sectional evaluation of 276 hospitalized patients with SARS-CoV-2 infection in Suizhou, China between January 27 and March 13, 2020. The proportion of hospitalized persons who wore eyeglasses for more than 8 hours a day (wearing glasses for an extended period) were compared with the regional proportion of people with myopia from a 1985 study of 7 to 22-year-old students who by 2020 comprised an age-matched comparison cohort. Limitations: Single center study with small sample size; comparison to previous study of youth rather than a contemporary age-matched comparison group.
Implications: Whether SARS-CoV-2 is transmitted through the ocular route and what protective measures are needed remain a source of debate. This study suggests eyeglasses may provide some protection, however, as noted in an accompanying editorialexternal icon, caution is needed as association may not imply causation, and additional data are needed to confirm this finding.
Case-control study of use of personal protective measures and risk for severe acute respiratory syndrome coronavirus 2 infection, Thailand. Doung-ngern et al. Emerging Infectious Diseases (September 14, 2020).
Key findings:
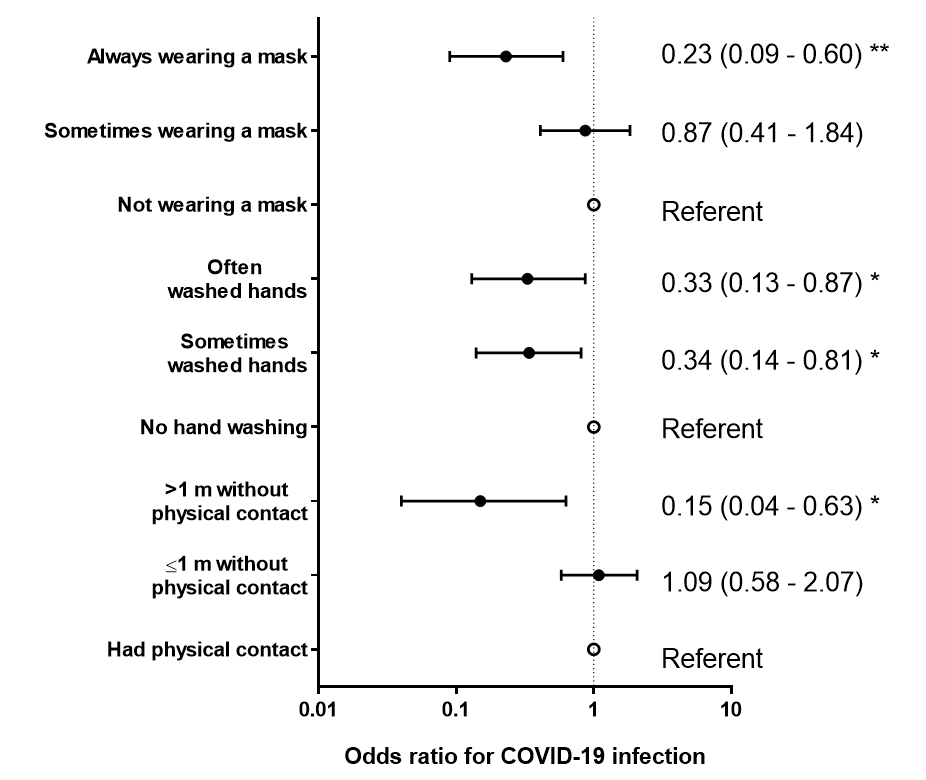
- Among 1,050 persons in three clusters, 211 (20.1%) tested positive for SARS-CoV-2 and were classified as cases, while 839 (79.9%) never tested positive and were classified as controls (Figure).
- Multivariate analysis showed low odds ratios for developing COVID-19 among those who maintained ≥1m distance from a contact (adjusted OR 0.15, 95% CI 0.04 –63) and who frequently washed their hands (aOR 0.33, 95% CI 0.13 – 0.87) (Figure).
- Always wearing a mask was more protective than sometimes wearing a mask (aOR 0.23, 95% CI 0.09 –60 vs aOR 0.78, 95% CI 0.41 – 1.84, respectively).
Methods: A retrospective case-control study of 1,050 asymptomatic people in 3 large COVID-19 clusters in Thailand between March and April 2020. People who had contact with COVID-19 index patients were questioned on mask wearing, social distancing, and hand hygiene. Limitations: Analysis from three settings might not be generalizable; estimated odds ratios were based on reported contact with the primary index case and did not evaluate the probability of having contact with other infected individuals; only 89% of defined controls were tested and the remainder could have been positive and confounded results.
Implications: This analysis supports recommendations for consistent and correct mask-wearing, proper social distancing and hand washing to lower risk of SARS-CoV-2 infection.
Figure:
Note: Adapted from Doung-ngern et al. Adjusted odds ratios for factors associated with SARS-CoV-2 infection among persons identified through contact tracing in Thailand, March – April 2020. ** p-value <0.01, * p-value<0.05. Open access journal; all content freely available.
Epidemiological and clinical findings of short-term recurrence of SARS-CoV-2 RNA PCR positivity in 1282 discharged COVID-19 cases: A multi-center, retrospective, observational studyexternal icon. Chen et al. Open Forum Infectious Diseases (September 13, 2020).
Key findings:
- 189 (14.7%) discharged patients re-tested positive for SARS-CoV-2 RNA.
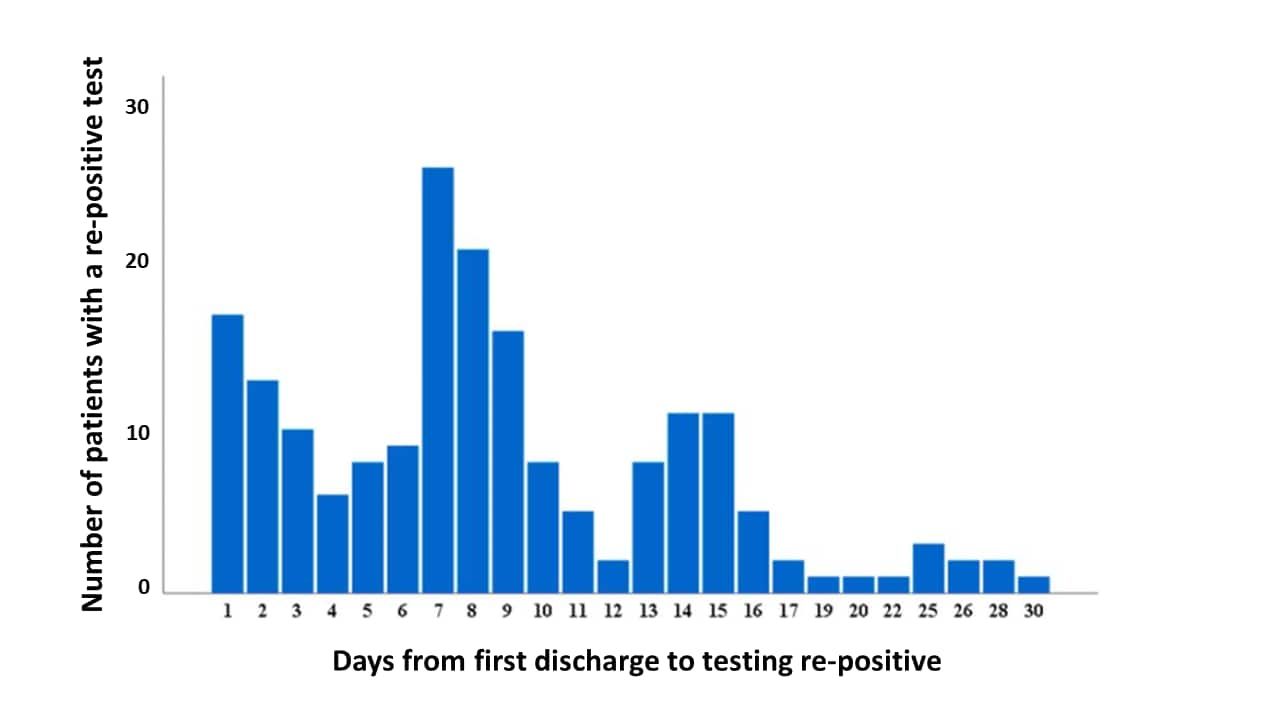
- 90.5% tested re-positive within 15 days of discharge (Figure 1).
- Compared with patients who did not test re-positive, re-positive patients were more likely to be <40 years (63.5% vs 40.4%), had more moderate symptoms initially (95.8% vs 84.4%, p <0.001), were less likely to report comorbidities (11.1% vs 22.7%, p <0.001), and had shorter median length of primary hospitalization (17 days vs 19 days, p = 0.013).
- Most patients (80.4%) were readmitted only because of a positive test and had no symptoms.
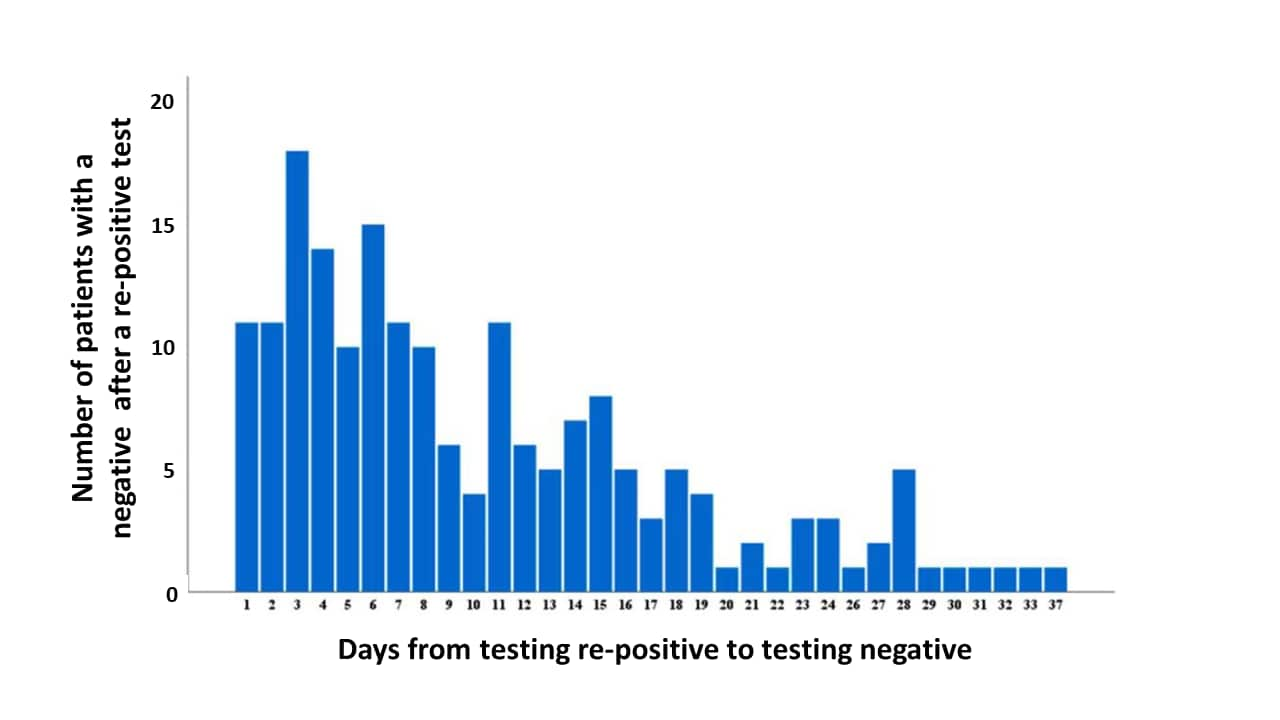
- 87.8% of re-positive patients had a negative test following the re-positive test within 20 days of hospital readmission (median 8 days) (Figure 2).
- No close contacts of re-positive patients developed symptoms and all tested negative for SARS-CoV-2.
Methods: Retrospective observational study of 1,282 COVID-19 patients discharged from 32 hospitals in China between January 14 and March 10, 2020 and followed for 28 days. All COVID-19 patients were discharged after 2 consecutive negative RT-PCR tests and thereafter tested at least weekly and reported symptoms daily, per provincial policy. Limitations: Viral genotyping was not conducted; the small number of close contacts may not be enough to look at risk of transmission from re-positive patients.
Implications: This study suggests that short-term recurrence of detectable SARS-CoV-2 RNA in discharged patients is not a relapse of COVID-19 and risk of ongoing transmission was not demonstrated.
Figure 1
Note: Adapted from Chen et al. Number of patients with a re-positive test for SARS-CoV-2 by the number of days after hospital discharge (n = 189). Licensed under CC BY-NC-ND.
Figure 2
Note: Adapted from Chen et al. Number of patients who had a negative test after a re-positive test in days (n = 188). Licensed under CC BY-NC-ND.
PEER-REVIEWED
Projected health-care resource needs for an effective response to COVID-19 in 73 low-income and middle-income countries: A modelling study.external icon Tan-Torres Edejer et al. Lancet Global Health (September 9, 2020).
Key findings:
- In a modelling exercise, investigators found the main cost drivers for an effective COVID-19 response were case management (52%), maintaining essential services (21%), rapid response and case investigation (14%), and infection prevention and control (9%).
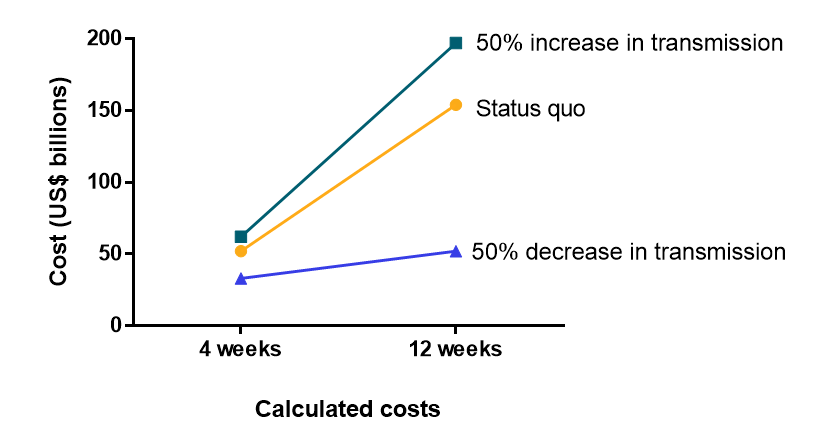
- Total healthcare cost estimates at baseline for 4 weeks was $52 billion (US$) for the status quo scenario, $33 billion for 50% decrease in transmission scenario, and $62 billion for the 50% increase in transmission scenario (Figure).
- At 12 weeks, under the 50% reduction in transmission scenario, costs were projected to be equivalent to the 4-week status quo scenario costs.
- Under the status quo or increasing transmission scenarios, costs were projected to triple the 4-week costs (Figure).
Methods: Cost analysis model of COVID-19 strategic preparedness and response costs in 73 low and middle-income countries at two time periods: baseline for 4 weeks (June, 2020 to July, 2020) and 12 weeks (July, 2020 to September, 2020) under 3 scenarios regarding transmission (status quo, 50% increase, 50% decrease). Costs included costs for laboratories and health facilities, personal protective equipment, diagnostic supplies, pharmaceuticals, and labor costs. Limitations: Only costs borne by healthcare sector were included; costs for quarantine and isolation for mild to moderate COVID-19 cases not included; sensitivity analyses were limited to 50% changes in transmission.
Implications: COVID-19 response costs quickly escalate if public health measures are relaxed and transmission increases. Public health measures to reduce transmission can reduce these future costs to sustain the response. Costs for case management services were the biggest drivers of COVID-19 response costs in low- and middle-income countries.
Figure:
Note: Adapted from Tan-Torres Edejer et al. Calculated cost estimates for a COVID-19 response in billions of US dollars for low- and middle-income countries. Costs were estimated for three scenarios: status quo, +50% transmission, and -50% transmission at 4 and 12 weeks. Licensed under CC-BY-NC-ND.
Early in the pandemic diabetes was recognized as a risk for poor COVID-19 outcomes. Below we present two studies that describe COVID-19-related mortality rates stratified by type of diabetes in England.
PEER-REVIEWED
A. Associations of type 1 and type 2 diabetes with COVID-19 related mortality in England: A whole-population study.external icon Barron et al. Lancet Diabetes & Endocrinology (August 13, 2020).
Key findings:
- Persons with diabetes comprise 5.2% of the population in England but comprised 33.6% (7,867/23,698) of all COVID-19 deaths.
- Both type 1 and type 2 diabetes were independently associated with increased odds of COVID-19 death after adjusting for age, sex, ethnicity, socioeconomic status, and region: type 1 diabetes adjusted OR 3.51 (95% CI 3.16 – 3.90), type 2 diabetes aOR 2.03 (95% CI 1.97 – 2.09).
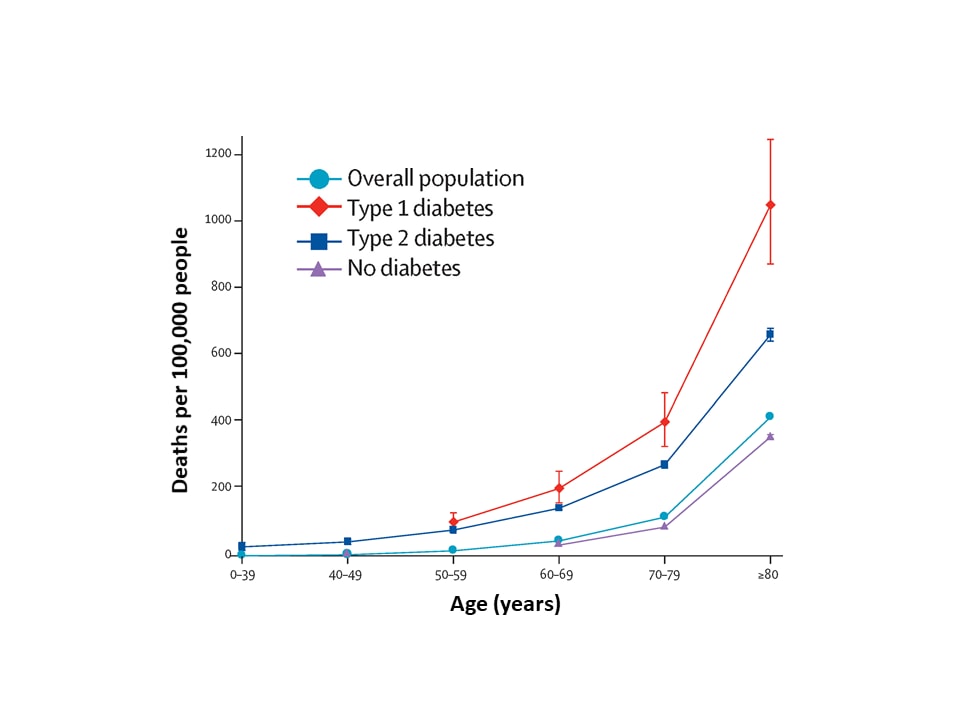
- There was a strong association between death and age; this effect was more pronounced among those with type 1 diabetes compared with type 2 diabetes (Figure).
Methods: Whole-population study looking at risk of COVID-19-related in-hospital death associated with diabetes status in the England from March 1 to May 11, 2020 in all individuals registered with a general practice. Limitations: Because the outcome was in-hospital death, the association of diabetes with COVID-19 mortality was likely underestimated.
Figure:
Note: Adapted from Barron et al. Unadjusted in-hospital COVID-19 mortality rates, March 1 to May 11, 2020, for the Overall population, Type 1 diabetes, Type 2 diabetes, and No diabetes. Whisker bars show 95% CIs. Data for age groups 0 – 39 years and 40 – 49 years for type 1 diabetes and 0 – 39 years and 50 – 59 years for no diabetes were excluded because of small numbers of events (one to four), to comply with data protection regulations. This article was published in Lancet Diabetes & Endocrinology, Vol 8, Barron et al., Associations of type 1 and type 2 diabetes with COVID-19 related mortality in England: A whole-population study., Page Nos, Copyright Elsevier 2020. This article is currently available at the Elsevier COVID-19 resource center: https://www.elsevier.com/connect/coronavirus-information-centerexternal icon.
B. Risk factors for COVID-19-related mortality in people with type 1 and type 2 diabetes in England: A population-based cohort studyexternal icon. Holman et al. Lancet Diabetes & Endocrinology (August 13, 2020).
Key findings:
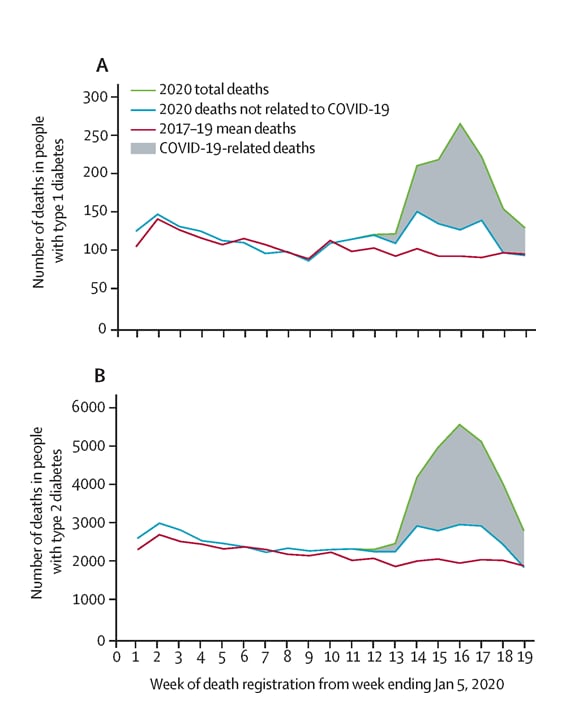
- During early 2020, the number of deaths among persons with type 1 and type 2 diabetes increased by 50.9% and 64.3% respectively, compared with the mean number of deaths during the previous three years for that period (Figure 1).
- There were 464 (69%) additional deaths in persons with type 1 diabetes and 10,525 (65.5%) additional deaths in persons with type 2 diabetes listed as COVID-19-related.
- Factors identified that increased risk for mortality included BMI, renal function, and blood sugar control.
Methods: Population-based cohort study and survival analysis among people with diabetes registered in 6,774 general practices, from January 2, 2017, to May 11, 2020. The weekly number of deaths among persons with diabetes was calculated for the first 19 weeks of 2020 and compared to the same time period in 2017, 2018, and 2019. During the 2020 study period, potential risk factors for COVID-19-related deaths were examined. Limitations: Possible under-recognition of COVID-19-related mortality; cohort in this study may be part of Barron et al. studyexternal icon, summarized above.
Figure 1
Note: From Holman et al. Weekly numbers of deaths registered from week 1 to week 19 in people with type 1 (A) and type 2 (B) diabetes in England, mean deaths from 2017–19 and 2020. Deaths in 2020 are stratified into deaths not related to COVID-19 and total deaths. Note different scale on y axes for the 2 graphs. This article was published in Lancet Diabetes & Endocrinology, Vol 8, Holman et al., Risk factors for COVID-19-related mortality in people with type 1 and type 2 diabetes in England: A population-based cohort study, Page 823-833, Copyright Elsevier 2020. This article is currently available at the Elsevier COVID-19 resource center: https://www.elsevier.com/connect/coronavirus-information-centerexternal icon.
Implications for 2 studies (Barron et al. & Holman et al.): During the COVID-19 pandemic, diabetes has been associated with increased risk for death with mortality largely attributable to COVID-19. However, rates of non-COVID-19 mortality for diabetics have also increased, possibly due to avoidance of care, other demographic and social factors in diabetic patients or under-recognition of contribution of COVID-19 as a cause of death. As discussed in COVID-19 and diabetes: a co-conspiracyexternal icon, poor blood sugar control impairs host immunity and has been associated with infections in general and worse outcomes with COVID-19. Supporting people with diabetes in effective self-management during the pandemic is an important measure to aid in mitigating the effects of SARS-CoV-2 infection.
PEER-REVIEWED
Pediatric lung imaging features of COVID‐19: A systematic review and meta‐analysis. external iconNino et al. Pediatric Pulmonology (September 14, 2020).
Key findings:
- 35.7% of pediatric COVID-19 patients had normal chest CT scans.
- Most common chest CT findings in pediatric COVID-19 patients were ground-glass opacities 37.2%, (95% CI 29.3% – 45%), pneumonic infiltrates or consolidations 22.3%, (95% CI 17.8% –9%), and bilateral involvement 27.7% (95% CI 19.9% – 35.6%) (Table).
- Typical lung imaging features of viral infections in the pediatric population, such as perihilar markings and hyperinflation, were not present in pediatric COVID-19 patients.
Methods: A meta-analysis of 29 studies including 1,026 children 0-18 years with RT-PCR-confirmed SARS-CoV-2 to obtain the pooled chest CT scan features. Limitations: Variation in CT reporting practices could have influenced results; only one database was included in the systematic search limiting the inclusion of international studies; a risk-of-bias assessment was not done; authors did not describe methods for data transformation or synthesis.
Implications: CT scan abnormalities in the pediatric COVID-19 population are distinct from typical lung images of viral respiratory infections. When compared with adults, children with COVID-19 had greater variability in CT findings and more commonly had normal chest CT scans.
Table:
Note: Adapted from Nino et al. Comparison between most common pediatric and adult CT findings. Used by permission of publisher via the Copyright Clearance Center. © 2020 Wiley Periodicals LLC.
Convalescent plasma treatment of severe COVID-19: A propensity score–matched control study.external icon Liu et al. Nature Medicine (September 15, 2020).
Key findings:
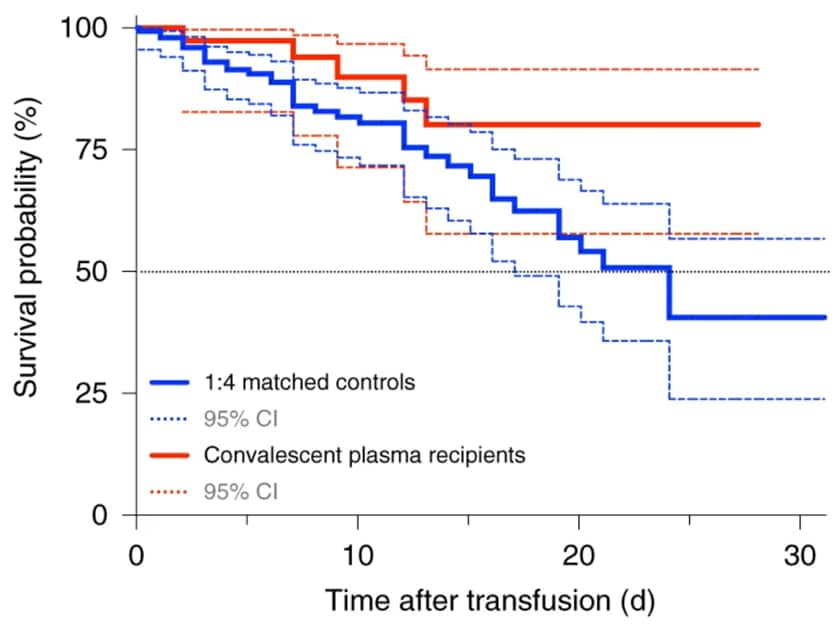
- Fewer patients who received convalescent plasma (CP) died (5/39, 12.8%) than matched controls (38/156, 24.4%).
- CP was associated with improved survival in patients who were not intubated (HR 0.23; 95% CI 0.05 –98, p = 0.046), had symptoms for less than 1 week (HR 0.33; 95% CI 0.11 – 0.93, p = 0.035), or received anticoagulation (HR 0.28; 95% CI 0.10 – 0.80, p = 0.018).
- Patients who were intubated showed no improved survival (HR 0.79; 95% CI 0.22 –79, p = 0.716).
- Survival rates improved in CP recipients compared with the control patients (HR 0.34; 95% CI 0.13 – 0.89, p = 0.027).
Methods: Retrospective case-control study analyzing the effectiveness of CP treatment in patients hospitalized at Mount Sinai Hospital with severe COVID-19 between March 24 and April 8, 2020. Propensity-score matched analysis was performed on data from baseline, up to the day of CP transfusion and from the day of CP transfusion forward while in care. Limitations: Cannot exclude the possibility that CP recipients benefitted from more assertive clinical management.
Implications: Results from nonrandomized case series such as this one suggest a benefit of CP in selected patients; high quality data from randomized controlled trials are needed to confirm these findings.
Figure:
Note: Modified from Liu et al. Survival probability of patients receiving CP transfusion vs control arm. Solid lines represent the survival curve, dashed lines represent 95% CI. Reprinted by permission from Springer Nature Customer Service Centre GmbH: Springer Nature, Nature Medicine. Liu et al. Convalescent plasma treatment of severe COVID-19: a propensity score–matched control study. https://doi.org/10.1038/s41591-020-1088-9, COPYRIGHT 2020.
PEER-REVIEWED
Detection and infectivity potential of severe acute respiratory syndrome coronavirus 2 (SARS-CoV-2) environmental contamination in isolation units and quarantine facilitiesexternal icon. Ben-Shmuel et al. Clinical Microbiology and Infection (September 9, 2020).
Key findings:
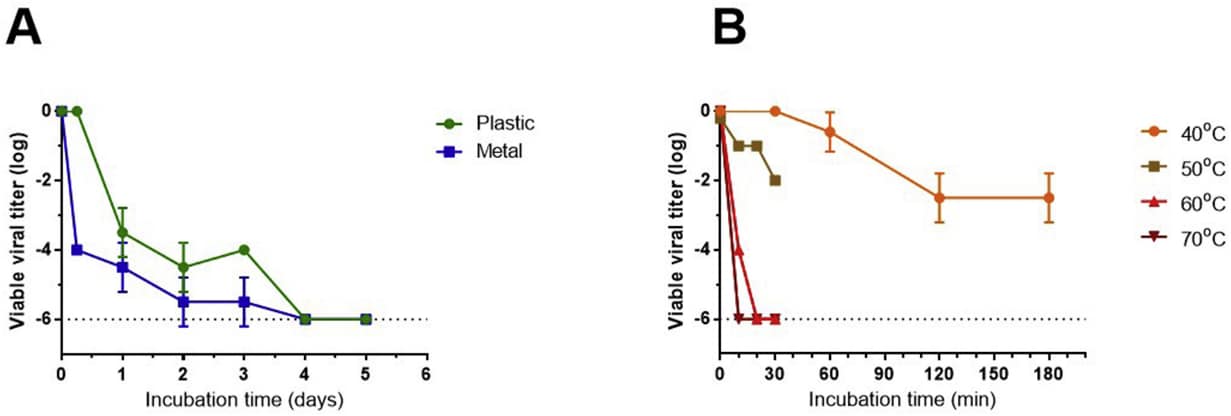
- At room temperature, SARS-CoV-2 lost infectivity on inoculated non-porous surfaces by day 4, and the rate of viral decay increased at higher temperatures (Figure).
- Viral RNA was detected in 46% (45/97) of environmental surface and air samples from three facilities housing COVID-19 patients; none of the samples contained infectious SARS-CoV-2.
Methods: Plastic and metal surfaces were inoculated with virus and infectivity was assessed at varying times and temperatures. Air and surface samples were collected from two hospital COVID-19 isolation wards and one hotel quarantine facility in Israel. RT-PCR identified viral RNA, and Vero E6 cytopathic assay assessed infectivity. Limitations: When rooms were being sampled, some patients may not have been shedding viable virus; very low levels of viable virus may not have been detected; remnants of surface cleaning materials and disinfectants may have inactivated virus; small sample size.
Implications: The lack of infectious SARS-CoV-2 detected from environmental samples in healthcare facilities suggests environmental contamination plays a minor role in the spread of infection in this setting. Staff should prioritize strengthening prevention measures interrupting direct person-to-person and droplet transmission.
Figure:
Note: From Ben-Shmuel et al. A: Reduction in SARS-CoV-2 titers over time (days) at 22°C (room temperature) following inoculation on plastic and metal. B: Reduction in SARS-CoV-2 titers over time (minutes) at (40°C, 50°C, 60°C, 70°C) following inoculation on plastic. Licensed under CC-BY-NC-ND.
- Marshall M. The lasting misery of coronavirus long-haulers.external icon Describes the long-term effects of COVID-19 and the researchers trying to identify symptoms and prevalence.
- Chang et al. Host tolerance contributes to persistent viral shedding in COVID-19.external icon Brief report describing characteristics of three patients with persistent viral shedding for at least 50 days.
- Guglielmi G. ‘We didn’t model that people would go to a party if they tested positive’.external icon The University of Illinois spent months preparing for students to return. Their ability to test up to 10,000 students per day drew praise in national press. There was still a spike as students with positive tests failed to isolate.
- Cahan E. Ethical or exploitative — Should prisoners participate in COVID-19 vaccine trials?external icon Science News. Incarcerated populations are typically excluded from clinical trials over ethical concerns. A bioethicist and sociologist/epidemiologist discuss the benefits and risks of enrolling incarcerated persons in COVID-19 vaccine trials.
- Callaway E. The coronavirus is mutating — Does it matter?external icon News feature that discusses the rate and role of mutations in SARS-CoV-2 and how mutations could impact future vaccines.
- Raahman et al. Neurological manifestations in COVID-19: A narrative review.external icon Sage Open Medicine. A review of reported neurological manifestations of COVID-19, possible mechanisms and treatment strategies.
Disclaimer: The purpose of the CDC COVID-19 Science Update is to share public health articles with public health agencies and departments for informational and educational purposes. Materials listed in this Science Update are selected to provide awareness of relevant public health literature. A material’s inclusion and the material itself provided here in full or in part, does not necessarily represent the views of the U.S. Department of Health and Human Services or the CDC, nor does it necessarily imply endorsement of methods or findings. While much of the COVID-19 literature is open access or otherwise freely available, it is the responsibility of the third-party user to determine whether any intellectual property rights govern the use of materials in this Science Update prior to use or distribution. Findings are based on research available at the time of this publication and may be subject to change.

