COVID-19 Science Update released: September 8, 2020 Edition 46

The COVID-19 Science Update summarizes new and emerging scientific data for public health professionals to meet the challenges of this fast-moving pandemic. Weekly, staff from the CDC COVID-19 Response and the CDC Library systematically review literature in the WHO COVID-19 databaseexternal icon, and select publications and preprints for public health priority topics in the CDC Science Agenda for COVID-19 and CDC COVID-19 Response Health Equity Strategy.
Here you can find all previous COVID-19 Science Updates.
Some patients with COVID-19 have gastrointestinal symptoms including diarrhea, vomiting, and abdominal pain, and SARS-CoV-2 has been found in patients’ stool. Below we summarize a systematic review and an epidemiologic and environmental investigation exploring the possibility of transmission from fecal sources.
PEER-REVIEWED
A. Systematic review with meta‐analysis: SARS‐CoV‐2 stool testing and the potential for faecal‐oral transmissionexternal icon. van Doorn et al. Alimentary Pharmacology and Therapeutics (August 27, 2020).
Key findings:
- Across 91 studies, a weighted pooled 51.8% (95% CI 43.8%-59.7%) of stool samples or anal swabs from COVID-19 patients were positive for SARS-CoV-2.
- Across 42 studies reporting duration of SARS-CoV-2 in gastrointestinal specimens, patients tested positive for a mean of 25.0 (range 3-70) days after symptom onset.
- The presence of replication-competent SARS-CoV-2 was investigated in 5 studies and found to be present in 6/17 (35%) patients.
Methods: Systematic literature search identifying studies published in English, Dutch, or German from December 2019 to July 7, 2020, of COVID-19 patients who had stool samples or anal swabs tested for SARS-CoV-2 by RT-PCR. Viability was assessed by isolating live SARS CoV-2 in cultured specimens. A weighted pooled estimate of the proportion testing positive was calculated for studies with at least 10 patients. Limitations: Significant heterogeneity in included studies; few studies investigated viability of virus in fecal samples.
B. Probable evidence of fecal aerosol transmission of SARS-CoV-2 in a high-rise buildingexternal icon. Kang et al. Annals of Internal Medicine (September 1, 2020).
Key findings:
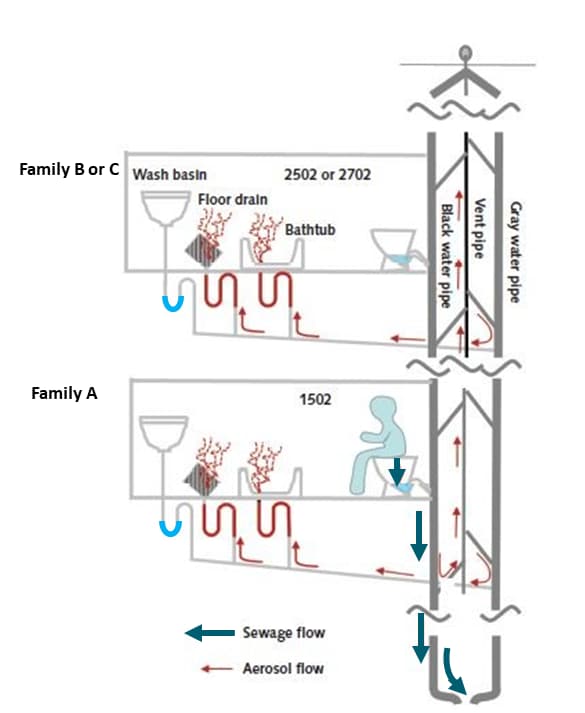
- All 9 members of 3 families (A, B, and C) living in vertically aligned apartments connected by master bathroom drainage pipes were diagnosed with COVID-19 between January 26 and February 13, 2020 (Figure).
- Family A had traveled to Wuhan; families B and C had no travel history and later symptom onset.
- The families did not have direct contact with each other, including in common elevators.
- All other 193 residents and 24 staff in the same building tested negative for SARS CoV-2.
- Environmental samples from family A’s bathroom and bedroom (n = 5), and from the bathroom in the unoccupied apartment one floor above (n = 1) were positive for SARS-CoV-2.
- Samples from other building areas including the apartments where families B and C lived were negative.
- Tracer gas released in family A’s bathroom was detected in vertically aligned bathrooms.
- Families B and C reported not using their bathtubs, suggesting dried out U-trap water seals.
Methods: Contact tracing and throat swabs for SARS-CoV-2 by RT-PCR for all other 193 residents and 24 staff in the building, 237 surface and air samples from 11 apartments and common areas were tested for SARS-CoV-2 by RT-PCR, common elevator use assessed by closed-circuit television review, and tracer gas released into bathrooms to simulate virus-laden aerosols. Limitations: Disinfection in family B’s and family C’s apartments prior to sampling prevented assessment for SARS-CoV-2; sequencing was not performed on viral isolates from the cases to determine if viruses were genetically linked; no information was given whether family A members expectorated sputum into the drains.
Figure:
Note: Adapted from Kang et al. Suggested flow for sewage (thick arrows) and aerosols (thin arrows) through the drainage system. After toilet flushing, aerosols pass through U-trap with dried out water seals under floor and bathtub drains (but not through U-traps with water), and gas plumes containing bioaerosols may escape into master bathrooms of vertically aligned apartments. Available via American College of Physicians Public Health Emergency Collection through PubMed Central.
Implications for both studies (van Doorn et al. and Kang et al.): Some COVID-19 patients shed SARS-CoV-2 RNA in stool for weeks after symptom onset and replication-competent virus has been demonstrated in a minority; fomites or inhalation of bioaerosols containing virus might play roles in SARS-CoV-2 transmission. An editorialexternal icon notes that Kang et al. adds to growing evidence that wastewater plumbing systems might be reservoirs for SARS-CoV-2 and other pathogens. While hand hygiene is critical in preventing fecal-oral (via contact with respiratory mucosa) transmission, improving bathroom ventilation and periodically running faucets to ensure U-trap water seals are not dried out, particularly in high-rise buildings, might also help prevent transmission.
Sequencing of virus isolated from infected persons enables the construction of phylogenetic trees that show how viruses are genetically related to one another. These trees can inform the epidemiology of spread of infection, including detection of related strains of virus and identification of unrecognized routes of infection.
PREPRINTS (NOT PEER-REVIEWED)
Phylogenetic analysis of SARS-CoV-2 in the Boston area highlights the role of recurrent importation and superspreading events.external icon Lemieux et al. medRxiv (August 25, 2020). ). Publishedexternal icon in Science (December 10, 2020).
Key findings:
- Eighty-two independent introductions of genetically distinct SARS-CoV-2 virus into Boston were identified during the study period.
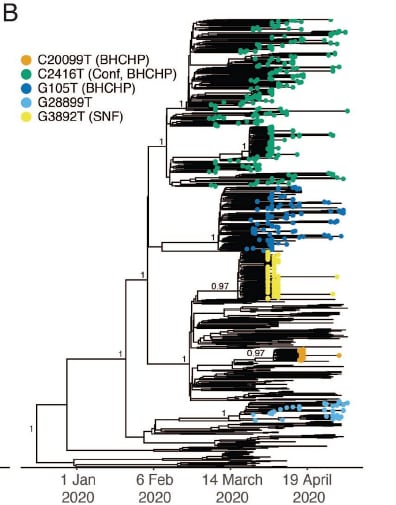
- One superspreading event causing >90 COVID-19 cases occurred at a conference and 28/28 sequenced viruses from associated cases contained the C2416T allele.
- Virus with this allele spread in Boston after the event, comprising 35.1% of analyzed specimens.
- Of 193 samples collected in association with a homeless shelter with superspreading events, 54.4% contained allele C2416T.
Methods: Phylogenetic analysis of complete and partial genome sequences of virus from NP samples tested from 772 persons collected between January and May 2020. Superspreading events, defined as eight or more secondary infections from a primary source, were evaluated. Limitations: Non-randomized sampling and incomplete state-level data.
Figure:
Note: Adapted from Lemieux et al. Phylogenetic tree demonstrating superspreading events from a conference (Conf) that spread to a homeless shelter (BHCHP) (C2416T) and had sustained transmission vs independent non-sustained superspreading events in the same shelter (G105T, C20099T) and a skilled nursing facility (G2892T). Licensed under CC 4.0.
SARS-CoV-2 lineage B.6 is the major contributor to transmission in Malaysiaexternal icon. Chong et al. bioRxiv (August 27, 2020). Publishedexternal icon in PLoS Neglected Tropical Diseases (November 30, 2020).
Key findings:
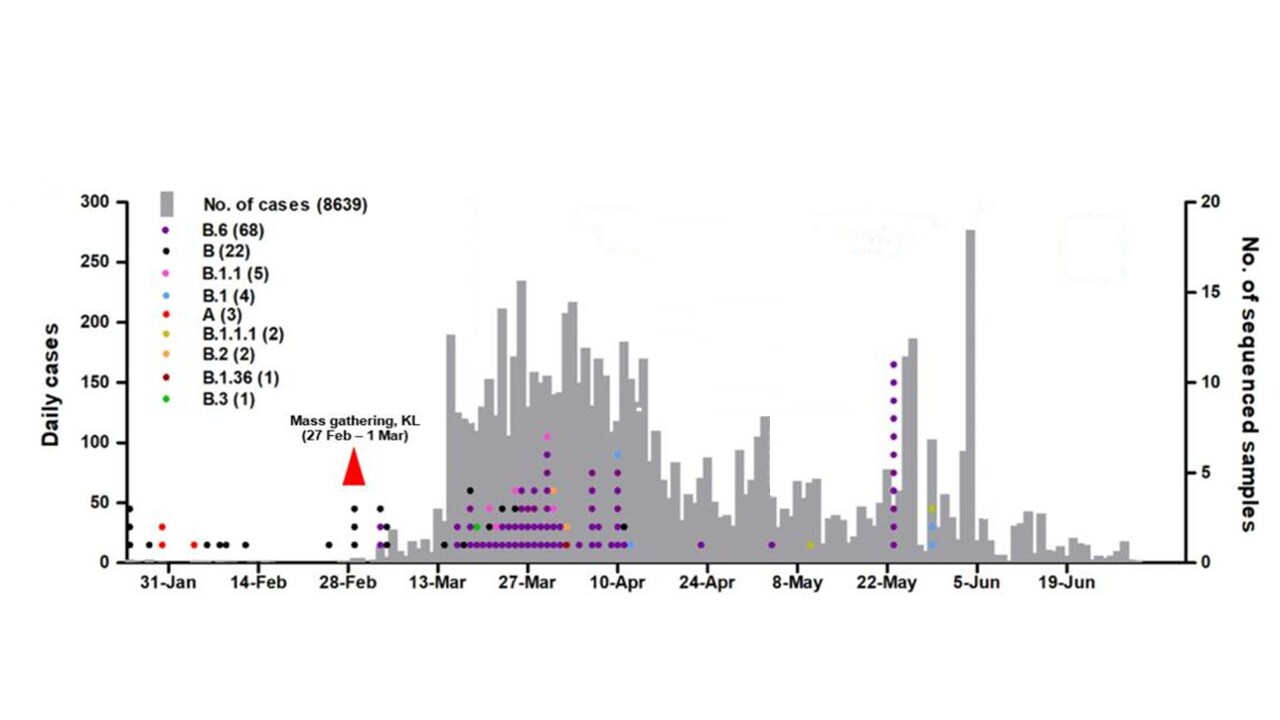
- Although the B.6 lineage represents ~1.4% of virus sequences worldwide, 68/108 (62.9%) sequences from Malaysia were from the B.6 lineage.
- In Malaysia, a spike of lineage B.6 began a week after a mass gathering in Kuala Lumpur that was attended by ~1,500 participants from nearby countries (Figure 1).
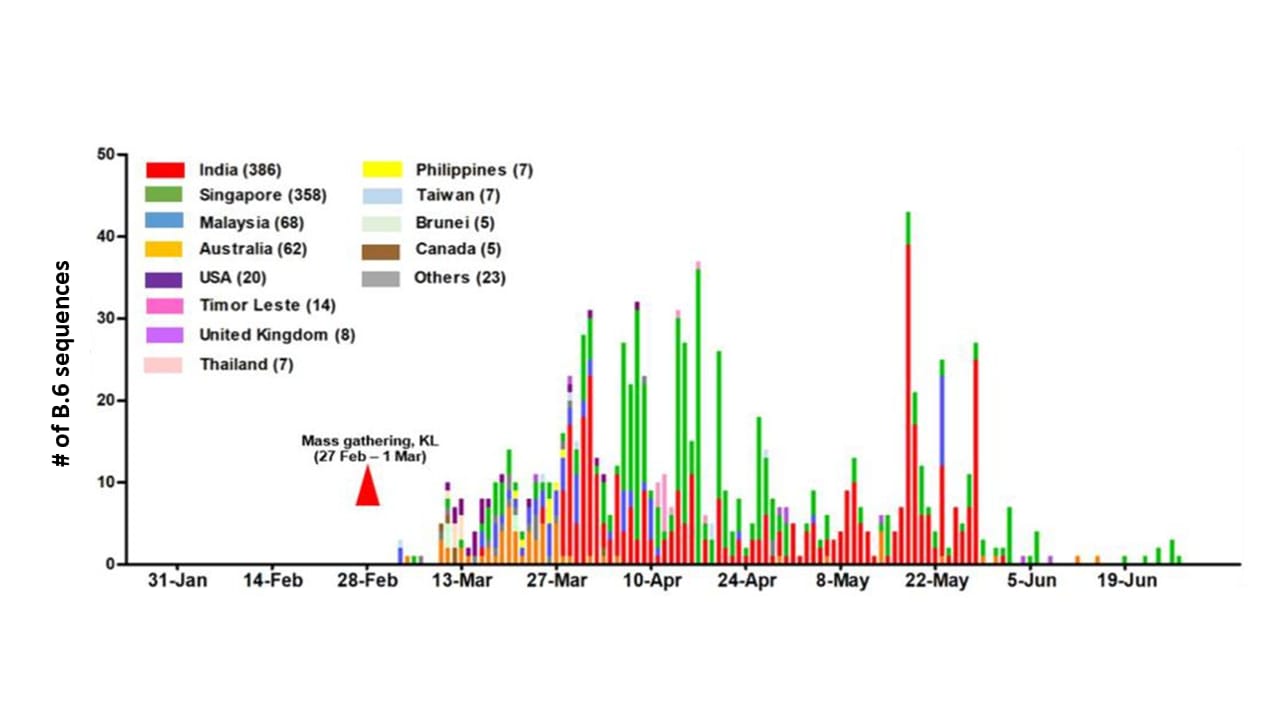
- B.6 virus lineage sequences emerged in nearby countries soon after the mass gathering (Figure 2).
Methods: 108 Malaysian sequences were used to study the genetic diversity and epidemiology of SARS-CoV-2 in Malaysia, relative to regional and worldwide virus lineages. To examine regional spread of the B.6 lineage, country of origin was analyzed for all B.6 lineage sequences (n = 970) in a global database of >60,000 viral sequences. Limitations: Potential sampling bias.
Figure 1
Note: Adapted from Chong et al. Daily cases in Malaysia in grey plotted on the left axis. The number of virus samples sequenced from different persons is on the right y-axis and colored by lineage (B.6 is purple, first reported globally March 4, 2020). KL = Kuala Lumpur, Malaysia. Licensed under CC-BY 4.0.
Note: Adapted from Chong et al. The number of B.6 lineage virus sequences per country as reported to a global database (as of July 17, 2020). The time of the mass gathering is noted by a triangle. KL-Kuala Lumpur, Malaysia. Licensed under CC-BY 4.0.
Implications for 2 studies (Lemieux et al. and Chong et al.): Phylogeny can be used to give insights into local and regional epidemiology as well as global epidemiology, as described by Gomez-Carballa et al. (Mapping genome variation of SARS-CoV-2 worldwide highlights the impact of COVID-19 super-spreadersexternal icon. Genome Research) and to identify superspreading events and their ability to cause sustained community transmission. Superspreading events that result in ongoing transmission may be the result of selection for greater viral fitness or special characteristics of infected populations, such as increased mobility or decreased control measures.
PEER-REVIEWED
Clinical characteristics and viral RNA detection in children with coronavirus disease 2019 in the Republic of Koreaexternal icon. Han et al. JAMA Pediatrics (August 28, 2020).
Key findings:
- Among 91 children with confirmed COVID-19, 20 (22.0%) were asymptomatic.
- Among 71 symptomatic cases: 47 (66%) had symptoms a median of 3 (range 1-28) days prior to diagnosis, 18 (25%) developed symptoms after diagnosis, and 6 (9%) were diagnosed at the time of symptom onset.
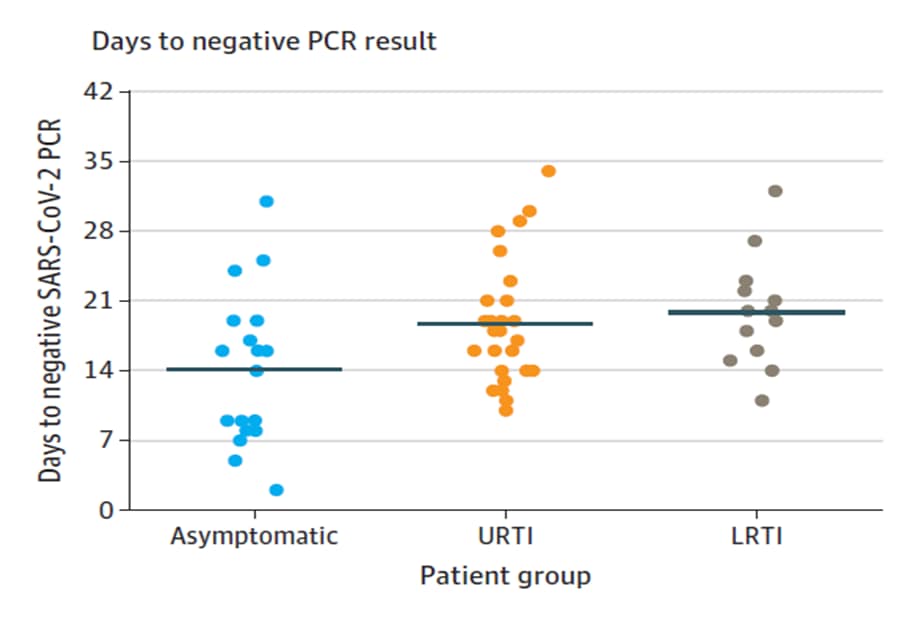
- No difference in duration of virus RNA detection between 41 children with upper respiratory tract infection (RTI) and 22 with lower RTI (mean [SD], 18.7 [5.8] days vs 19.9 [5.6] days; p = 0.54; Figure).
- SARS-CoV-2 RNA was detected for a mean of 17.6 days in all and 14.1 days in asymptomatic cases.
Methods: Case series from 20 hospitals and 2 isolation facilities between February 18, 2020 and March 31, 2020 among children (<19 years) with SARS-CoV-2 infection confirmed by RT-PCR. Main outcomes were clinical manifestations and duration of SARS-CoV-2 RNA detection. Upper and lower RTIs were diagnosed with chest radiographs or computed tomography. Limitations: Not able to analyze transmissibility of infections; follow-up tests not at uniform intervals; no age-disaggregated analyses.
Implications: Symptom screening alone may not identify many COVID-19 cases in children as 1 in 5 are asymptomatic and those who were symptomatic had a wide range of symptoms that may be difficult to recognize as COVID-19 without further testing. This study also shows a long period with detectable SARS-CoV-2 RNA among symptomatic and asymptomatic children. Studies are needed to determine if the virus remains infectious during the period of detection.
Figure:
Note: From Han et al. Mean duration from symptom onset to negative SARS-CoV-2 RT-PCR results in 20 asymptomatic patients, 41 with upper respiratory tract infection (URTI) and 22 with lower respiratory tract infection (LRTI). Solid line indicates mean value. Licensed under CC-BY.
Findings from a probability-based survey of U.S. households about prevention measures based on race, ethnicity, and age in response to SARS-CoV-2.external icon Sauceda et al. Journal of Infectious Diseases (August 29, 2020).
Key findings:
- Non-Latino White, African American, and Latino respondents engaged in nearly the same way in individual prevention measures taken in response to SARS-CoV-2.
- Latino respondents were less likely to report social distancing vs White respondents.
- Latino and African American respondents reported being less likely to use technology-based strategies compared to White respondents.
- Respondents age >60 years reported being less likely to use a website to log symptoms or installing an app that asks about symptoms compared with those age 18-29.
Methods: Phone and online survey data in 1395 non-Latino White, 265 African American, and 369 Latino respondents in the US between April 20 and 26, 2020. Demographic and social differences were examined on infection prevention behaviors, SARS CoV-2 testing, and likelihood of using technology for public health monitoring (tracking app, app that asks about symptoms or website to log symptoms and get recommendations). Limitations: Differences by phone vs online administration is not reported; survey was not validated; rates of some behaviors not reported.
Implications: Understanding differences in behaviors and intentions across demographic groups may assist in tailoring messaging and policies to increase uptake of recommended practices and digital tools for public health monitoring.
PEER-REVIEWED
Low risk of COVID-19 among patients exposed to infected healthcare workers.external icon Baker et al. Clinical Infectious Diseases (August 28, 2020).
Key findings:
- Only one case of COVID-19 (0.4%) could be attributed to a healthcare exposure.
- All exposures were to infected healthcare providers (HCPs; n = 60) and there were no documented patient-to-patient exposures.
- Most of the infected HCPs were nurses (35/60; 58%) followed by physicians (12/60; 20%) and patient care associates (7/60; 12%).
- Majority of exposures occurred in the inpatient (75%) vs outpatient areas (25%).
Methods: Contact tracing was conducted between March 1 and June 10, 2020 for 238 patients with healthcare exposure to SARS-CoV-2 in a large academic hospital. Follow-up information was available for 226 of 253 exposures, defined as ≥10 minutes of face-to-face contact within 6 feet, during which ≥1 person was not wearing a mask. A COVID-19 case was healthcare-associated if it occurred within 14-days of healthcare exposure. Limitations: Single site; exposure definition, mask requirements and testing recommendations changed during the observation period.
Implications: The risk of SARS CoV-2 transmission from HCP to patients appears to be low in hospital inpatient and outpatient settings. Given routinely practiced infection control precautions and the quality of ventilation in settings, avoiding urgent medical care is likely to present a greater risk to patients than presenting to a healthcare setting when care is needed.
Outbreak of COVID-19 in a nursing home associated with aerosol transmission as a result of inadequate ventilationexternal icon. de Man et al. Clinical Infectious Diseases (August 28, 2020).
Key findings:
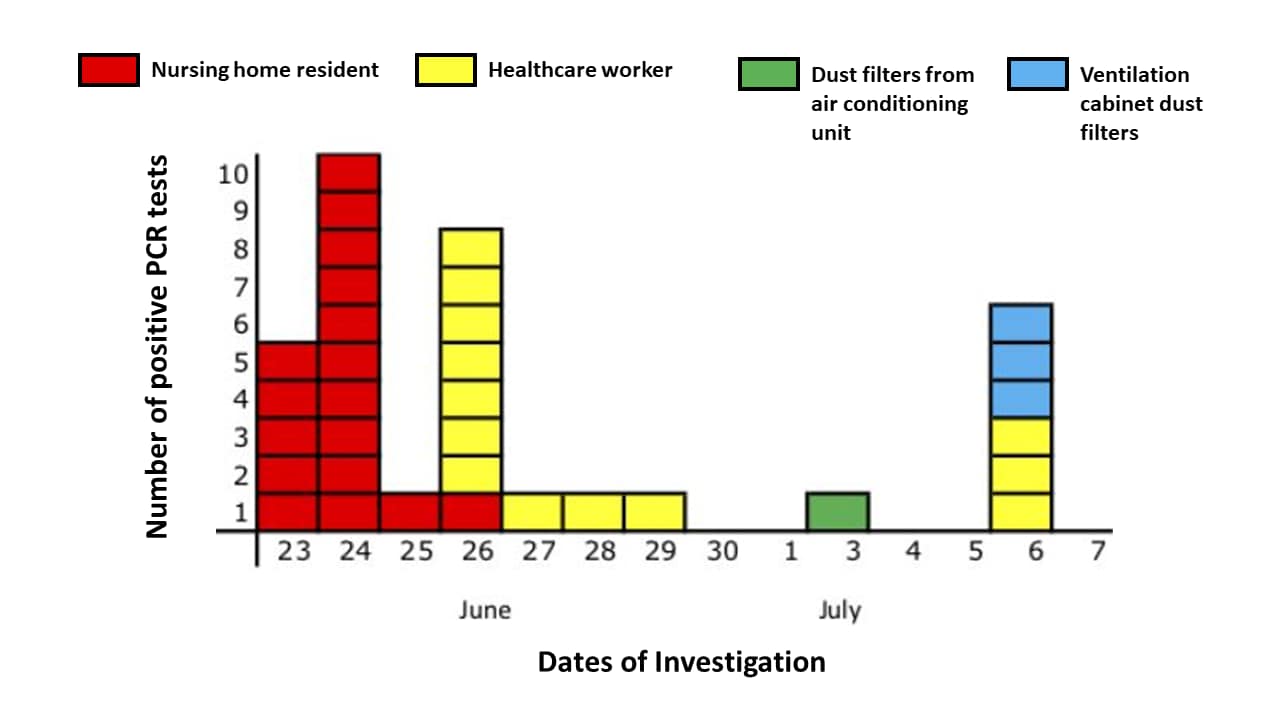
- On one nursing home ward with a new energy-efficient ventilation system, 17 (81%) residents and 17 (50%) health care workers tested positive for SARS-CoV-2 over two weeks (Figure).
- Tests of residents (95) and health care workers (106) on other wards ventilated with outside air were negative.
- SARS-CoV-2 RNA was detected on 1 of 2 air conditioner filters (Ct value 43) and in 3 of 8 ventilation cabinet dust filters (Ct values 37-40) through which indoor air was recirculated on the affected ward (Figure).
Methods: Epidemiologic investigation with clinical and environmental sampling for SARS CoV-2 among 21 nursing home residents, 34 health care workers, air conditioning and ventilation systems. At the time of the study there was very low community prevalence such that multiple introduction of SARS-CoV-2 into the ward was unlikely. Limitations: Transmission through droplets or direct contact cannot be excluded; relatedness of viral isolates was not confirmed using whole-genomic sequencing.
Implications: Ventilation with outside air might help prevent aerosol transmission of SARS-CoV-2 in congregate living facilities.
Figure:
Note: From de Man et al. Date of testing positive for SARS-CoV-2 RNA of nursing home residents (17 of 21), healthcare workers (13 of 34), dust filters from air conditioning units (1 of 2), and ventilation cabinet dust filters (3 of 8). Specimens from four additional healthcare workers from the ward tested positive in other laboratories and are not shown. Reproduced by permission of Oxford University Press on behalf of the Infectious Diseases Society of America. Please visit: https://academic.oup.com/cid/advance-article/doi/10.1093/cid/ciaa1270/5898577external icon.
Time course of a second outbreak of COVID-19 in Beijing, China, June-July 2020external icon. Wu et al. JAMA (August 24, 2020).
Key findings:
- A total of 335 COVID-19 cases were identified.
- An additional 33 persons (9.9%) were asymptomatic.
- 272 (74%) persons worked at or visited the Xinfadi Agricultural Wholesale market and the remaining 96 (26%) were their close contacts.
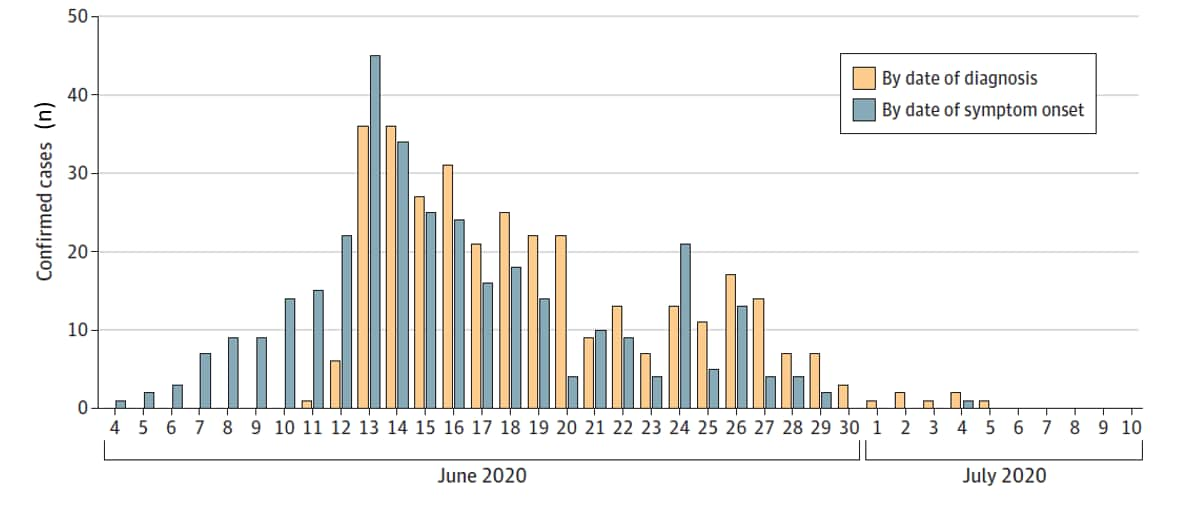
- The number of cases rapidly declined after July 1 and no cases were detected after July 5.
Methods: Following 56 consecutive days without local SARS-CoV-2 transmission, a COVID-19 outbreak was detected in Beijing, China between June 11 and July 10, 2020. Outbreak cases were persons with a positive SARS-CoV-2 RT-PCR from NP swab and COVID-19-like symptoms. Investigation of the outbreak included isolation of cases and persons with asymptomatic infection, contact tracing, quarantining close contacts and environmental testing. Limitations: Asymptomatic persons with a positive RT-PCR were not counted as cases; environmental testing results are not yet available.
Implications: COVID-19 outbreaks can occur after prolonged periods without local transmission. Quick identification and isolation of cases, aggressive contact tracing and other response efforts were key to outbreak containment.
Figure:
Note: Adapted from Wu et al. Epidemiologic curve of confirmed cases by date of diagnosis and date of symptom onset. Reproduced with permission from JAMA. Time course of a second outbreak of COVID-19 in Beijing, China, June-July 2020. Published online August 24, 2020. doi:10.1001/jama.2020.15894. Copyright©2020 American Medical Association. All rights reserved.
PEER-REVIEWED
Anticoagulation, mortality, bleeding and pathology among patients hospitalized with COVID-19: A single health system studyexternal icon. Nadkarni, et al. Journal of American College of Cardiology. (August 20, 2020).
Key findings:
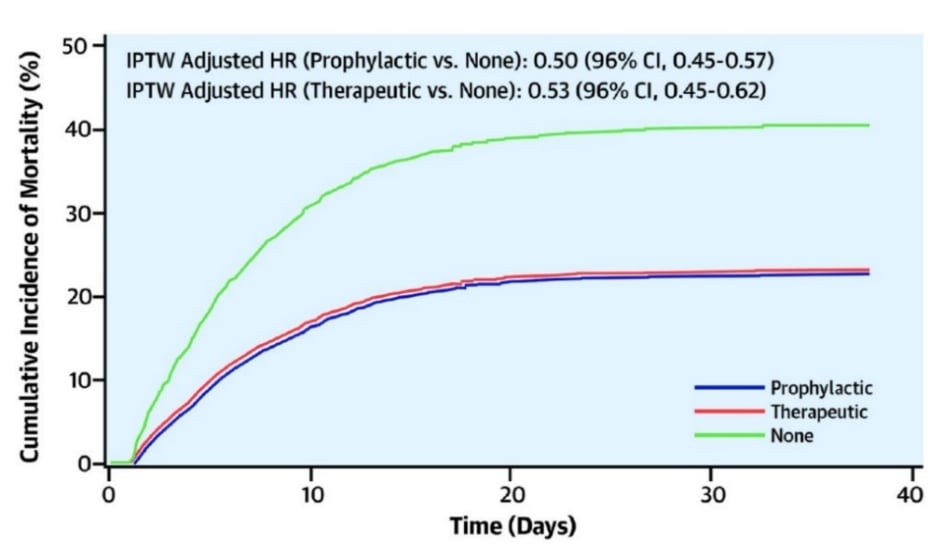
- Patients who received therapeutic anticoagulation (AC) (n = 900, 20.5%) and prophylactic AC (n = 1959, 44.6%) had lower in-hospital mortality compared with patients with no AC (n = 1530, 34.9%; Figure 1).
- Need for intubation was less frequent with therapeutic and prophylactic AC (adjusted hazard ratio [aHR] 0.69, 95%CI 0.51-0.94, and aHR 0.72, 95% CI 0.58-0.89, respectively) compared with no AC.
- When initiated ≤48 hours from admission, there were no differences in intubation between therapeutic (n = 766) vs. prophylactic AC (n = 1860).
Methods: A retrospective analysis of 4,389 COVID-19 adult patients admitted with lab-confirmed SARS-CoV-2 infection between March 1 and April 30, 2020 examining association of AC with mortality, intubation and major bleeding. Sub-analyses were conducted on association of therapeutic vs prophylactic AC initiated ≤48 hours from admission. Limitations: Regimens and dosages were not strictly controlled between groups representing therapeutic and prophylactic AC; details on categorization of therapeutic vs prophylactic AC not given.
Implications: AC may be associated with better survival and less frequent intubation among patients hospitalized with COVID-19. These data may help inform clinical trials and guidance regarding optimal AC regimens for patients with COVID-19.
Figure:
Note: From Nadkarni, et al. Mortality among those with prophylactic, therapeutic and no AC in hospitalized patients with COVID-19. IPTW-inverse probability treatment weighted; HR-hazard ratio. This article was published in Journal of American College of Cardiology, Vol 76, Nadkarni et al., Anticoagulation, mortality, bleeding and pathology among patients hospitalized with COVID-19: A single health system study, 1815-1826, Copyright Elsevier on behalf of American College of Cardiology Foundation 2020. This article is currently available at the Elsevier COVID-19 resource centre: https://www.elsevier.com/connect/coronavirus-information-centerexternal icon.
SARS-CoV-2 RNA in serum as predictor of severe outcome in COVID-19: A retrospective cohort studyexternal icon. Hagman et al. Clinical Infectious Diseases (August 28, 2020).
Key findings:
- 61 (37%) COVID-19 patients had SARS-CoV-2 detected in sera.
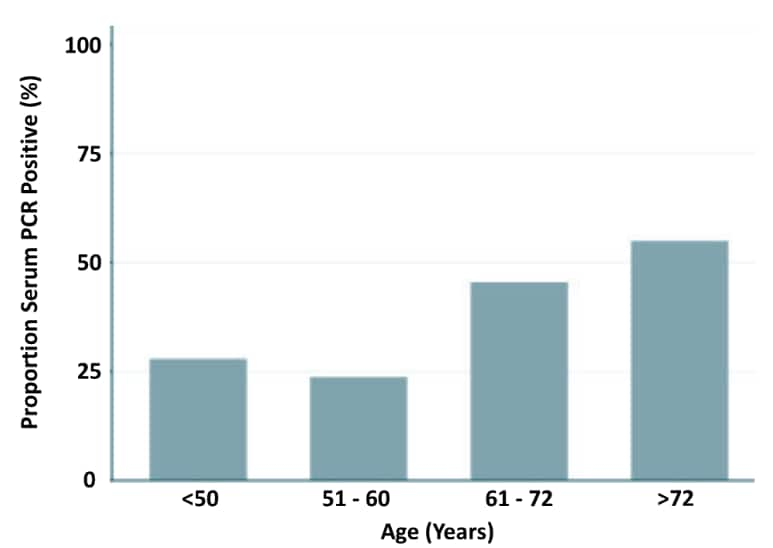
- Those with SARS-CoV-2 detected were older (median age 62 vs 53; p <0.001) (Figure 1).
- 44% of patients with SARS-CoV-2 detected were either admitted to the ICU or died vs 7% of patients without SARS-CoV-2 detected (Figure 2A).
- 25% of patients with SARS-CoV-2 detected died vs 3% of patients without SARS-CoV-2 detected (Figure 2B).
Methods: Retrospective cohort study investigating SARS-CoV-2 RNA by PCR analysis in serum of 167 confirmed COVID-19 patients admitted between April 10 and June 30, 2020, Stockholm, Sweden. Samples were taken less than 3 days after admission and ~10 days after symptoms began. Patients were followed for 28 days. Multivariate analysis was performed using predictors for severe disease. Limitations: Until May 10, only severely ill patients were tested for SARS CoV-2 in blood.
Implications: Testing for virus in the blood at the time of admission may help identify COVID-19 patients who are at a high risk for critical disease and death.
Figure 1
Note: From Hagman et al. Percent SARS-CoV-2 positivity in blood by different age groups. Licensed under CC-BY-NC-ND.
Figure 2
Note: Adapted from Hagman et al. Kaplan-Meier estimates A: progression to critical disease (ICU/mortality); B: death alone. HR-Hazard ratio. Licensed under CC-BY-NC-ND.
PEER-REVIEWED
Antibody profiles according to mild or severe SARS-CoV-2 infection, Atlanta, Georgia, USA, 2020. Hu et al. Emerging Infectious Diseases (August 28, 2020).
Key findings:
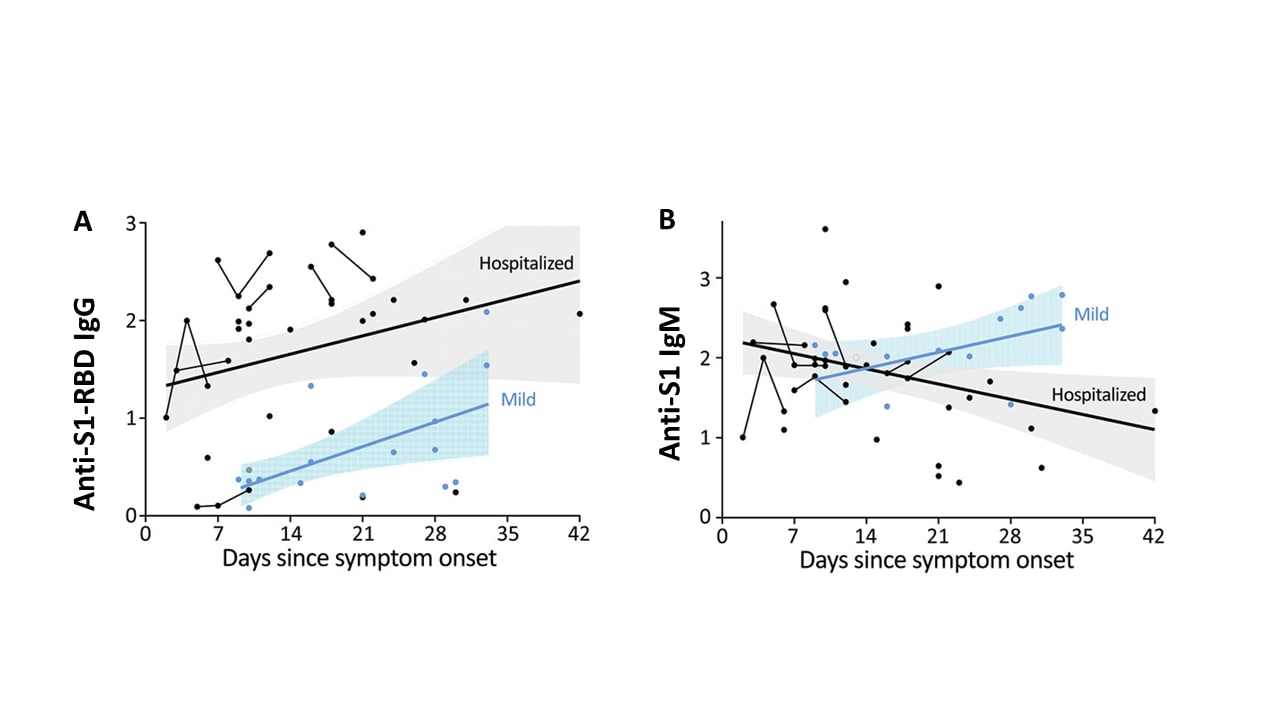
- Anti-SARS-CoV-2 IgG levels increased early after symptom onset and remained elevated in hospitalized patients with severe COVID-19 (Figure A).
- The group with mild disease had lower IgG levels early after symptom onset.
- Anti-SARS-CoV-2 IgM levels were detectable early after symptom onset regardless of disease severity (Figure B).
- A diagnostic algorithm of IgG from hospitalized participants performed poorly for detection of mild COVID-19.
Methods: Characterization of anti-SARS-CoV-2 IgM and IgG directed at the spike protein receptor binding domain (S1-RBD) in specimens collected from COVID-19 patients (28 severe hospitalized, 15 mild recovered), 103 healthy adults (collected before 2020 and used as control for background antibody levels) and 116 persons who had recovered from an influenza-like illness. Limitations: Small sample; IgA not measured; certain viral protein targets not tested.
Implications: Absence of IgG may not exclude mild COVID-19 and serologic testing should include both IgG and IgM when using serology for diagnosis of recent infection.
Figure:
Note: Adapted from Hu et al. Levels of SARS CoV-2 IgG against the receptor-binding domain (RBD) of the spike protein subunit (S1) (A) and IgM against S1 (B) according to time from symptom onset in mild and severe hospitalized COVID-19 cases. Although not stated explicitly, each dot is a sample, and thin lines connecting dots are measurements from a single patient. Best fit thicker lines are drawn for mild and severe hospitalized cases with shaded confidence intervals. Antibody levels are on each y-axis. Open access journal; all content freely available.
Advances in Testing
- Service R. Spit shines for easier coronavirus testing.external icon Saliva-based testing is easier, accurate, and because it directly tests the fluid responsible for transmission, may give a better indication of who is most contagious.
- Wylie et al. Saliva or nasopharyngeal swab specimens for detection of SARS-CoV-2external icon Test performance and easier collection supports saliva testing for SARS-CoV-2.
- Dora et al. Using Serologic testing to assess the effectiveness of outbreak control efforts, serial PCR testing, and cohorting of positive SARS-CoV-2 patients in a skilled nursing facility.external icon Clinical Infectious Diseases. After residents were serially tested by RT-PCR and positive residents were cohorted, serology performed 46-76 days later supported these procedures in disrupting transmission in nursing homes.
Vaccine Approval
- Avorn et al. Regulatory decision-making on COVID-19 vaccines during a public health emergency.external icon Discusses external pressures that may be exerted on FDA approval or emergency authorization and urges a rigorous approach to COVID-19 vaccine evaluation and deployment.
- Thompson et al. Emergency use authorizations during the COVID-19 pandemic lessons from hydroxychloroquine for vaccine authorization and approval.external icon Recounts the FDA’s Emergency Use Authorization (EUA) of hydroxychloroquine for treatment of COVID-19 and its subsequent revocation and suggests several improvements to the EUA process.
Transmission and Disease Severity
- Figueroa et al. Community-level factors associated with racial and ethnic disparities in COVID-19 rates in Massachusettsexternal icon. Health Affairs. A study of 351 Massachusetts cities found that independent predictors of higher COVID-19 rates included the community’s proportion of Black residents, foreign-born non-citizens, mean household size, and share of food service workers.
- Boulle et al. Risk factors for COVID-19 death in a population cohort study from the Western Cape Province, South Africaexternal icon. Clinical Infectious Diseases. In contrast to findings from a NYC cohortexternal icon, this large South African cohort showed that both HIV and current tuberculosis were associated with increased COVID-19 mortality.
- DeBiasi et al. Symptomatic and asymptomatic viral shedding in pediatric patients infected with severe acute respiratory syndrome coronavirus 2 (SARS-CoV-2): Under the surface.external icon JAMA Pediatrics. Commentary on Han et al., points to the robust public health infrastructure in S. Korea that enabled isolation and sequential observation and testing of asymptomatic and symptomatic children with SARS CoV-2.
Other Topics
- Morens et al. Emerging pandemic diseases: How we got to COVID-19external icon. Newly emergent or re-emergent pathogens reflect complex dynamics within global ecosystems, and better understanding of human involvement in host, agent, and environmental dynamics is necessary for controlling future outbreaks.
- Siddiqi H. To suffer alone: Hospital visitation policies during COVID-1external icon Journal of Hospital Medicine. Viewpoint about how visitors in hospitals should be considered moving forward in the COVID-19 pandemic.
Disclaimer: The purpose of the CDC COVID-19 Science Update is to share public health articles with public health agencies and departments for informational and educational purposes. Materials listed in this Science Update are selected to provide awareness of relevant public health literature. A material’s inclusion and the material itself provided here in full or in part, does not necessarily represent the views of the U.S. Department of Health and Human Services or the CDC, nor does it necessarily imply endorsement of methods or findings. While much of the COVID-19 literature is open access or otherwise freely available, it is the responsibility of the third-party user to determine whether any intellectual property rights govern the use of materials in this Science Update prior to use or distribution. Findings are based on research available at the time of this publication and may be subject to change.

